

Characterization of the bovine salivary gland transcriptome associated with Mycobacterium avium subsp. paratuberculosis experimental challenge
- PMID: 31195975
- PMCID: PMC6567491
- DOI: 10.1186/s12864-019-5845-4
Characterization of the bovine salivary gland transcriptome associated with Mycobacterium avium subsp. paratuberculosis experimental challenge
Abstract
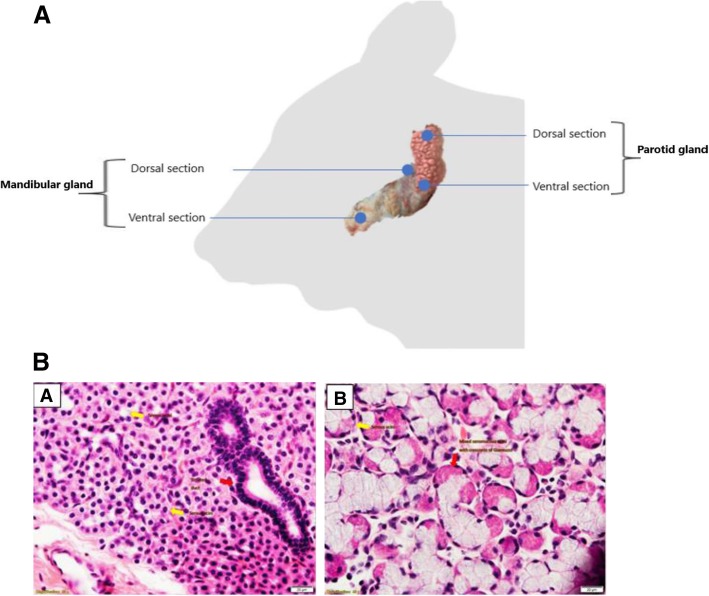
Background: Mycobacterium avium subsp. paratuberculosis (MAP), the etiologic agent of Johne's disease is spread between cattle via the fecal-oral route, yet the functional changes in the salivary gland associated with infection remain uncharacterized. In this study, we hypothesized that experimental challenge with MAP would induce stable changes in gene expression patterns in the salivary gland that may shed light on the mucosal immune response as well as the regional variation in immune capacity of this extensive gland. Holstein-Friesian cattle were euthanized 33 months' post oral challenge with MAP strain CIT003 and both the parotid and mandibular salivary glands were collected from healthy control (n = 5) and MAP exposed cattle (n = 5) for histopathological and transcriptomic analysis.
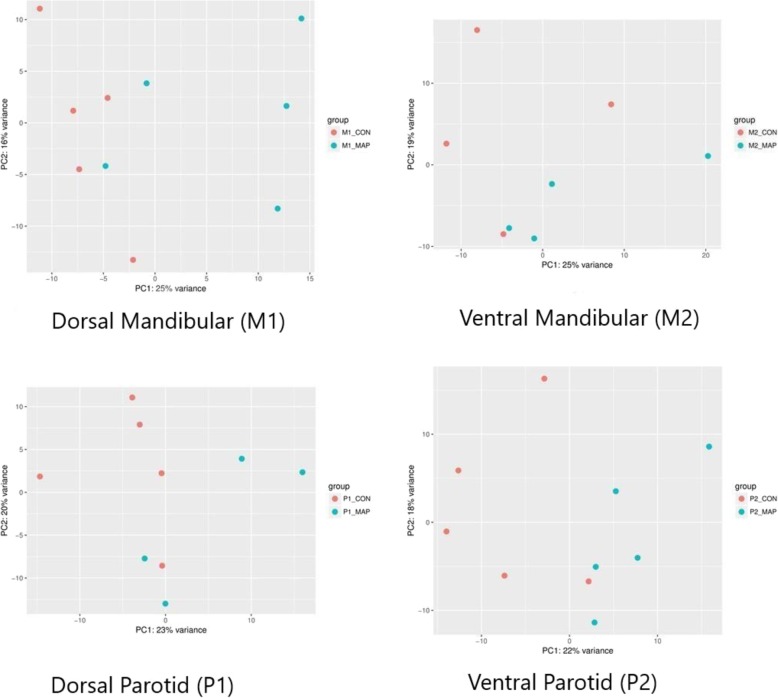
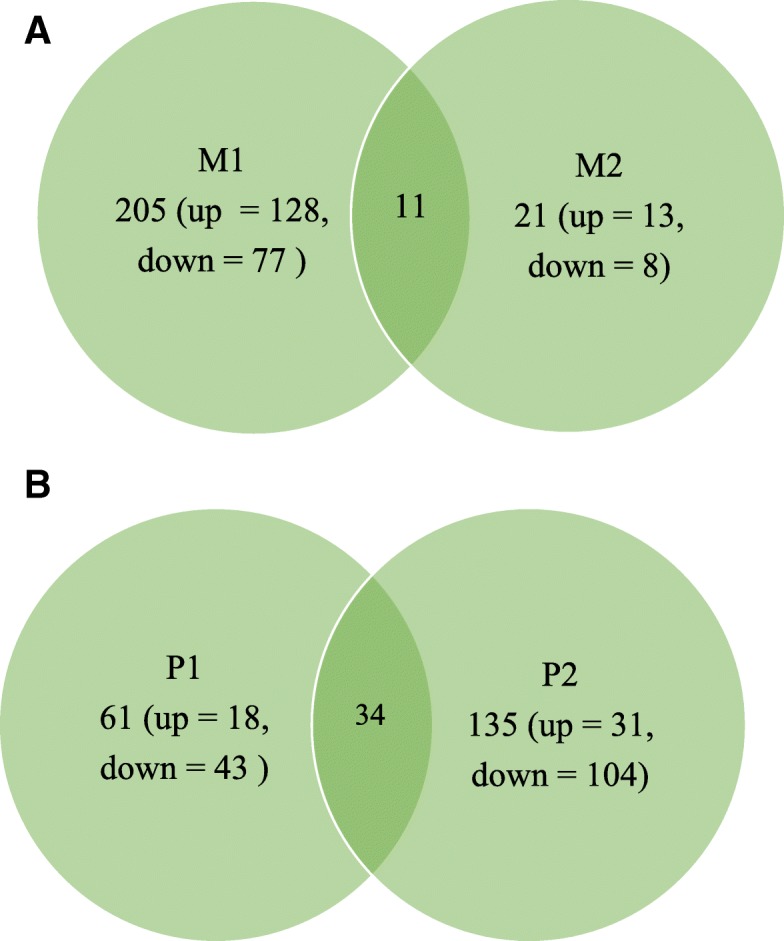
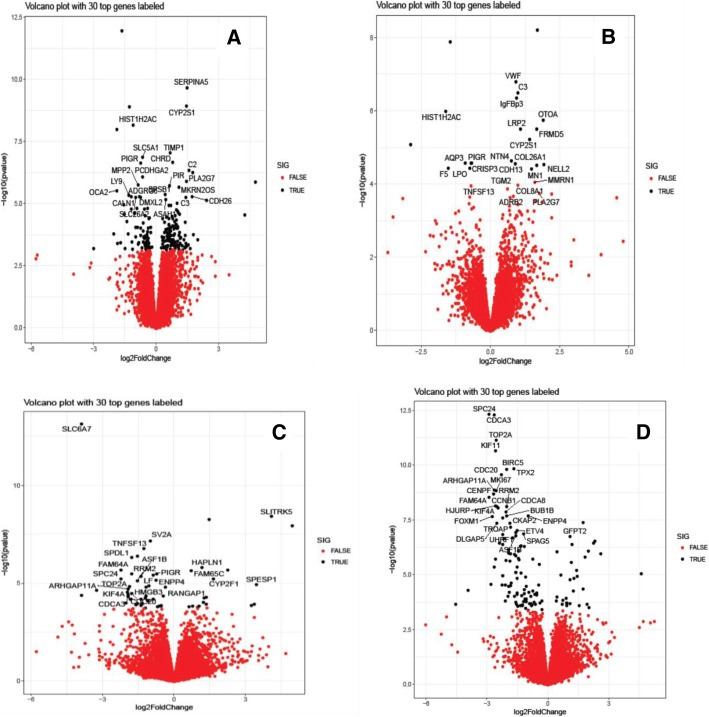
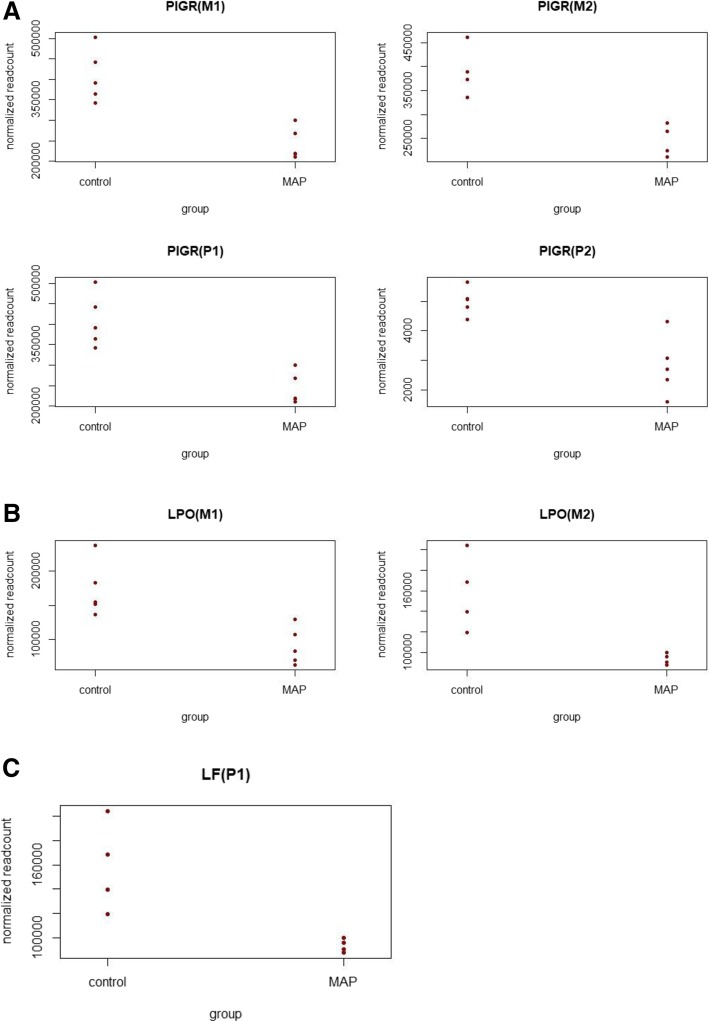
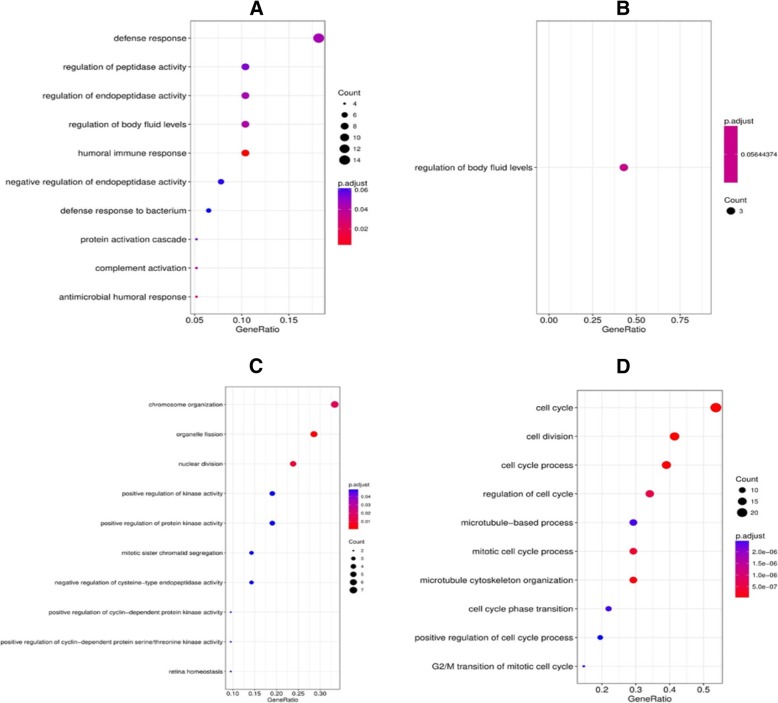
Results: A total of 205, 21, 61, and 135 genes were significantly differentially expressed between control and MAP exposed cattle in dorsal mandibular (M1), ventral mandibular (M2), dorsal parotid (P1) and ventral parotid salivary glands (P2), respectively. Expression profiles varied between the structurally divergent parotid and mandibular gland sections which was also reflected in the enriched biological pathways identified. Changes in gene expression associated with MAP exposure were detected with significantly elevated expression of BoLA DR-ALPHA, BOLA-DRB3 and complement factors in MAP exposed cattle. In contrast, reduced expression of genes such as polymeric immunoglobin receptor (PIGR), TNFSF13, and the antimicrobial genes lactoferrin (LF) and lactoperoxidase (LPO) was detected in MAP exposed animals.
Conclusions: This first analysis of the transcriptomic profile of salivary glands in cattle adds an important layer to our understanding of salivary gland immune function. Transcriptomic changes associated with MAP exposure have been identified including reduced LF and LPO. These critical antimicrobial and immunoregulatory proteins are known to be secreted into saliva and their downregulation may contribute to disease susceptibility. Future work will focus on the validation of their expression levels in saliva from additional cattle of known infection status as a potential strategy to augment disease diagnosis.
Keywords: Biomarkers; Cattle; Johne’s disease; RNA-Seq; Saliva; Salivary glands.
Conflict of interest statement
The authors declare that they have no competing interests.
Figures
Similar articles
-
Johne's disease in cattle: an in vitro model to study early response to infection of Mycobacterium avium subsp. paratuberculosis using RNA-seq.Mol Immunol. 2017 Nov;91:259-271. doi: 10.1016/j.molimm.2017.08.017. Epub 2017 Oct 5. Mol Immunol. 2017. PMID: 28988040
-
A long-term bacteriological and immunological study in Holstein-Friesian cattle experimentally infected with Mycobacterium avium subsp. paratuberculosis and necropsy culture results for Holstein-Friesian cattle, Merino sheep and Angora goats.Vet Microbiol. 2007 May 16;122(1-2):83-96. doi: 10.1016/j.vetmic.2006.12.030. Epub 2007 Jan 16. Vet Microbiol. 2007. PMID: 17289303
-
Preliminary exploration of mRNA, lncRNA, and miRNA expressions in the bovine jejunum unveils novel aspects of Mycobacterium avium subspecies paratuberculosis infections.BMC Genomics. 2025 Feb 4;26(1):108. doi: 10.1186/s12864-025-11299-1. BMC Genomics. 2025. PMID: 39905315 Free PMC article.
-
Potential application of emerging diagnostic techniques to the diagnosis of bovine Johne's disease (paratuberculosis).Vet J. 2016 Mar;209:32-9. doi: 10.1016/j.tvjl.2015.10.033. Epub 2015 Oct 22. Vet J. 2016. PMID: 26831164 Review.
-
Current perspectives on Mycobacterium avium subsp. paratuberculosis, Johne's disease, and Crohn's disease: a review.Crit Rev Microbiol. 2011 May;37(2):141-56. doi: 10.3109/1040841X.2010.532480. Epub 2011 Jan 22. Crit Rev Microbiol. 2011. PMID: 21254832 Review.
Cited by
-
RNA-sequencing studies suggest that microRNAs and alternative splicing of pre-mRNAs modulate immune and inflammatory responses in Holstein cattle infected with Mycobacterium avium subsp. paratuberculosis.Front Immunol. 2025 Jun 25;16:1597736. doi: 10.3389/fimmu.2025.1597736. eCollection 2025. Front Immunol. 2025. PMID: 40636120 Free PMC article. Review.
-
Association of genetic polymorphisms related to Johne's disease with estimated breeding values of Holstein sires for milk ELISA test scores.BMC Vet Res. 2020 May 27;16(1):165. doi: 10.1186/s12917-020-02381-9. BMC Vet Res. 2020. PMID: 32460776 Free PMC article.
-
Saliva NIR spectroscopy and Aquaphotomics: a novel diagnostic approach to Paratuberculosis in dairy cattle.Front Cell Infect Microbiol. 2024 Nov 13;14:1395949. doi: 10.3389/fcimb.2024.1395949. eCollection 2024. Front Cell Infect Microbiol. 2024. PMID: 39619662 Free PMC article.
-
Johne's Disease in Dairy Cattle: An Immunogenetic Perspective.Front Vet Sci. 2021 Aug 26;8:718987. doi: 10.3389/fvets.2021.718987. eCollection 2021. Front Vet Sci. 2021. PMID: 34513975 Free PMC article. Review.
-
Yeast cell wall upregulated cell-mediated immune responses to Newcastle disease virus vaccine.Poult Sci. 2022 Apr;101(4):101712. doi: 10.1016/j.psj.2022.101712. Epub 2022 Jan 10. Poult Sci. 2022. PMID: 35123352 Free PMC article.
References
-
- Chamberlin WM, Naser SA. Integrating theories of the etiology of Crohn’s disease On the etiology of Crohn’s disease: questioning the hypotheses. Med Sci Monit. 2006;12:RA27–RA33. - PubMed
MeSH terms
Grants and funding
LinkOut - more resources
Full Text Sources
Molecular Biology Databases
Miscellaneous
