. 2019 Jun 13;20(1):326.
doi: 10.1186/s12859-019-2926-y.

AutoCryoPicker: an unsupervised learning approach for fully automated single particle picking in Cryo-EM images

Affiliations

AutoCryoPicker: an unsupervised learning approach for fully automated single particle picking in Cryo-EM images

Adil Al-Azzawi et al. BMC Bioinformatics. .

Abstract

Background: An important task of macromolecular structure determination by cryo-electron microscopy (cryo-EM) is the identification of single particles in micrographs (particle picking). Due to the necessity of human involvement in the process, current particle picking techniques are time consuming and often result in many false positives and negatives. Adjusting the parameters to eliminate false positives often excludes true particles in certain orientations. The supervised machine learning (e.g. deep learning) methods for particle picking often need a large training dataset, which requires extensive manual annotation. Other reference-dependent methods rely on low-resolution templates for particle detection, matching and picking, and therefore, are not fully automated. These issues motivate us to develop a fully automated, unbiased framework for particle picking.

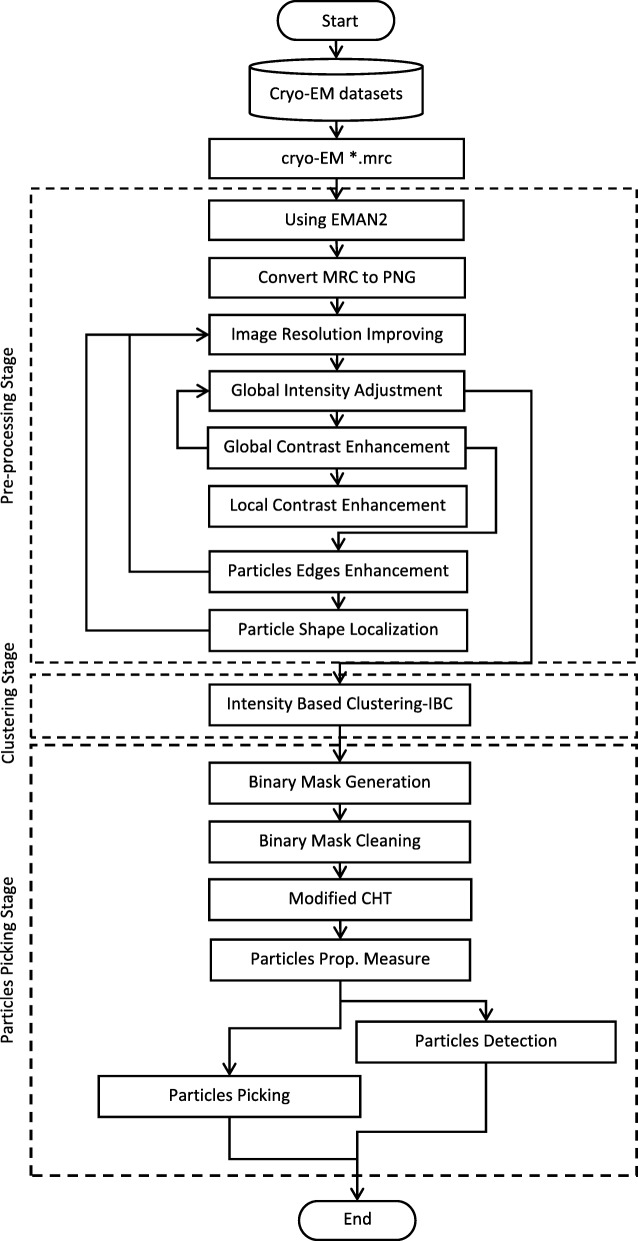
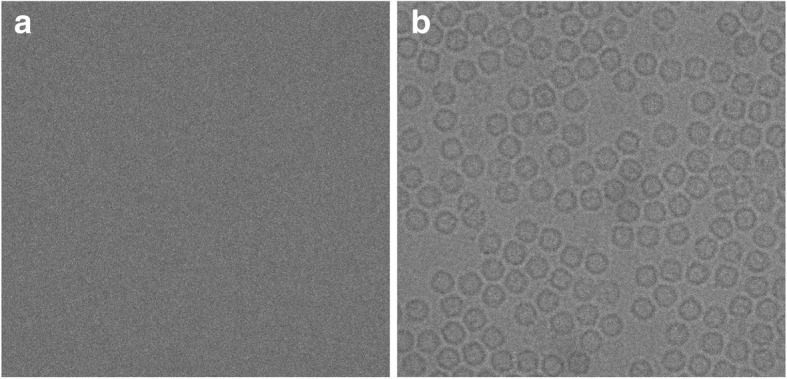
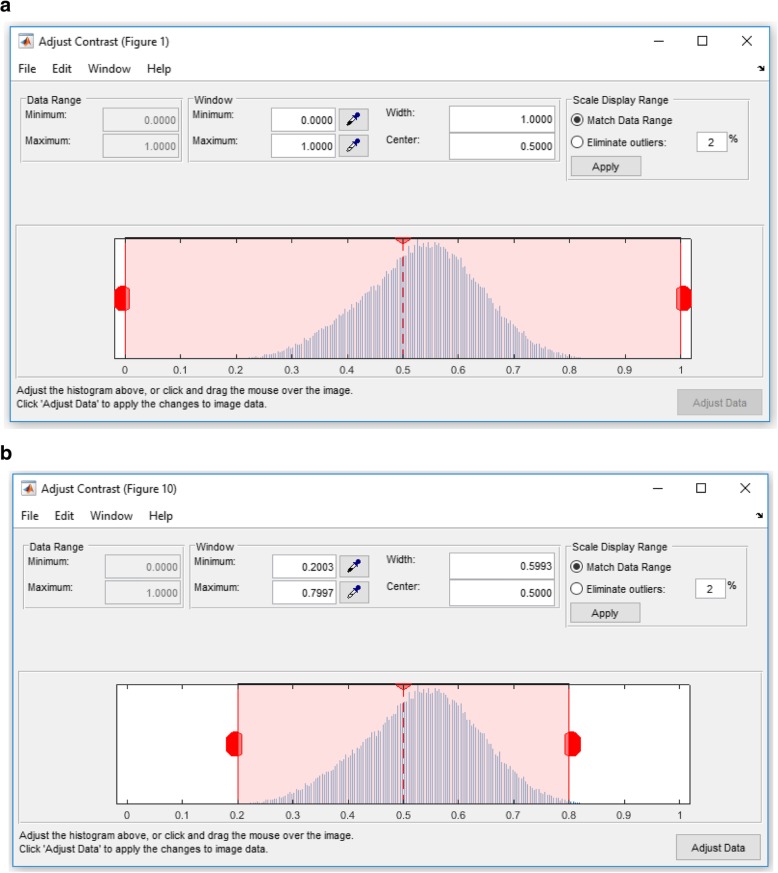
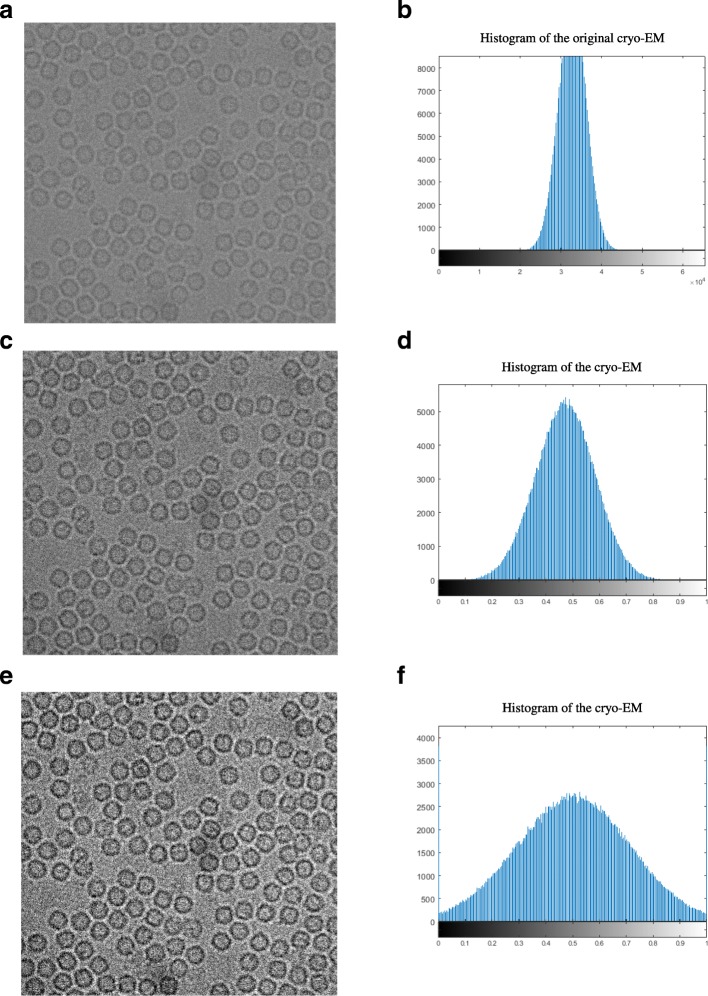
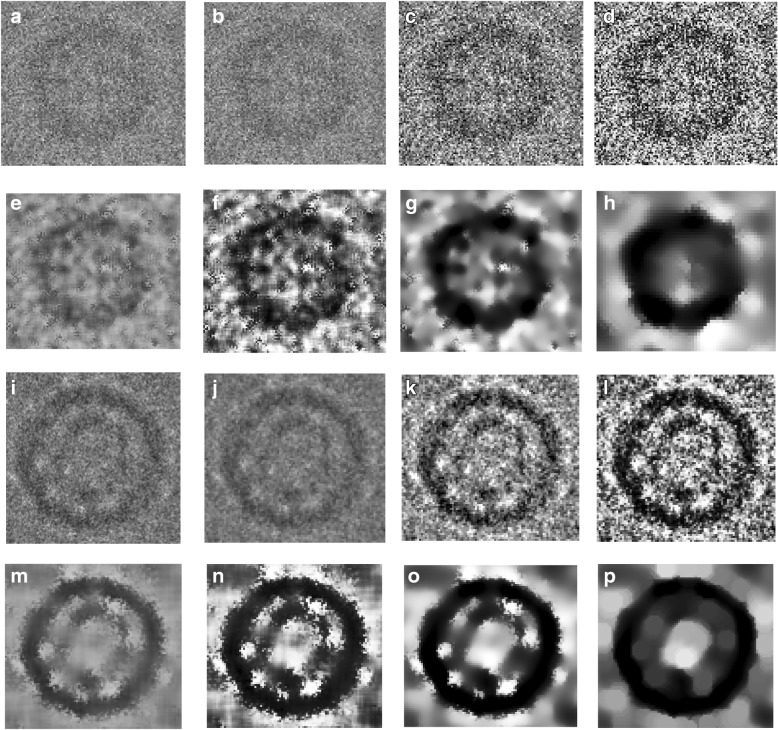
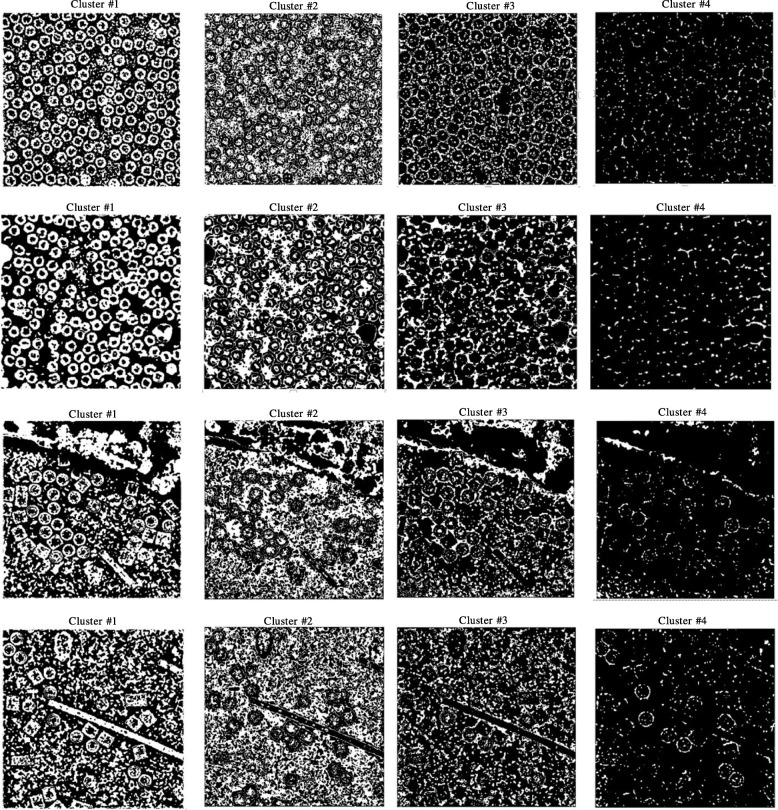
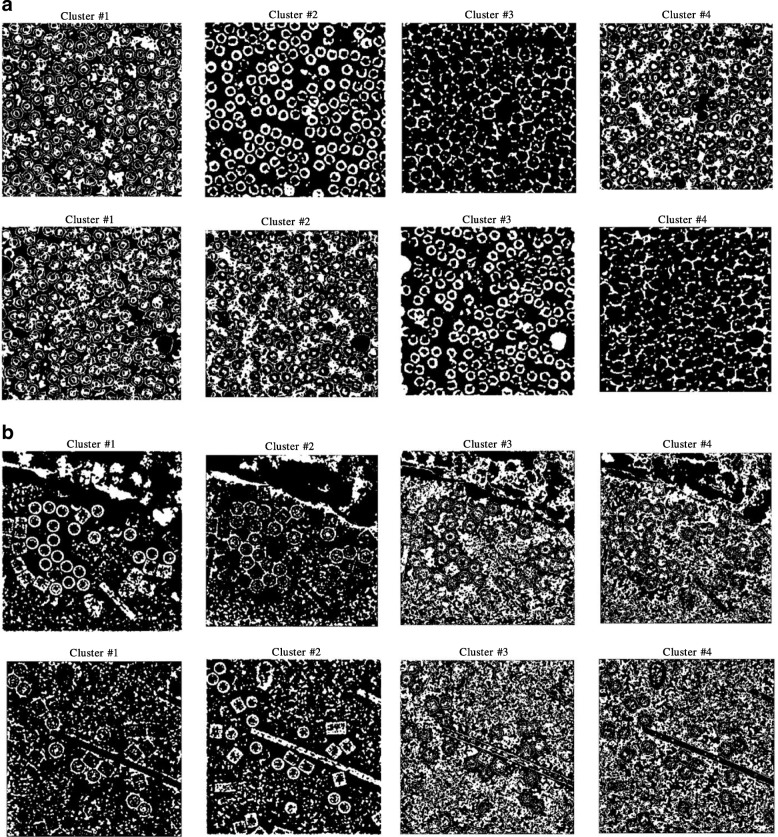
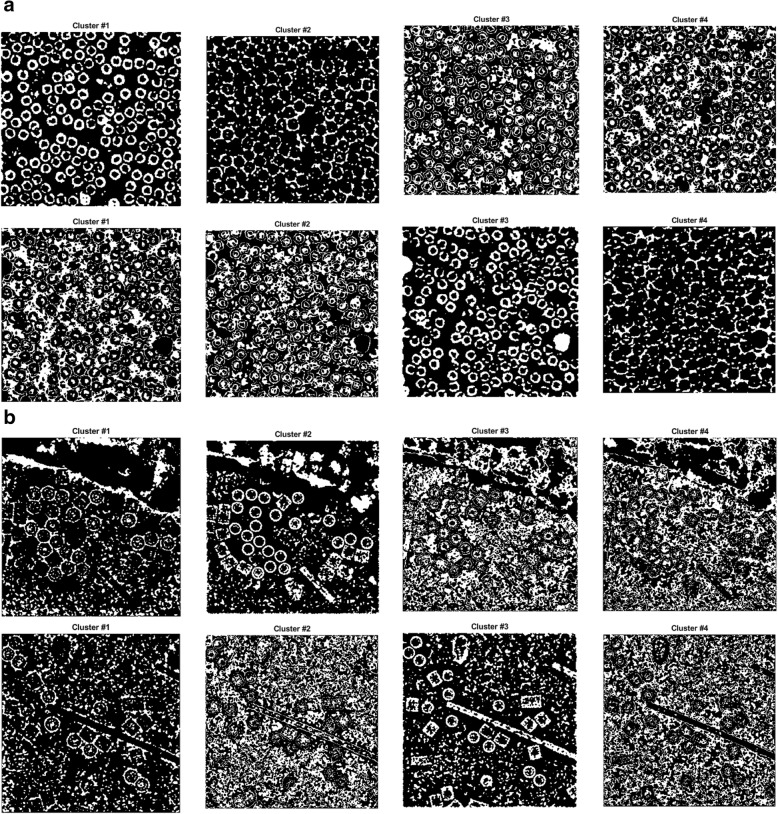
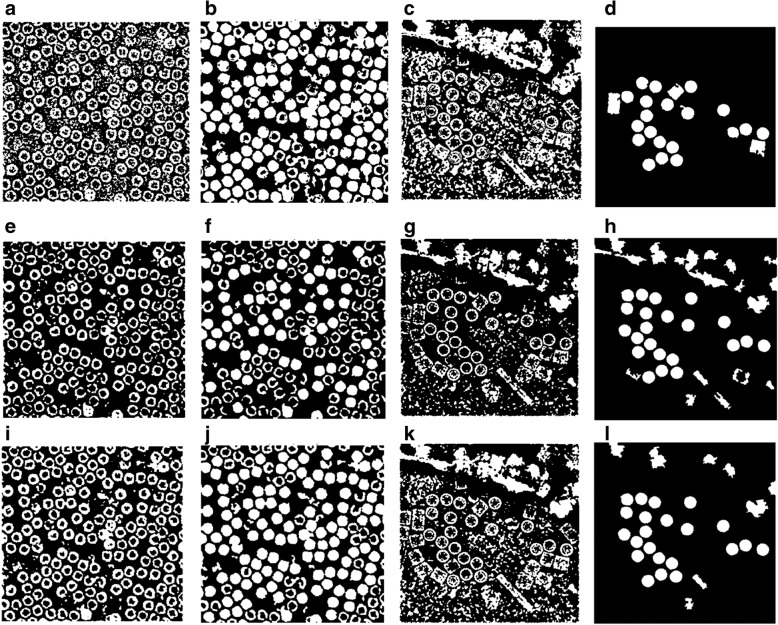
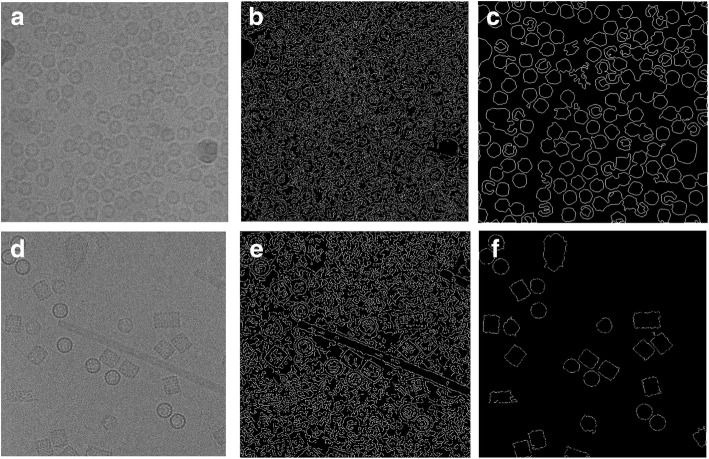
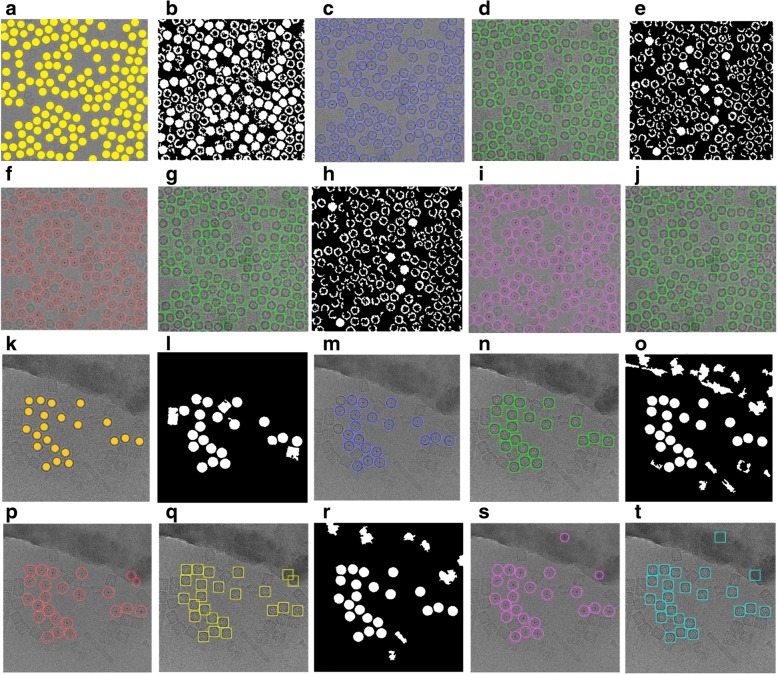
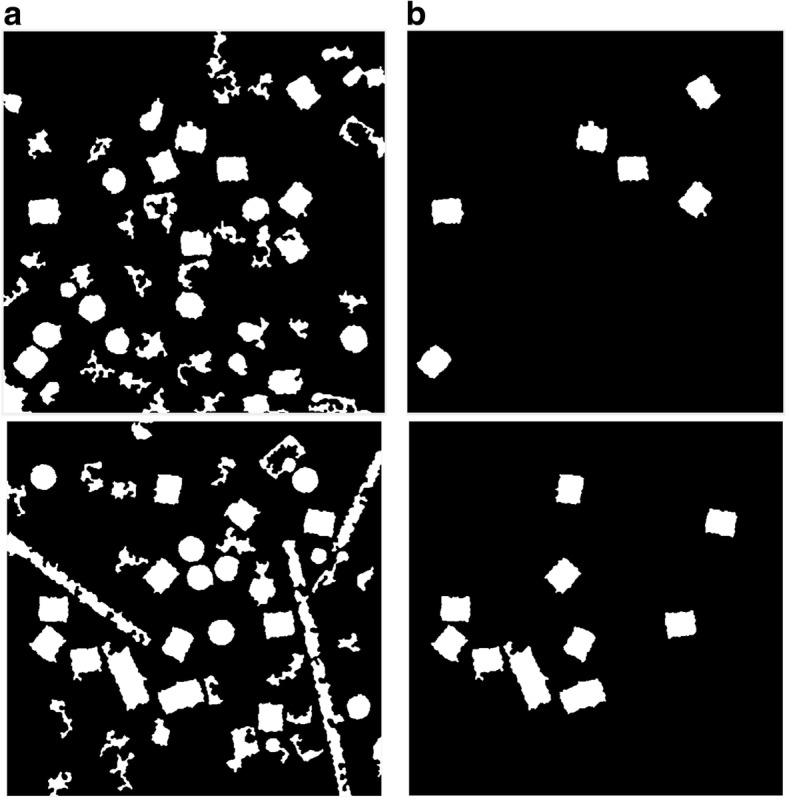
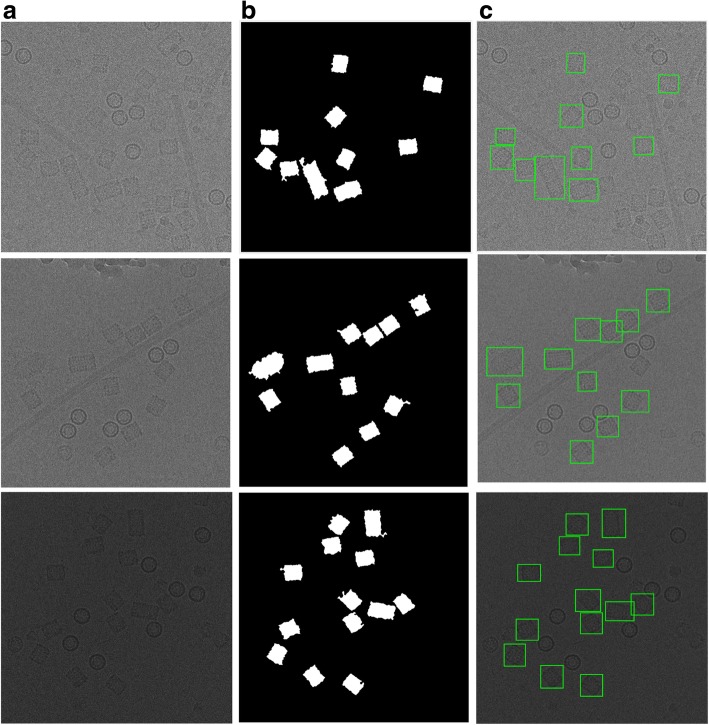
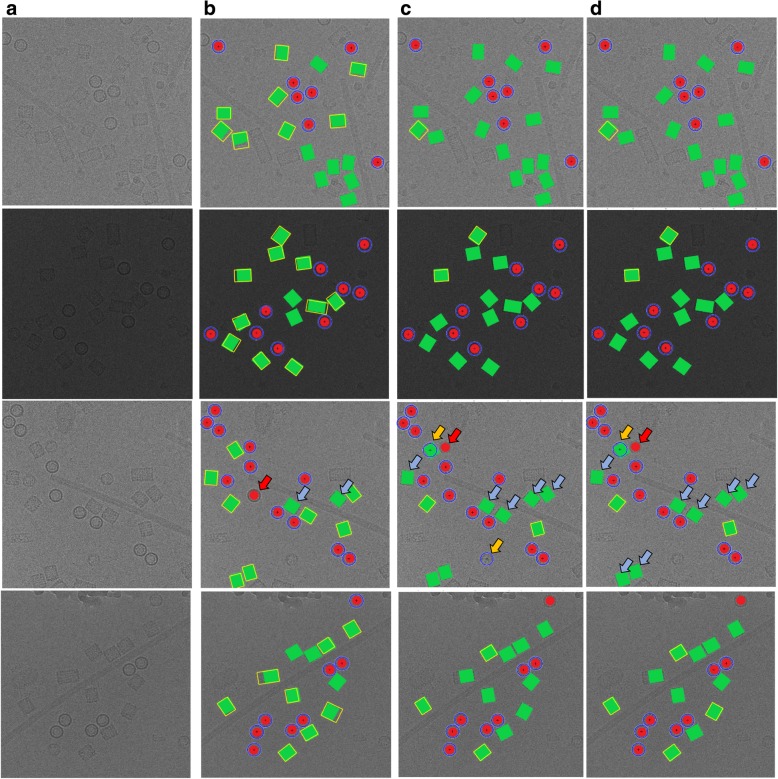
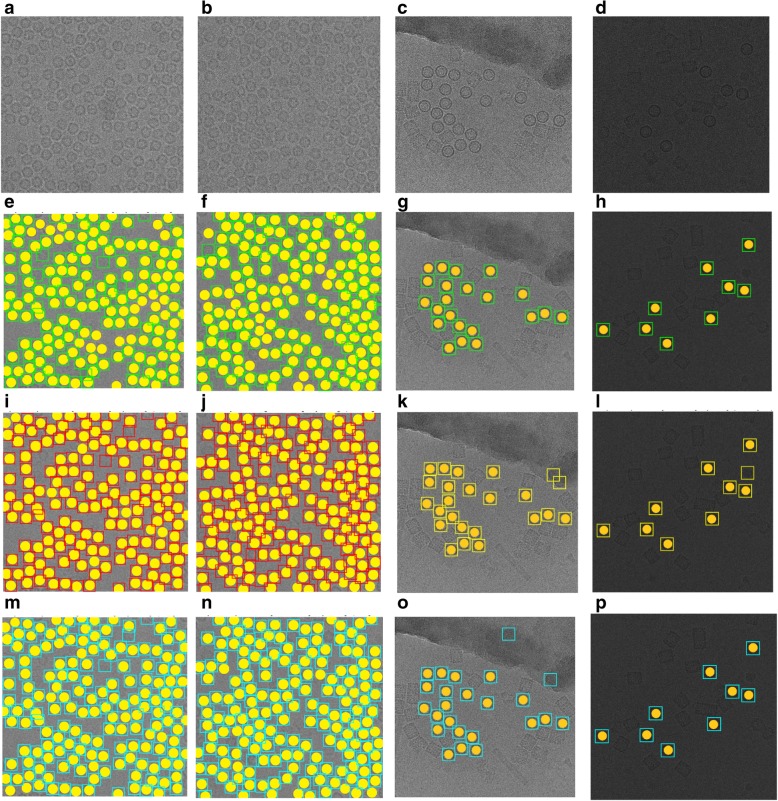
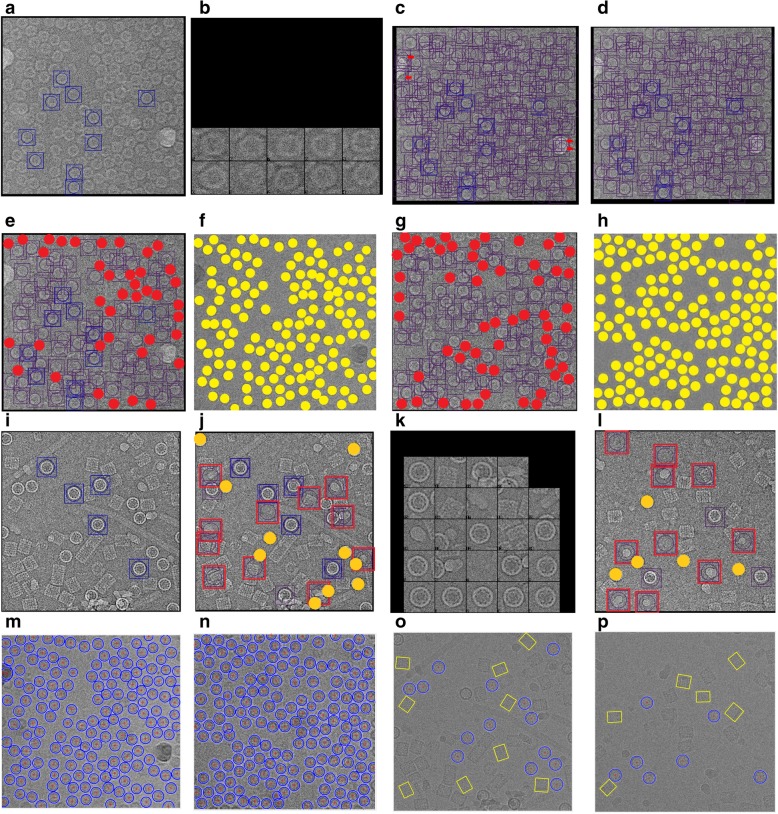
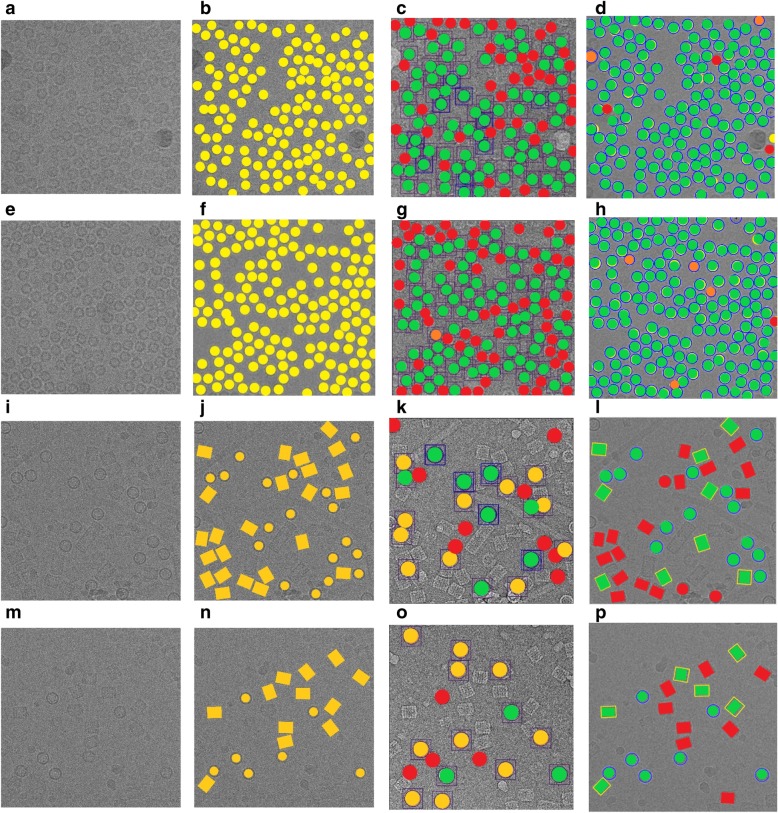
Results: We design a fully automated, unsupervised approach for single particle picking in cryo-EM micrographs. Our approach consists of three stages: image preprocessing, particle clustering, and particle picking. The image preprocessing is based on multiple techniques including: image averaging, normalization, cryo-EM image contrast enhancement correction (CEC), histogram equalization, restoration, adaptive histogram equalization, guided image filtering, and morphological operations. Image preprocessing significantly improves the quality of original cryo-EM images. Our particle clustering method is based on an intensity distribution model which is much faster and more accurate than traditional K-means and Fuzzy C-Means (FCM) algorithms for single particle clustering. Our particle picking method, based on image cleaning and shape detection with a modified Circular Hough Transform algorithm, effectively detects the shape and the center of each particle and creates a bounding box encapsulating the particles.

Conclusions: AutoCryoPicker can automatically and effectively recognize particle-like objects from noisy cryo-EM micrographs without the need of labeled training data or human intervention making it a useful tool for cryo-EM protein structure determination.

Keywords: Clustering; Cryo-EM; Intensity based clustering (IBC); Micrograph; Protein structure determination; Single particle picking.


Conflict of interest statement

The authors declare they have no conflict of interest.

Figures

Fig. 1
Fig. 1
The general framework of AutoCryoPicker: Fully Automated Single Particle Picking. The dashed boxes represent three stages of the approach: pre-processing, particle clustering, and particle detection and picking. A solid box denotes an analysis step
Fig. 2
Fig. 2
Cryo-EM image averaging and normalization result using EMAN2. a The original cryo-EM image (stack of 50 frame) in the MRC format before the averaging and normalization processing. b The cryo-EM image in PNG file format (single frame) after the averaging and normalization processing using EMAN2
Fig. 3
Fig. 3
Contrast transfer correction and adjustment process. a Illustration of the cryo-EM image histogram after the averaging and normalization step using EMAN2 and the a two-element vector that consists of the low and the upper intensity limits by default. The values in low_high specify the bottom 2% and the top 2% of all pixel values. b Illustration of the cryo-EM histogram (Histogram shrinking) after automatically detecting and specifying the low and high intensity range (e.g. [0.2–0.8])
Fig. 4
Fig. 4
Cryo-EM Contrast Transfer Correction (CTC) process. a The original cryo-EM image after the applying the averaging and normalization process through the EMAN2 software. b Histogram of the original cryo-EM image. c The cryo-EM image after applying the mid-range stretching based on the low-high intensity range. d Histogram of the image in (c). e The cryo-EM image after applying the contrast enhancement correction (CEC) and image adjustment. f The histogram of the cryo-EM image after applying the contrast enhancement correction (CEC)
Fig. 5
Fig. 5
Illustration of effects of the cryo-EM image analysis on a zoom-in selected particle region using two different examples from two datasets. a An original zoom-in selected particle region in the micrograph image in Apoferritin dataset. b The normalized single particle image region. c The single particle region after applying the contrast enhancement correction (CEC). d The single particle region after applying the histogram equalization. e The single particle region after applying image resonation with Wiener filtering. f The single particle region after applying the contrast-limited adaptive histogram equalization. g The single particle region after applying image guided filtering. h The single particle region after applying morphological image operation. i An original zoom-in selected particle region in a micrograph image in the KLH dataset before the preprocessing steps. j The selected particle region in a micrograph image in the KLH dataset after normalization. k The selected particle region in a micrograph image in the KLH dataset after applying the contrast enhancement correction (CEC). l The selected particle region in a micrograph image in the KLH dataset after applying the histogram equalization. m The selected particle region in a micrograph image in the KLH dataset after applying image resonation with Wiener filtering. n The selected particle region in a micrograph image in the KLH dataset applying the contrast-limited adaptive histogram equalization. o The selected particle region in a micrograph image in the KLH dataset after applying image guided filtering. p The selected particle region in a micrograph image in the KLH dataset after applying morphological image operation
Fig. 6
Fig. 6
Different cryo-EM image clustering results using an Intensity-Based Clustering Algorithm (ICB). a Two sets of cryo-EM image clustering results (Cluster #1, Cluster #2, Cluster #3 and Cluster #4) on the Apoferritin dataset. Most real particles were always assigned to Cluster 1. b Two sets of cryo-EM image clustering results (Cluster #1, Cluster #2, Cluster #3 and Cluster #4) on the KLH dataset. Most real particles were always assigned to Cluster 1
Fig. 7
Fig. 7
Different cryo-EM image clustering results using the k-means clustering algorithm. a The two sets of cryo-EM images clusters results (Cluster #1, Cluster #2, Cluster #3 and Cluster #4) on the Apoferritin dataset. Most real particles were assigned to Cluster 2 and Cluster 3, respectively. b The two sets of cryo-EM image clustering results (Cluster #1, Cluster #2, Cluster #3 and Cluster #4) on the KLH dataset. Most real particles were assigned Cluster 1 and Cluster 2, respectively
Fig. 8
Fig. 8
Different cryo-EM image clustering results using the FCM clustering algorithm. a Two sets of cryo-EM images clustering results (Cluster #1, Cluster #2, Cluster #3 and Cluster #4) on Apoferritin dataset. Most real particles were assigned to Cluster 1 and Cluster 3, respectively. b Two sets of cryo-EM image clustering results (Cluster #1, Cluster #2, Cluster #3 and Cluster #4) on the KLH dataset. Most real particles were assigned to Cluster 2 and Cluster 3, respectively
Fig. 9
Fig. 9
Cryo-EM Particle Clustering Results after Binary Image Cleaning and Non-Circular Object Removal. a The particle clustering image before binary image cleaning and non-circular object removal on the results of ICB clustering of a cryo-EM image from Apoferritin dataset. b The particle clustering image after binary image cleaning and non-circular object removal on the results of ICB clustering of a cryo-EM image from Apoferritin dataset. c The particle clustering image before binary image cleaning and non-circular object removal on the results of ICB clustering of a cryo-EM image from KLH dataset. d The particle clustering image after binary image cleaning and non-circular object removal on the results of ICB clustering of a cryo-EM image from KLH dataset. e The particle clustering image before binary image cleaning and non-circular object removal on the results of k-means clustering of a cryo-EM image from Apoferritin dataset. f The particle clustering image after binary image cleaning and non-circular object removal on the results of k-means clustering of a cryo-EM image from Apoferritin dataset. g The particle clustering image before binary image cleaning and non-circular object removal on the results of k-means clustering of a cryo-EM image from KLH dataset. h The particle clustering image after binary image cleaning and non-circular object removal on the results of k-means clustering of a cryo-EM image from KLH dataset. i The particles clustering image before binary image cleaning and non-circular object removal on the results of FCM clustering of a cryo-EM image from Apoferritin dataset. j The particle clustering image after binary image cleaning and non-circular object removal on the results of FCM clustering of a cryo-EM image from Apoferritin dataset. (k) The particle clustering image before binary image cleaning and non-circular object removal on the results of FCM clustering of a cryo-EM image from KLH dataset. l The particle clustering image after binary image cleaning and non-circular object removal on the results of FCM clustering of a cryo-EM image from KLH dataset
Fig. 10
Fig. 10
Modified Circular Hough Transformation (CHT). a Original cryo-EM image from the KLH dataset. b Edge detection result that will be used later for CHT to detect the center of each circular object in the binary cryo-EM image from the Apoferritin dataset based on using canny edge detection. c Edge detection results that will be used later for CHT to detect the center of each circular object in the binary cryo-EM image from the Apoferritin dataset based on using the modified CHT based IBC clustering and boundary pixels list extraction (outline’s boundary pixel). d Edge detection result that will be used later for CHT to detect the center of each circular object in the binary cryo-EM image from the KLH dataset based on using canny edge detection. e Edge detection results that will be used later for CHT to detect the center of each circular object in the binary cryo-EM image from the KLH dataset based on using the modified CHT based IBC clustering and boundary pixels list extraction (outline’s boundary pixel)
Fig. 11
Fig. 11
Top View (Circular) Particles Detection and Picking Results using Modified Circular Hough Transform (CHT). a The Ground truth (particles manually labelled) for the cryo-EM image from the Apoferritin dataset. b ICB clustering results after the binary image cleaning and non-circular objects removal (Apoferritin dataset). c The center of each particle illustrated by the ‘+’ sign and the radius of each particle by the blue circle around each particle (ICB and Apoferritin dataset). d The bounding box for each particle object in the original cryo-EM image (ICB and Apoferritin dataset). e K-means clustering results after the binary image cleaning and non-circular objects removal (Apoferritin dataset). f The center of each particle illustrated by using the ‘+’ sign and the radius of each particle by the blue circle around each particle (k-means results on Apoferritin dataset). g The bounding box for each particle (k-means results and Apoferritin dataset). h FCM clustering results after the binary image cleaning and non-circular objects removal (Apoferritin dataset). i The center of each particle illustrated by the ‘+’ sign and the radius of each particle by the blue circle around each particle (FCM and Apoferritin dataset). j The bounding box for each particle in the original cryo-EM image (FCM results and Apoferritin dataset). k The ground truth (particles manually labeled) for the cryo-EM image from the KLH dataset. l ICB clustering results after the binary image cleaning and non-circular objects removal (KLH dataset). m The center of each particle illustrated by the ‘+’ sign and the radius of each particle by the blue circle (ICB and KLH dataset). n The bounding box for each particle in the original cryo-EM image (ICB and KLH dataset). o K-means clustering results after the binary image cleaning and non-circular objects removal (KLH dataset). p Shows the center of each particle illustrated by the ‘+’ sign and the radius of each particle by the blue circle (k-means and KLH dataset). q The bounding box for each particle in the original cryo-EM image (k-means and KLH dataset). r FCM clustering results after the binary image cleaning and non-circular objects removal (KLH dataset). s The center of each particle illustrated by the ‘+’ sign and the radius of each particle by the blue circle (FCM and KLH dataset). t The bounding box for each particle in the original cryo-EM image (FCM and KLH dataset)
Fig. 12
Fig. 12
Cryo-EM clean clustered images after the circular and non-square object removal. a The cryo-EM clustered images after image cleaning and small objects removal. b The same cryo-EM clustered images after the circular and non-square object removal
Fig. 13
Fig. 13
Side view (square) particles detection and picking results. a The original cryo-EM image (KLH dataset). b The result after circular and non-square object removal based on the ICB clustering algorithm. c Side view (square) particle detection results
Fig. 14
Fig. 14
Perfect square (side view) particle shape detection using the Feret object diameter using (KLH dataset). a Square particle image after shapes smoothing and blurring. b Boundary boxes (each particle) based on Feret object diameter measurement. c Perfect square particle shapes that are generated based on the new boundary box dimension using Feret object diameter measurement. d Square particle image after the outlier objects are eliminated. e Square particle detection results (side view) based on the new Feret boundary box dimension. f The final results of two different particle shape detection and picking (top and side view) based on ICB clustering and modified CHT; and perfect square (side view) particle shapes detection using Feret object diameter
Fig. 15
Fig. 15
Automated particle picking results for both cases (top and side view) on KLH dataset. a The original cryo-EM images form the KLH dataset. b Target detection and picking results (top and side particles view) using the ICB clustering algorithm. c Target detection and picking results (top and side particles view) using the k-means clustering algorithm. d Target detection and picking results (top and side particles view) using the FCM clustering algorithm
Fig. 16
Fig. 16
Automated particle picking results on the two datasets. a A cryo-EM image with a high identical particle density and a lack low-frequency from the Apoferritin dataset. b A low SNR cryo-EM image from the Apoferritin dataset. c A micrograph image from the KLH dataset that includes excessively overlapped particles due to confounding artifacts such as ice contamination, degraded particles, and particle aggregates. d A micrograph image from the KLH dataset that has a very low spatial density and different intensity levels. e and (f) Particle picking results using Intensity Based Clustering Algorithm (ICB) (Apoferritin dataset). i and (j) Particle picking results using k-means (Apoferritin dataset). m and (n) Particle picking results using FCM (Apoferritin dataset). g and (h) Particle picking results using Intensity Based Clustering Algorithm (ICB) (KLH dataset). k and (l) Particle picking results using k-means (KLH dataset). o and (p) Particle picking results using FCM (KLH dataset)
Fig. 17
Fig. 17
Particle picking using EMAN2 and AutoCryoPicker. a The manually selected reference particles of the Apoferritin dataset that were used for automated particle picking with EMAN2. b Zoomed-in view of the reference particles for the Apoferritin dataset. c EMAN2 automatic picking result based on threshold value = 0.0 using the first tested image of the Apoferritin dataset. d EMAN2 automatic picking result based on threshold value = 0.5 using the first tested image of the Apoferritin dataset. e EMAN2 automatic picking result based the threshold value = 2.3 using the first tested image of the Apoferritin dataset. Red dots mark missed particles). f Ground truth of first tested image of the Apoferritin dataset. Yellow dots mark valid particles. g EMAN2 automatic picking result based the threshold value = 2.3 using the second tested image of the Apoferritin dataset. Red dots mark missed particles). h Ground truth of second tested image of the Apoferritin dataset. Yellow dots mark valid particles. i The manually selected reference particles of the KLH dataset that were used for automated picking of top-view (circular) particles with EMAN2. j EMAN2 automatic picking result based the threshold value = 0.5 using the first tested image of the KLH dataset. Red squares mark the false positives and the yellow dots the missing particles. k Zoomed-in view of the automatically picked particles (threshold value = 0.5) for first tested image of the KLH dataset. l EMAN2 automatic picking result based the threshold value = 0.5 using the second tested image of the KLH dataset. Red squares mark the false positives, and the yellow dots mark the missing particles (top-view). m Particle picking result from AutoCryoPicker using the first tested image of the Apoferritin dataset. Red ‘+’ mark the center of each particle and blue circles the top-view detected particles in the cryo-EM image. n Particle picking result from AutoCryoPicker using the second tested image of the Apoferritin dataset. Red ‘+’ mark the center of each particle and blue circles the top-view detected particles in the cryo-EM image. o Particle picking result from AutoCryoPicker using the first tested image of the KLH dataset. Red ‘+’ marks the center of each particle, blue circles the top-view detected particles in the cryo-EM image, and the yellow squares the side-view detected particles in the cryo-EM image. p Particle picking result from AutoCryoPicker using the second tested image from the KLH dataset. Red ‘+’ marks the center of each particle, blue circles the top-view detected particles in the cryo-EM image, and the yellow squares the side-view detected particles in the cryo-EM image
Fig. 18
Fig. 18
Evaluation of particle picking using EMAN2 and AutoCryoPicker. a Apoferritin cryo-EM image with top-view particle shapes only. b The ground truth (manually particle picking labels) of the first Apoferritin cryo-EM image where each particle is marked by a yellow circle on top of each particle. c The particle picking results of the first Apoferritin image using EMAN2. The particles are labeled as follows: Green, True Positive (TP); red, False Negative (FN). d The particle picking results of the first Apoferritin cryo-EM image using AutoCryoPicker. The particles are labeled as follows: Green, True Positive (TP); red, False Negative (FN); orange, False Positive (FP). e The second original Apoferritin cryo-EM image with top-view particle shapes only. f The ground truth (manually particle picking labels) of the second Apoferritin cryo-EM image where each particle is marked by a yellow circle on top of each particle. g The particle picking results of the second Apoferritin cryo-EM image using EMAN2. The particles are labeled as follows: Green, True Positive (TP); red, False Negative (FN); orange, False Positive (FP). h The particle picking results of the second Apoferritin cryo-EM image using AutoCryoPicker. The particles are labeled as follows: Green, True Positive (TP); red, False Negative (FN); orange, False Positive (FP). i The first original KLH cryo-EM image. (j) The ground truth (manually particle picking labels) of the first KLH cryo-EM image where each particle is marked by a yellow circle on top of each particle. k The particle picking results of the first KLH image using EMAN2. The particles are labeled as follows: Green, True Positive (TP); red, False Negative (FN). l The particle picking results of the first KLH cryo-EM image using AutoCryoPicker. The particles are labeled as follows: Green, True Positive (TP); red, False Negative (FN). m The second original KLH cryo-EM image which has top-view particle shapes only. n The ground truth (manually particle picking labels) of the second KLH cryo-EM image where each particle is marked by a yellow circle on top of each particle. o The particle picking results of the second KLH cryo-EM image using EMAN2. The particles are labeled as follows: Green, True Positive (TP); red, False Negative (FN). p The particle picking results of the second KLH cryo-EM image using AutoCryoPicker. The particles are labeled as follows: Green, True Positive (TP); red, False Negative (FN)

Similar articles

Cited by

References

    1. Nogales E, Scheres SH. Cryo-EM: a unique tool for the visualization of macromolecular complexity. Mol Cell. 2015;58(4):677–689. doi: 10.1016/j.molcel.2015.02.019. - DOI - PMC - PubMed
    1. Merk A, Bartesaghi A, Banerjee S, Falconieri V, Rao P, Davis MI, Pragani R, Boxer MB, Earl LA, Milne JLS, Subramaniam S. Breaking Cryo-EM resolution barriers to facilitate drug discovery. Cell. 2016;165(7):1698–1707. doi: 10.1016/j.cell.2016.05.040. - DOI - PMC - PubMed
    1. Doerr, Allison. 2016. “Single-particle cryo-electron microscopy.” Nat Methods 23. https://www.nature.com/articles/nmeth.3700?draft=collection. - PubMed
    1. Jiang J, Pentelute BL, Collier RJ, Zhou ZH. Atomic structure of anthrax protective antigen pore elucidates toxin translocation. Nature. 2015;521(7553):545–549. doi: 10.1038/nature14247. - DOI - PMC - PubMed
    1. Bartesaghi A, Merk A, Banerjee S, Matthies D, Wu X, Milne JL, Subramaniam S. 2.2 a resolution cryo-EM structure of beta-galactosidase in complex with a cell-permeant inhibitor. Science. 2015;348(6239):1147–1151. doi: 10.1126/science.aab1576. - DOI - PMC - PubMed

LinkOut - more resources