

fastJT: An R package for robust and efficient feature selection for machine learning and genome-wide association studies
- PMID: 31195980
- PMCID: PMC6567636
- DOI: 10.1186/s12859-019-2869-3
fastJT: An R package for robust and efficient feature selection for machine learning and genome-wide association studies
Abstract
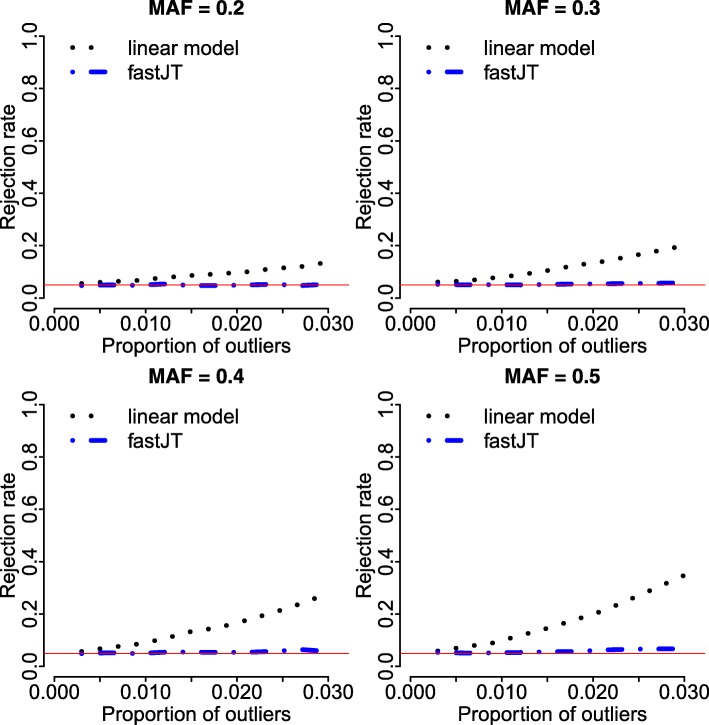
Background: Parametric feature selection methods for machine learning and association studies based on genetic data are not robust with respect to outliers or influential observations. While rank-based, distribution-free statistics offer a robust alternative to parametric methods, their practical utility can be limited, as they demand significant computational resources when analyzing high-dimensional data. For genetic studies that seek to identify variants, the hypothesis is constrained, since it is typically assumed that the effect of the genotype on the phenotype is monotone (e.g., an additive genetic effect). Similarly, predictors for machine learning applications may have natural ordering constraints. Cross-validation for feature selection in these high-dimensional contexts necessitates highly efficient computational algorithms for the robust evaluation of many features.
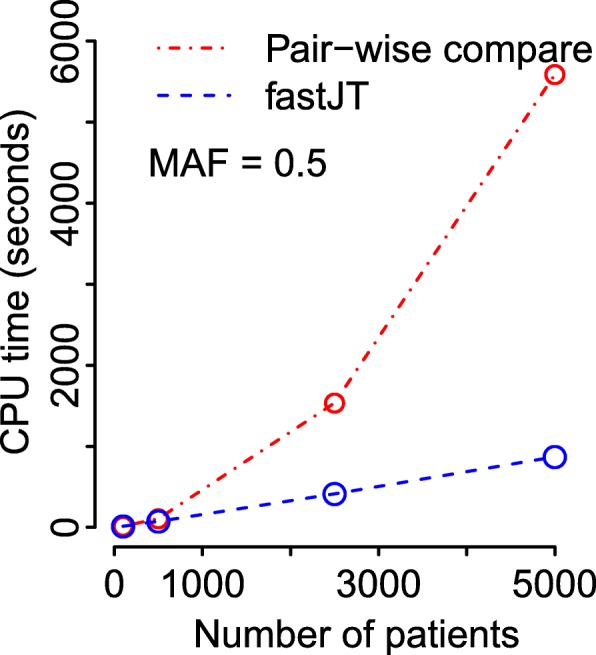
Results: We have developed an R extension package, fastJT, for conducting genome-wide association studies and feature selection for machine learning using the Jonckheere-Terpstra statistic for constrained hypotheses. The kernel of the package features an efficient algorithm for calculating the statistics, replacing the pairwise comparison and counting processes with a data sorting and searching procedure, reducing computational complexity from O(n2) to O(n log(n)). The computational efficiency is demonstrated through extensive benchmarking, and example applications to real data are presented.
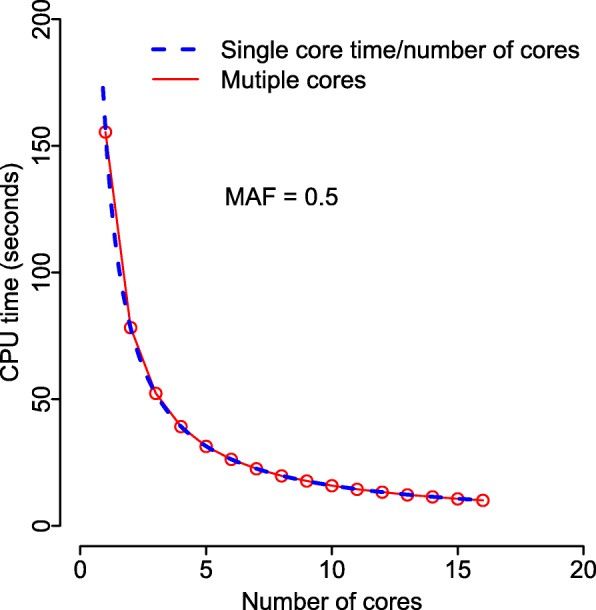
Conclusions: fastJT is an open-source R extension package, applying the Jonckheere-Terpstra statistic for robust feature selection for machine learning and association studies. The package implements an efficient algorithm which leverages internal information among the samples to avoid unnecessary computations, and incorporates shared-memory parallel programming to further boost performance on multi-core machines.
Keywords: Constrained inference; Feature selection; Genome-wide association studies; Jonckheere-Terpstra; Linear rank statistic; Logarithmic complexity; Machine learning; Parallel processing; Robust statistic.
Conflict of interest statement
The authors declare that they have no competing interests.
Figures


Similar articles
-
A machine learning-based framework to identify type 2 diabetes through electronic health records.Int J Med Inform. 2017 Jan;97:120-127. doi: 10.1016/j.ijmedinf.2016.09.014. Epub 2016 Oct 1. Int J Med Inform. 2017. PMID: 27919371 Free PMC article.
-
Pipeline design to identify key features and classify the chemotherapy response on lung cancer patients using large-scale genetic data.BMC Syst Biol. 2018 Nov 20;12(Suppl 5):97. doi: 10.1186/s12918-018-0615-5. BMC Syst Biol. 2018. PMID: 30458782 Free PMC article.
-
Enhancing prediction accuracy of coronary artery disease through machine learning-driven genomic variant selection.J Transl Med. 2024 Apr 16;22(1):356. doi: 10.1186/s12967-024-05090-1. J Transl Med. 2024. PMID: 38627847 Free PMC article.
-
Brief Survey on Machine Learning in Epistasis.Methods Mol Biol. 2021;2212:169-179. doi: 10.1007/978-1-0716-0947-7_11. Methods Mol Biol. 2021. PMID: 33733356 Review.
-
Genome-Wide Association Study Statistical Models: A Review.Methods Mol Biol. 2022;2481:43-62. doi: 10.1007/978-1-0716-2237-7_4. Methods Mol Biol. 2022. PMID: 35641758 Review.
Cited by
-
Common variation in a long non-coding RNA gene modulates variation of circulating TGF-β2 levels in metastatic colorectal cancer patients (Alliance).BMC Genomics. 2024 May 14;25(1):473. doi: 10.1186/s12864-024-10354-7. BMC Genomics. 2024. PMID: 38745123 Free PMC article.
References
-
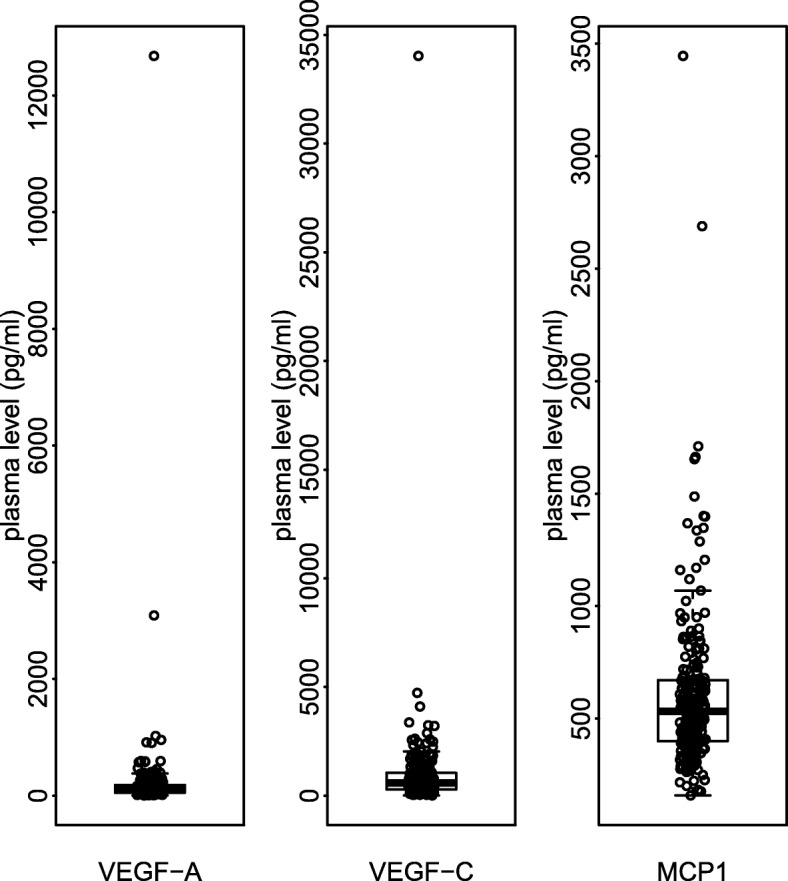
- Innocenti F, Jiang C, Sibley AB, Etheridge AS, Hatch AJ, Denning S, Niedzwiecki D, Shterev ID, Lin J, Furukawa Y, Kubo M, Kindler HL, Auman JT, Venook AP, Hurwitz HI, McLeod HL, Ratain MJ, Gordan R, Nixon AB, Owzar K. Genetic variation determines VEGF-A plasma levels in cancer patients. Sci Rep. 2018;8:16332. doi: 10.1038/s41598-018-34506-4. - DOI - PMC - PubMed
-
- Mann HB, Whitney DR. On a test of whether one of two random variables is stochastically larger than the other. Ann Math Stat. 1947;18:50. doi: 10.1214/aoms/1177730491. - DOI
MeSH terms
Substances
Grants and funding
LinkOut - more resources
Full Text Sources
Molecular Biology Databases
