. 2019 Jun 13;20(1):325.
doi: 10.1186/s12859-019-2922-2.

A dropout-regularized classifier development approach optimized for precision medicine test discovery from omics data

Affiliations

A dropout-regularized classifier development approach optimized for precision medicine test discovery from omics data

Joanna Roder et al. BMC Bioinformatics. .

Abstract

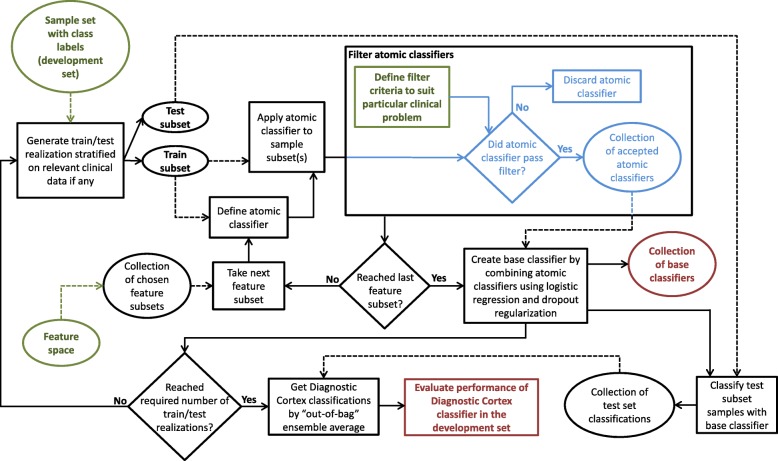
Background: Modern genomic and proteomic profiling methods produce large amounts of data from tissue and blood-based samples that are of potential utility for improving patient care. However, the design of precision medicine tests for unmet clinical needs from this information in the small cohorts available for test discovery remains a challenging task. Obtaining reliable performance assessments at the earliest stages of test development can also be problematic. We describe a novel approach to classifier development designed to create clinically useful tests together with reliable estimates of their performance. The method incorporates elements of traditional and modern machine learning to facilitate the use of cohorts where the number of samples is less than the number of measured patient attributes. It is based on a hierarchy of classification and information abstraction and combines boosting, bagging, and strong dropout regularization.

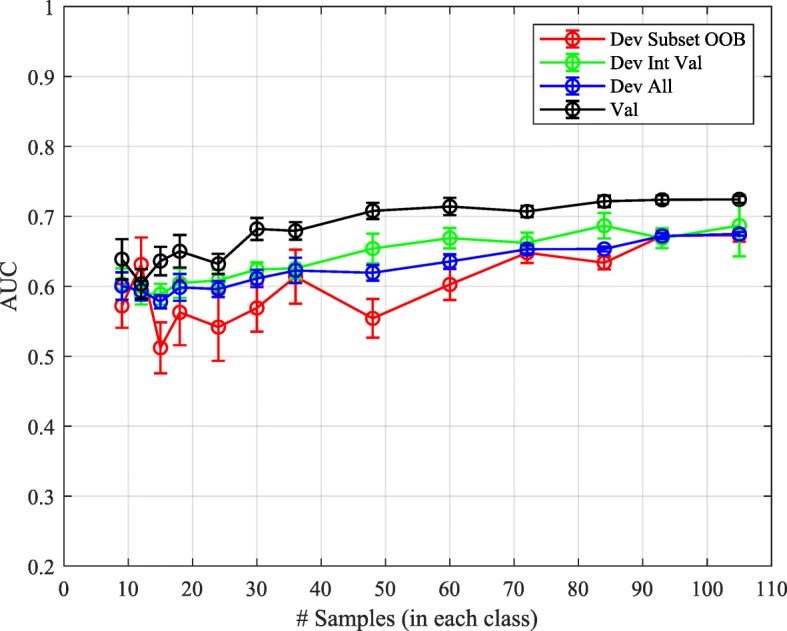
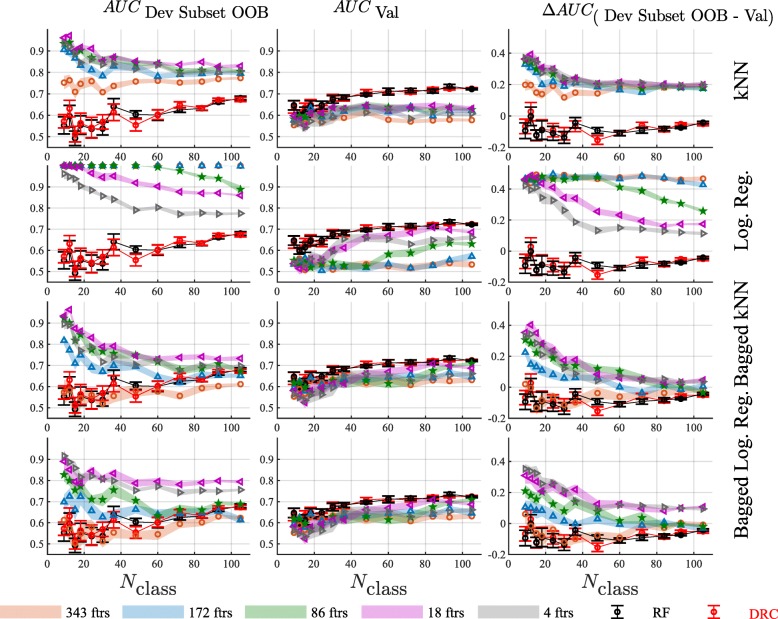
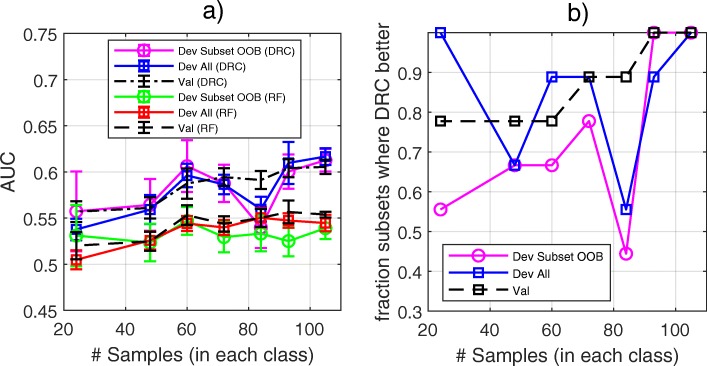
Results: We apply this dropout-regularized combination approach to two clinical problems in oncology using mRNA expression and associated clinical data and compare performance with other methods of classifier generation, including Random Forest. Performance of the new method is similar to or better than the Random Forest in the two classification tasks used for comparison. The dropout-regularized combination method also generates an effective classifier in a classification task with a known confounding variable. Most importantly, it provides a reliable estimate of test performance from a relatively small development set of samples.

Conclusions: The flexible dropout-regularized combination approach is able to produce tests tailored to particular clinical questions and mitigate known confounding effects. It allows the design of molecular diagnostic tests addressing particular clinical questions together with reliable assessment of whether test performance is likely to be fit-for-purpose in independent validation at the earliest stages of development.

Keywords: Boosting; Ensemble average; Machine Learning; Molecular diagnostics; Regularization.


Conflict of interest statement

JR and HR are inventors on a patent describing the DRC classifier development approach assigned to Biodesix, Inc. All authors are current or former employees of and have or had stock options in Biodesix, Inc.

Figures

Fig. 1
Fig. 1
Classifier development architecture for dropout-regularized combination approach
Fig. 2
Fig. 2
AUC averaged over 9 development subset realizations for DRC classifiers developed for subsets of size 210, 186, 168, 144, 120, 86, 72, 60, 48, 36, 30, 24, and 18 evaluated for the development subset by out-of-bag estimate (Dev Subset OOB), for development set samples not used for training (Dev Int Val), for all development set samples (Dev All), and for the independent validation set (Val)
Fig. 3
Fig. 3
Results are shown for a single kNN classifier (1st row), a single logistic regression classifier (2nd row), bagged kNN classifiers (3rd row), and bagged logistic regression classifiers (4th row) as a function of the development subset size, for all 343 features, and 172, 86, 18, and 4 features, as selected by t-test p-value on the development subset. Left panels show average AUC on the development subset, center panels show average AUC on the validation set and right panels show the difference in AUC between the development subset and the validation set. Results for classifiers made with DRC and RF are also shown in each figure for comparison. Development subset AUCs are assessed within subset by out-of-bag estimates. Error bars show the standard error of the averages for DRC and RF and the colored bands show the standard error of the averages for the alternative classification methods
Fig. 4
Fig. 4
a AUC averaged over development subset realizations as assessed for the development set via within subset out-of-bag estimates (Dev Subset OOB) and for the independent validation set (Val). Error bars show standard error. b Proportion of development subset realizations with larger AUC for DRC than for RF as a function of development subset size for out-of-bag assessment within development subset (Dev Subset OOB), whole development set (OOB for samples used in training) and for the independent validation set (Val)
Fig. 5
Fig. 5
Results are shown for the classifier trained on the problem confounded by tumor histology for differentiation of subjects with NSCLC surviving at least four years post-surgery from those dying before four years. The ROC curves correspond to the case when no additional filtering constraint is applied using data from patients with non-squamous histology with insufficient follow up
Fig. 6
Fig. 6
Performance for differentiation of subjects with NSCLC surviving at least four years post-surgery from those dying before four years is shown as a function of the lower accuracy limit of the additional filtering constraint applied using patients with non-squamous histology with insufficient follow up. First panel: AUC for the development subset and validation set; second panel: difference in AUC between development subset and validation set; third panel: fraction of the 9 subjects with insufficient follow up set aside for testing classified as Alive. The upper accuracy limit of the additional filtering constraint was set to 1.0 in all cases

References

    1. Poste G, Compton CC, Barker AD. The national biomarker development alliance: confronting the poor productivity of biomarker research and development. Expert Rev Mol Diagn. 2015;15(2):211–218. doi: 10.1586/14737159.2015.974561. - DOI - PubMed
    1. Larkin JE, Frank BC, Gavras H, Sultana R, Quackenbush J. Independence and reproducibility across microarray platforms. Nat Methods. 2005;2(5):337–344. doi: 10.1038/nmeth757. - DOI - PubMed
    1. Kelly AD, Hill KE, Correll M, Hu L, Wang YE, Rubio R, Duan S, Quackenbush J, Spentzos D. Next-generation sequencing and microarray-based interrogation of microRNAs from formalin-fixed, paraffin-embedded tissue: preliminary assessment of cross-platform concordance. Genomics. 2013;102(1):8–14. doi: 10.1016/j.ygeno.2013.03.008. - DOI - PMC - PubMed
    1. Tabb DL, Vega-Montoto L, Rudnick PA, Variyath AM, Ham AJ, Bunk DM, et al. Repeatability and reproducibility in proteomic identifications by liquid chromatography-tandem mass spectrometry. J Proteome Res. 2010;9(2):761–776. doi: 10.1021/pr9006365. - DOI - PMC - PubMed
    1. Simon R. Development and validation of biomarker classifiers for treatment selection. J Stat Plan Inference. 2008;138(2):308–320. doi: 10.1016/j.jspi.2007.06.010. - DOI - PMC - PubMed

LinkOut - more resources