

Clinical expression and antigenic profiles of a Plasmodium vivax vaccine candidate: merozoite surface protein 7 (PvMSP-7)
- PMID: 31196098
- PMCID: PMC6567670
- DOI: 10.1186/s12936-019-2826-7
Clinical expression and antigenic profiles of a Plasmodium vivax vaccine candidate: merozoite surface protein 7 (PvMSP-7)
Abstract
Background: Vivax malaria is the predominant form of malaria outside Africa, affecting about 14 million people worldwide, with about 2.5 billion people exposed. Development of a Plasmodium vivax vaccine is a priority, and merozoite surface protein 7 (MSP-7) has been proposed as a plausible candidate. The P. vivax genome contains 12 MSP-7 genes, which contribute to erythrocyte invasion during blood-stage infection. Previous analysis of MSP-7 sequence diversity suggested that not all paralogs are functionally equivalent. To explore MSP-7 functional diversity, and to identify the best vaccine candidate within the family, MSP-7 expression and antigenicity during bloodstream infections were examined directly from clinical isolates.
Methods: Merozoite surface protein 7 gene expression was profiled using RNA-seq data from blood samples isolated from ten human patients with vivax malaria. Differential expression analysis and co-expression cluster analysis were used to relate PvMSP-7 expression to genetic markers of life cycle stage. Plasma from vivax malaria patients was also assayed using a custom peptide microarray to measure antibody responses against the coding regions of 12 MSP-7 paralogs.
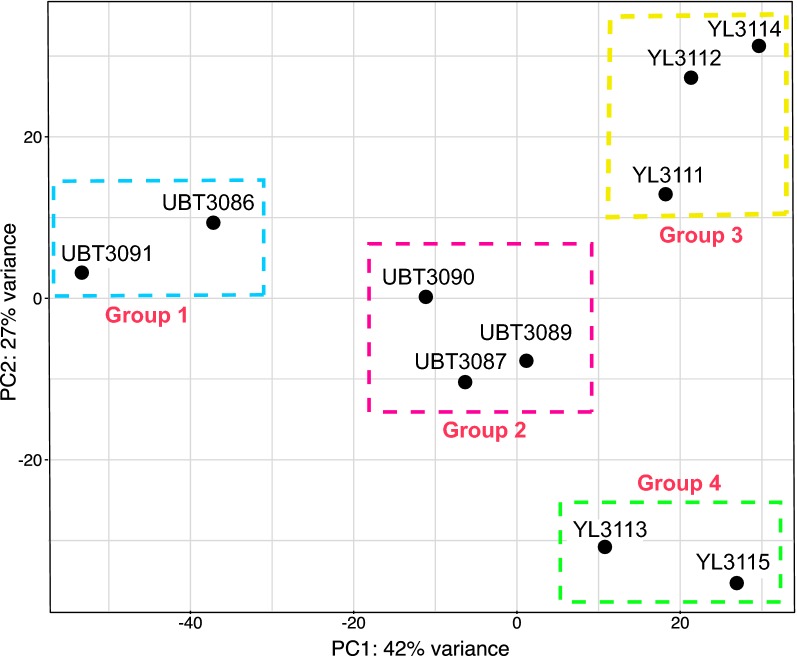
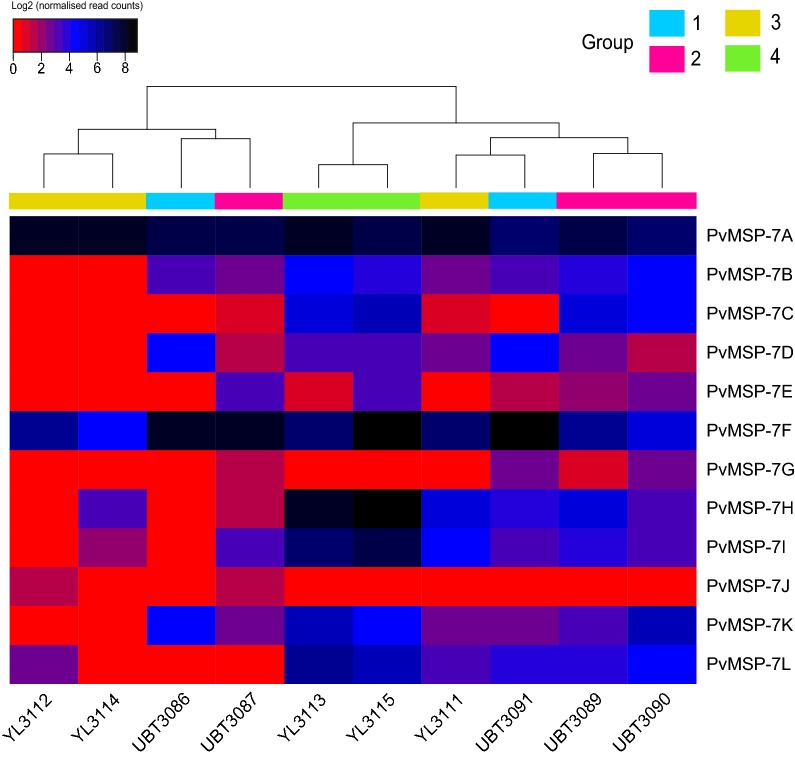
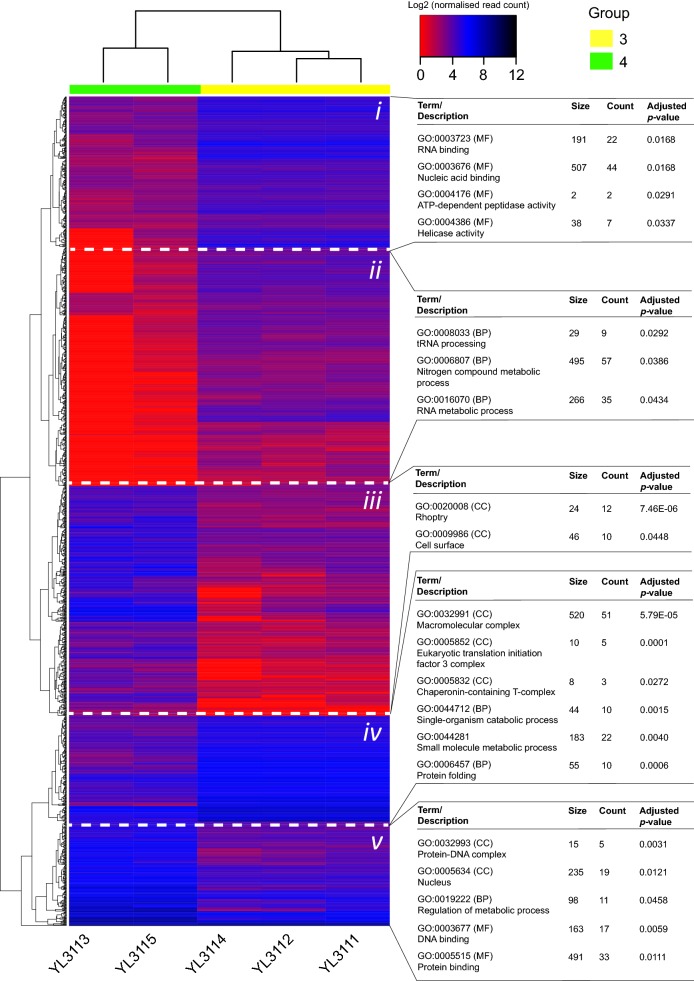
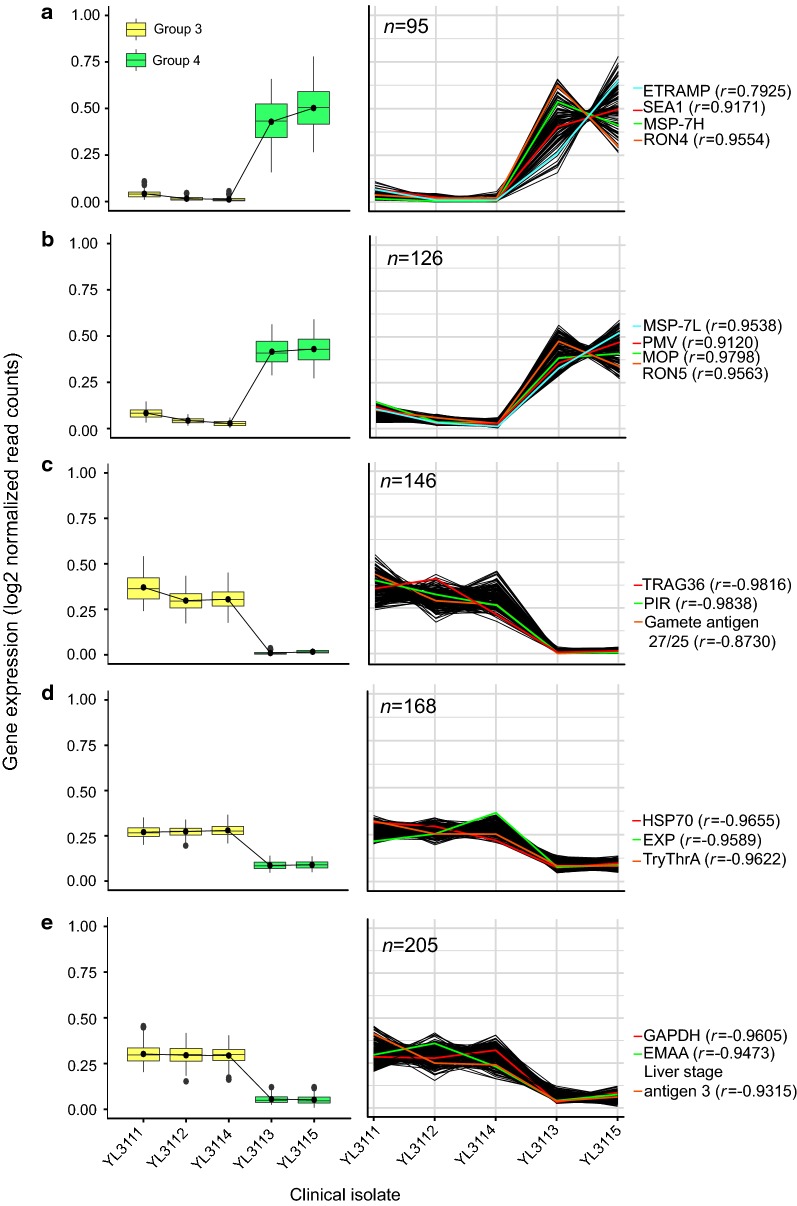
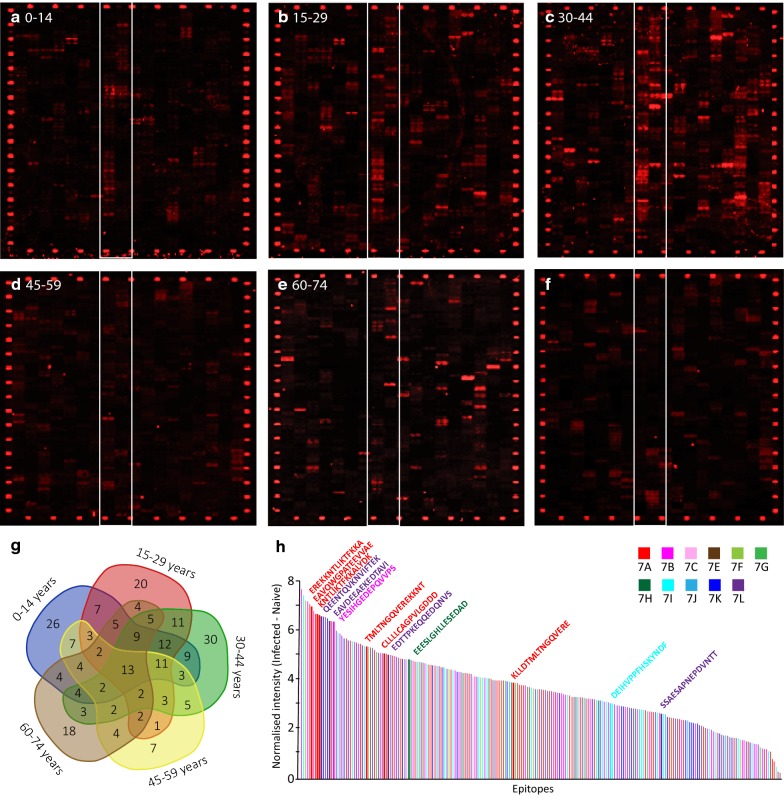
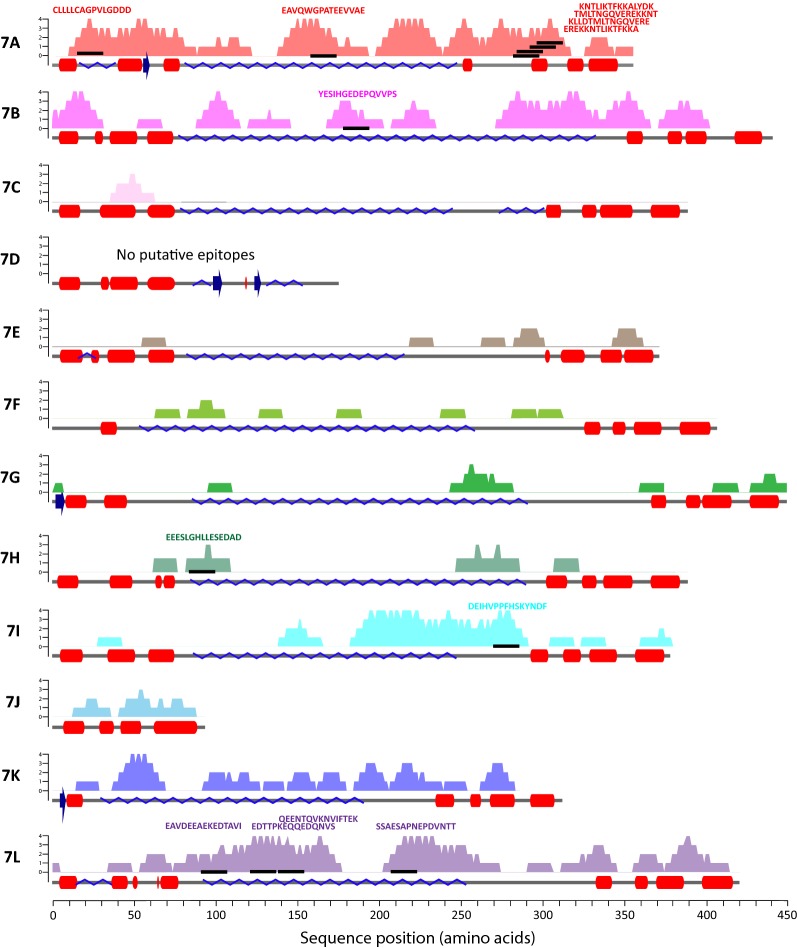
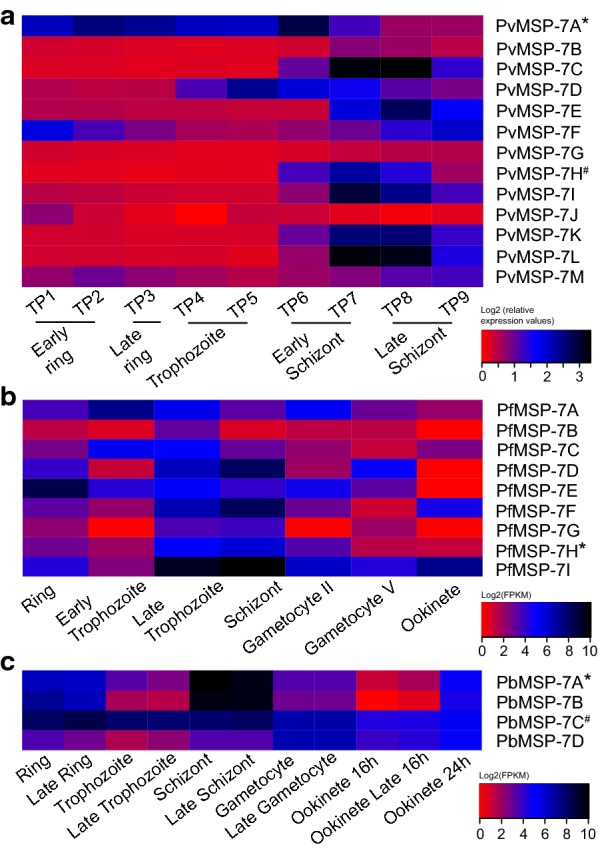
Results: Ten patients presented diverse transcriptional profiles that comprised four patient groups. Two MSP-7 paralogs, 7A and 7F, were expressed abundantly in all patients, while other MSP-7 genes were uniformly rare (e.g. 7J). MSP-7H and 7I were significantly more abundant in patient group 4 only, (two patients having experienced longer patency), and were co-expressed with a schizont-stage marker, while negatively associated with liver-stage and gametocyte-stage markers. Screening infections with a PvMSP-7 peptide array identified 13 linear B-cell epitopes in five MSP-7 paralogs that were recognized by plasma from all patients.
Conclusions: These results show that MSP-7 family members vary in expression profile during blood infections; MSP-7A and 7F are expressed throughout the intraerythrocytic development cycle, while expression of other paralogs is focused on the schizont. This may reflect developmental regulation, and potentially functional differentiation, within the gene family. The frequency of B-cell epitopes among paralogs also varies, with MSP-7A and 7L consistently the most immunogenic. Thus, MSP-7 paralogs cannot be assumed to have equal potential as vaccines. This analysis of clinical infections indicates that the most abundant and immunogenic paralog is MSP-7A.
Keywords: Antigen; Clinical isolates; Epitope; Malaria; Plasmodium vivax; PvMSP-7; Transcriptomics; Vaccine.
Conflict of interest statement
The authors declare that they have no competing interests.
Figures
Similar articles
-
Antibody responses within two leading Plasmodium vivax vaccine candidate antigens in three geographically diverse malaria-endemic regions of India.Malar J. 2019 Dec 16;18(1):425. doi: 10.1186/s12936-019-3066-6. Malar J. 2019. PMID: 31842894 Free PMC article.
-
Immunogenicity and antigenicity of Plasmodium vivax merozoite surface protein 10.Parasitol Res. 2014 Jul;113(7):2559-68. doi: 10.1007/s00436-014-3907-8. Epub 2014 Apr 25. Parasitol Res. 2014. PMID: 24764159
-
Naturally acquired antibodies to Plasmodium vivax blood-stage vaccine candidates (PvMSP-1₁₉ and PvMSP-3α₃₅₉₋₇₉₈ and their relationship with hematological features in malaria patients from the Brazilian Amazon.Microbes Infect. 2012 Aug;14(9):730-9. doi: 10.1016/j.micinf.2012.02.011. Epub 2012 Mar 8. Microbes Infect. 2012. PMID: 22445906
-
Advances toward the development of an asexual blood stage MSP-1 vaccine of Plasmodium vivax.Mem Inst Oswaldo Cruz. 1994;89 Suppl 2:81-4. doi: 10.1590/s0074-02761994000600019. Mem Inst Oswaldo Cruz. 1994. PMID: 7565138 Review. No abstract available.
-
An update on the search for a Plasmodium vivax vaccine.Trends Parasitol. 2007 Mar;23(3):122-8. doi: 10.1016/j.pt.2007.01.008. Epub 2007 Jan 29. Trends Parasitol. 2007. PMID: 17258937 Review.
Cited by
-
Identification of novel Plasmodium vivax proteins associated with protection against clinical malaria.Front Cell Infect Microbiol. 2023 Jan 25;13:1076150. doi: 10.3389/fcimb.2023.1076150. eCollection 2023. Front Cell Infect Microbiol. 2023. PMID: 36761894 Free PMC article.
-
The first complete genome of the simian malaria parasite Plasmodium brasilianum.Sci Rep. 2022 Nov 17;12(1):19802. doi: 10.1038/s41598-022-20706-6. Sci Rep. 2022. PMID: 36396703 Free PMC article.
-
De novo assembly of plasmodium interspersed repeat (pir) genes from Plasmodium vivax RNAseq data suggests geographic conservation of sub-family transcription.BMC Genomics. 2025 May 29;26(1):544. doi: 10.1186/s12864-025-11752-1. BMC Genomics. 2025. PMID: 40442603 Free PMC article.
-
Plasmodium vivax transcriptomics: What is new?Exp Biol Med (Maywood). 2023 Oct;248(19):1645-1656. doi: 10.1177/15353702231198070. Epub 2023 Oct 3. Exp Biol Med (Maywood). 2023. PMID: 37786955 Free PMC article. Review.
-
Rapid Response to Pandemic Threats: Immunogenic Epitope Detection of Pandemic Pathogens for Diagnostics and Vaccine Development Using Peptide Microarrays.J Proteome Res. 2020 Nov 6;19(11):4339-4354. doi: 10.1021/acs.jproteome.0c00484. Epub 2020 Sep 21. J Proteome Res. 2020. PMID: 32892628 Free PMC article. Review.
References
-
- WHO. World malaria report 2018. Geneva: World Health Organization; 2018. https://www.who.int/malaria/publications/world-malaria-report-2018/en/. Accessed 21 Nov 2018.
MeSH terms
Substances
Grants and funding
LinkOut - more resources
Full Text Sources
Research Materials
