. 2019 Jun 13;16(1):80.
doi: 10.1186/s12985-019-1186-9.

Entry of Challenge Virus Standard (CVS) -11 into N2a cells via a clathrin-mediated, cholesterol-, dynamin-, pH-dependent endocytic pathway

Affiliations

Entry of Challenge Virus Standard (CVS) -11 into N2a cells via a clathrin-mediated, cholesterol-, dynamin-, pH-dependent endocytic pathway

Jie Gao et al. Virol J. .

Abstract

Background: Rabies virus (RABV), a member of Lyssavirus of Rhabdoviridae family, is a kind of negative-strand RNA virus. The zoonosis caused by RABV leads to high mortality in animals and humans. Though with the extensive investigation, the mechanisms of RABV entry into cells have not been well characterized.

Methods: Chemical inhibitors and RNA interference (RNAi) were used to analysis RABV internalization pathway. The expression level of viral N protein was examined by quantitative PCR and western blot, and the virus infection in the cells was visualized by fluorescence microscopy.

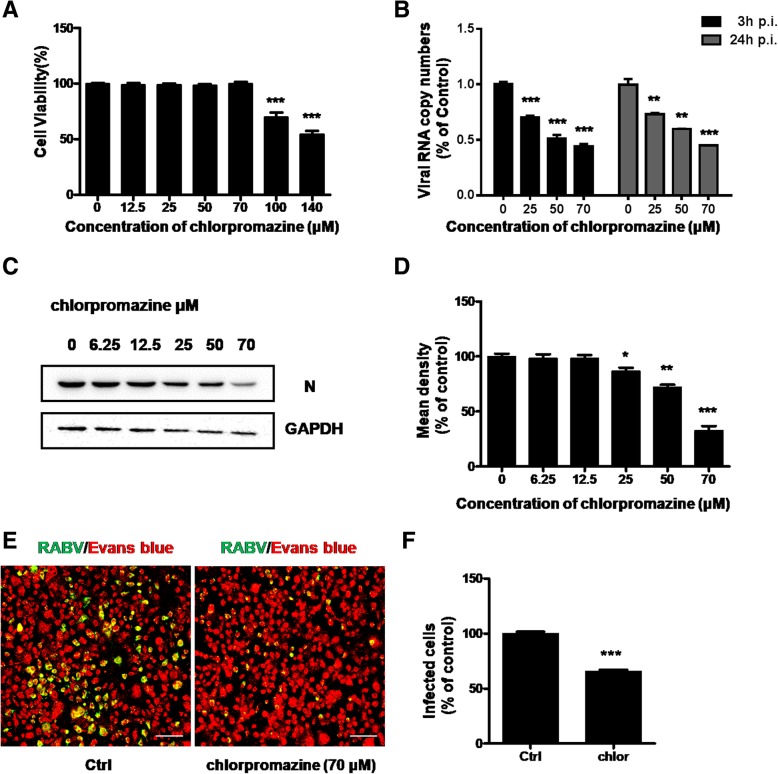
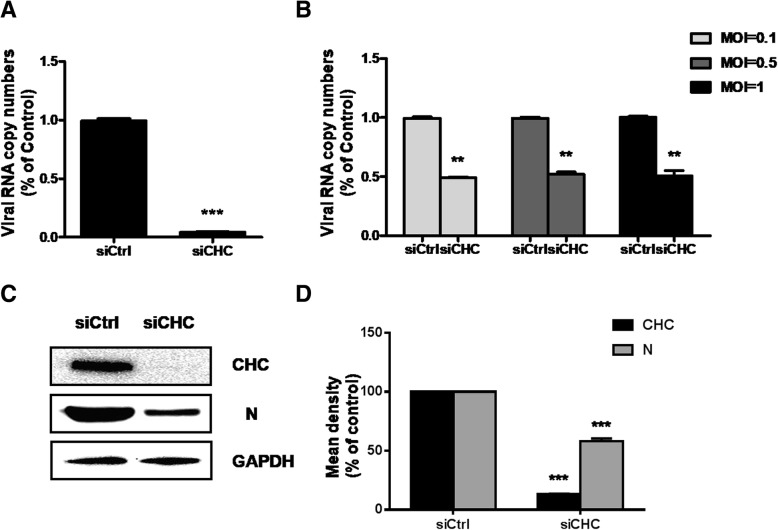
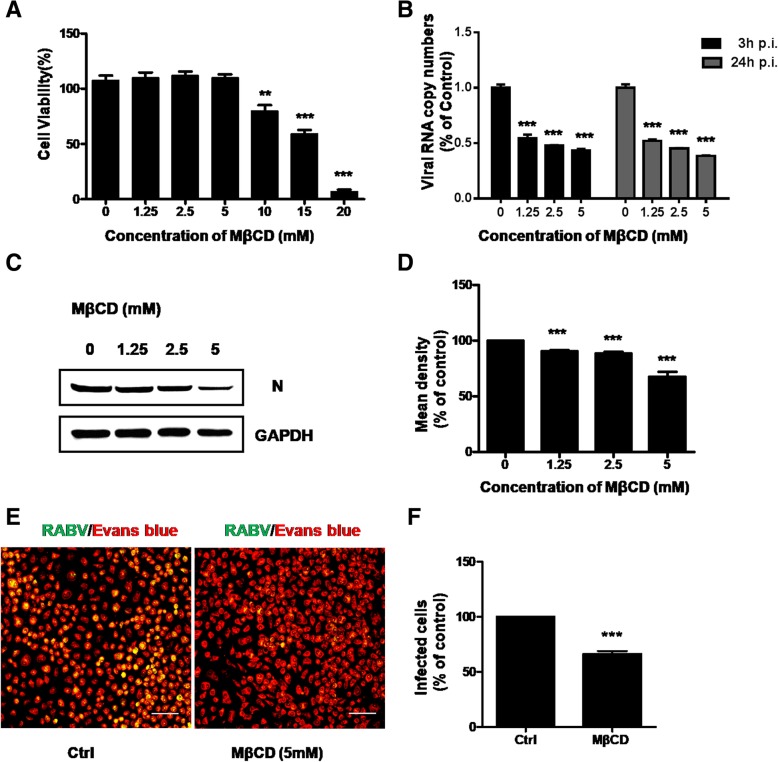
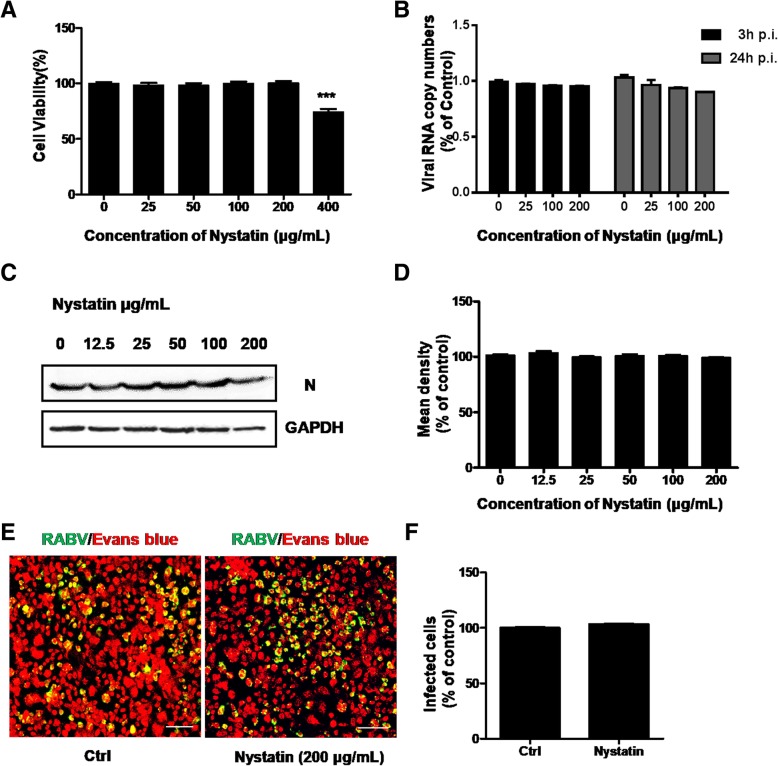
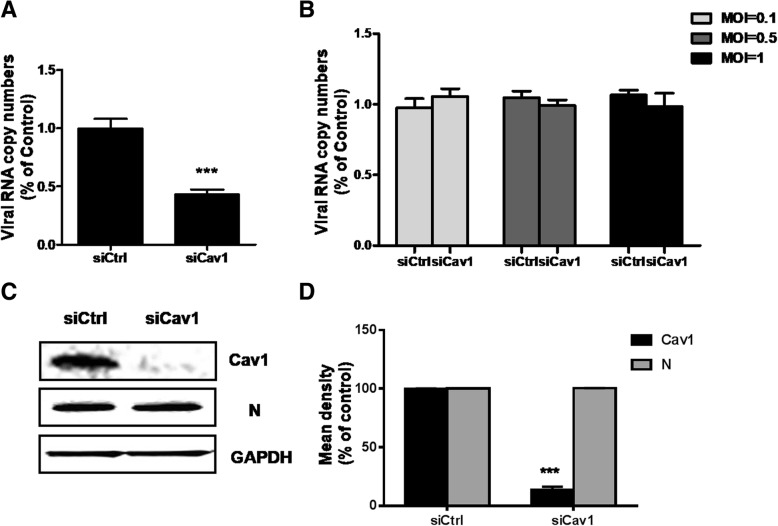
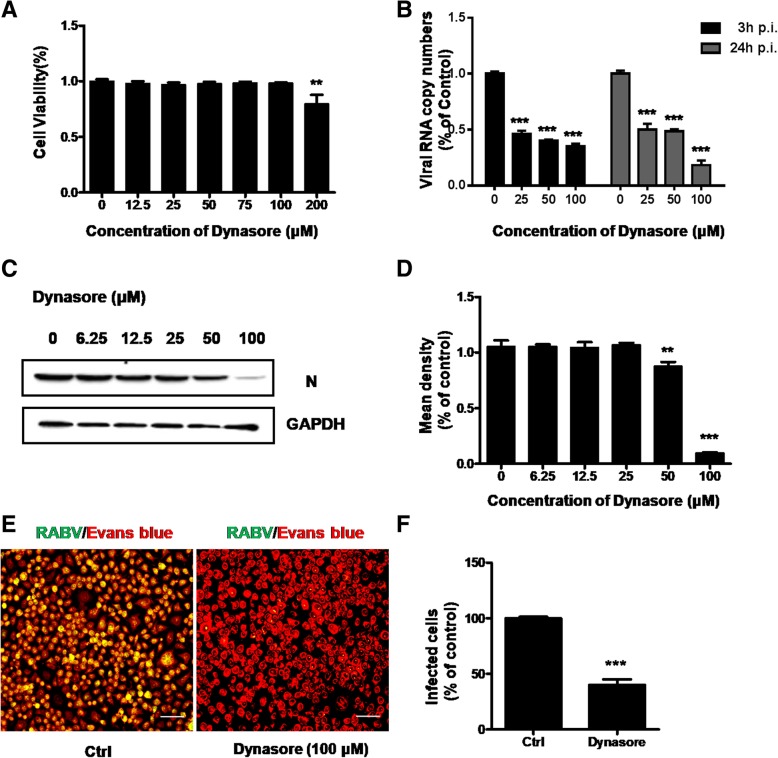
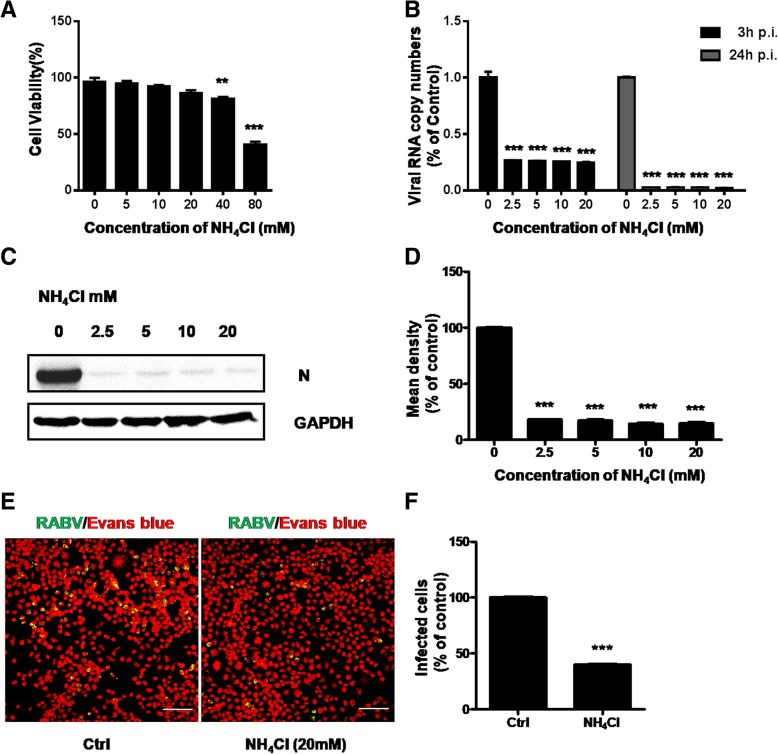
Results: We firstly examined the endocytosis pathway of the challenge virus standard (CVS) -11 strain in N2a cells. Chlorpromazine treatment and knockdown of clathrin heavy chain (CHC) significantly reduced viral entry, which proved clathrin was required. Meanwhile neither nystatin nor knocking down caveolin-1 (Cav1) in N2a cells had an effect on CVS-11 infection, suggesting that caveolae was independent for CVS-11 internalization. And when cholesterol of cell membrane was extracted by MβCD, viral infection was strongly impacted. Additionally by using the specific inhibitor dynasore and ammonium chloride, we verified that dynamin and a low-pH environment were crucial for RABV infection, which was confirmed by confocal microscopy.

Conclusions: Our results demonstrated that CVS-11 entered N2a cells through a clathrin-mediated, cholesterol-, pH-, dynamin-required, and caveolae-independent endocytic pathway.

Keywords: Caveolin-1; Clathrin; Endocytosis; N2a; RABV.


Conflict of interest statement

The authors declare that they have no competing interest.

Figures

Fig. 1
Fig. 1
Effect of chlorpromazine on CVS-11 infection on N2a cells. a Quantification of cytotoxic effects of chlorpromazine on N2a cells ranging from 0 to 140 μM was examined by MTT assay. b, c N2a cells were pretreated with increasing concentrations (0 μM, 25 μM, 50 μM, 70 μM) of chlorpromazine for 1 h at 37 °C and infected with CVS-11 (MOI 0.1). At 3 h and 24 h p.i., infected cells were lysed to determine RABV N RNA copy numbers by RT-qPCR (b). The cells were lysed and processed for western blot analysis of protein N at 48 h p.i.. GAPDH was used as a loading control (c). d Relative protein levels were analyzed by using ImageJ. The results are presented as the mean ± SD of three independent experiments. e N2a cells were treated with 70 μM chlorpromazine for 1 h and infected with CVS-11 (MOI 0.1). At 24 h p.i., cells were fixed and stained with an FITC-anti-Rabies Monoclonal antibody. Cytoplasm was stained with Evans Blue. Scale bars, 70 μm. f The number of infected cells was counted and percentage of infected cells after drug treated compared to control group was assessed. Means and S.D. values are shown. Statistical significances of the differences are indicated. Five fields of about 200 cells were counted. Student’s t test, p < 0.05 (*); p < 0.01 (**); p < 0.001 (***)
Fig. 2
Fig. 2
Clathrin-1 is required for CVS-11 entry. a CHC knockdown was determined by RT-qPCR. b siCtrl- or siCHC- transfected cells were infected with CVS-11 (MOI 0.1, 0.5, 1). At 24 h p.i., the cell was lysed to determine RABV N RNA copy numbers by RT-qPCR. c, d Results are presented as the means ± SD of data from three independent experiments. Effect of CHC knockdown on CVS-11 infectivity was determined by western blot at 48 h p.i. with anti-RABV, anti-CHC and GAPDH antibodies (c). Relative protein levels were analyzed by using ImageJ (d). Student’s t test, p < 0.05 (*); p < 0.01 (**); p < 0.001 (***)
Fig. 3
Fig. 3
Effect of MβCD on CVS-11 infection in N2a cells. a Quantification of cytotoxic effects of MβCD on N2a cells ranging from 0 to 20 mM was examined by MTT assay. b N2a cells were pretreated with increasing concentrations (0 mM, 1.25 mM, 2.5 mM, 5 mM) of MβCD for 1 h at 37 °C and infected with CVS-11 (MOI 0.1). At 3 h and 24 h p.i., infected cells were lysed to determine RABV N RNA copy numbers by RT-qPCR. c The cells were pretreated with increasing concentrations (0 mM, 1.25 mM, 2.5 mM, 5 mM) of MβCD for 1 h at 37 °C and infected with CVS-11 (MOI 0.1). The cells were lysed and processed for western blot analysis of RABV N protein. GAPDH was used as a loading control. d Relative protein levels were analyzed by using ImageJ. The results are presented as the mean ± SD of three independent experiments. e N2a cells were treated with 5 mM MβCD for 1 h and infected with CVS-11 (MOI 0.1). At 24 h p.i., cells were fixed and stained with an FITC-anti-Rabies Monoclonal antibody. Cytoplasm was stained with Evans Blue. Scale bars, 70 μm. f The number of infected cells was counted and percentage of infected cells after drug treated compared to control group was assessed. Means and S.D. values are shown. Statistical significances of the differences are indicated. Five fields of about 200 cells were counted. Student’s t test, p < 0.05 (*); p < 0.01 (**); p < 0.001 (***)
Fig. 4
Fig. 4
Effect of nystatin on CVS-11 infection in N2a cells. a Quantification of cytotoxic effects of nystatin on N2a cells ranging from 0 to 400 μM was examined by MTT assay. b N2a cells were pretreated with increasing concentrations (0 μM, 25 μM, 100 μM, 200 μM) of nystatin for 1 h at 37 °C and infected with CVS-11 (MOI 0.1). At 3 h and 24 h p.i., infected cells were lysed to determine RABV N RNA copy numbers by RT-qPCR. c The cells were pretreated with increasing concentration (0 μM, 12.5 μM, 25 μM, 50 μM, 100 μM, 200 μM) of nystatin for 1 h at 37 °C and infected with CVS (MOI 0.1). The cells were lysed and processed for western blot analysis of RV-N protein. GAPDH was used as a loading control. d Relative protein levels were analyzed by using ImageJ. The results are presented as the mean ± SD of three independent experiments. e N2a cells were treated with 200 μM nystatin for 1 h and infected with CVS-11 (MOI 0.1). At 24 h p.i., cells were fixed and stained with an FITC-anti-Rabies Monoclonal antibody. Cytoplasm was stained with Evans Blue. Scale bars, 70 μm. f The number of infected cells was counted and percentage of infected cells after drug treated compared to control group was assessed. Means and S.D. values are shown. Statistical significances of the differences are indicated. Five fields of about 200 cells were counted. Student’s t test, p < 0.05 (*); p < 0.01 (**); p < 0.001 (***)
Fig. 5
Fig. 5
Caveolin-1 is not required for CVS-11 entry. a Caveolin-1(Cav1) knockdown was determined by RT-qPCR. b siCtrl- or siCav1- transfected cells were infected with CVS-11 (MOI 0.1, 0.5, 1). At 24 h p.i., the cells were lysed to determine RABV N RNA copy numbers by RT-qPCR. c, d Results are presented as the means ± SD of data from three independent experiments. Effect of Cav1 knockdown on CVS-11 infectivity was determined by western blot at 48 h p.i. with anti-RABV, anti-Cav1 and GAPDH antibodies (c). Relative protein levels were analyzed by using ImageJ (d). Student’s t test, p < 0.05 (*); p < 0.01 (**); p < 0.001 (***)
Fig. 6
Fig. 6
Effect of dynasore on CVS-11 infection in N2a cells. a Quantification of cytotoxic effects of dynasore on N2a cells ranging from 0 to 200 μM was examined by MTT assay. b N2a cells were pretreated with increasing concentrations (0 μM, 25 μM, 50 μM, 100 μM) of dynasore for 1 h at 37 °C and infected with CVS-11 (MOI 0.1). At 3 h and 24 h p.i., infected cells were lysed to determine RABV N RNA copy numbers by RT-qPCR. c The cells were pretreated with increasing concentration (0 μM, 6.25 μM, 12.5 μM, 25 μM, 50 μM, 100 μM) of dynasore for 1 h at 37 °C and infected with CVS-11 (MOI 0.1). The cells were lysed and processed for western blot analysis of RABV N protein. GAPDH was used as a loading control. d Relative protein levels were analyzed by using ImageJ. The results are presented as the mean ± SD of three independent experiments. e N2a cells were treated with 100 μM dynasore for 1 h and infected with CVS-11 (MOI 0.1). At 24 h p.i., cells were fixed and stained with an FITC-anti-Rabies Monoclonal antibody. Cytoplasm was stained with Evans Blue. Scale bars, 70 μm. f The number of infected cells was counted and percentage of infected cells after drug treated compared to control group was assessed. Five fields of about 200 cells were counted. Means and S.D. values are shown. Statistical significances of the differences are indicated. Student’s t test, p < 0.05 (*); p < 0.01 (**); p < 0.001 (***)
Fig. 7
Fig. 7
Effect of NH4Cl on CVS-11 infection in N2a cells. a Quantification of cytotoxic effects of NH4Cl on N2a cells ranging from 0 to 80 mM was examined by MTT assay. b N2a cells were pretreated with increasing concentrations (0 mM, 2.5 mM, 5 mM, 10 mM, 20 mM) of NH4Cl for 1 h at 37 °C and infected with CVS-11 (MOI 0.1). At 3 h and 24 h p.i., infected cells were lysed to determine RABV N RNA copy numbers by RT-qPCR. c The cells were pretreated with increasing concentration (0 mM, 2.5 mM, 5 mM, 10 mM, 20 mM) of NH4Cl for 1 h at 37 °C and infected with CVS-11 (MOI 0.1). The cells were lysed and processed for western blot analysis of RABV N protein. GAPDH was used as a loading control. d Relative protein levels were analyzed by using ImageJ. The results are presented as the mean ± SD of three independent experiments. e N2a cells were treated with 20 mM NH4Cl for 1 h and infected with CVS-11 (MOI 0.1). At 24 h p.i., cells were fixed and stained with an FITC-anti-Rabies Monoclonal antibody. Cytoplasm was stained with Evans Blue. Scale bars, 70 μm. f The number of infected cells was counted and percentage of infected cells after drug treated compared to control group was assessed. Five fields of about 200 cells were counted. Means and S.D. values are shown. Statistical significances of the differences are indicated. Student’s t test, p < 0.05 (*); p < 0.01 (**); p < 0.001 (***)

Similar articles

Cited by

References

    1. Dietzschold B, Schnell M, Koprowski H. Pathogenesis of rabies. Curr Top Microbiol Immunol. 2005;292:45–56. - PubMed
    1. Okumura A, Harty RN. Rabies virus assembly and budding. Adv Virus Res. 2011;79:23–32. doi: 10.1016/B978-0-12-387040-7.00002-0. - DOI - PubMed
    1. Maillard AP, Gaudin Y. Rabies virus glycoprotein can fold in two alternative, antigenically distinct conformations depending on membrane-anchor type. J Gen Virol. 2002;83:1465–1476. doi: 10.1099/0022-1317-83-6-1465. - DOI - PubMed
    1. Lafon M. Rabies virus receptors. J Neuro-Oncol. 2005;11:82–87. - PubMed
    1. Wang JL, Wang ZL, Liu RQ, Shuai L, Wang XX, Luo J, et al. Metabotropic glutamate receptor subtype 2 is a cellular receptor for rabies virus. PLoS Pathog. 2018;14:e1007189. doi: 10.1371/journal.ppat.1007189. - DOI - PMC - PubMed

Publication types