. 2019 Jun 13;38(1):251.
doi: 10.1186/s13046-019-1242-8.

Heart failure drug proscillaridin A targets MYC overexpressing leukemia through global loss of lysine acetylation

Affiliations

Heart failure drug proscillaridin A targets MYC overexpressing leukemia through global loss of lysine acetylation

Elodie M Da Costa et al. J Exp Clin Cancer Res. .

Abstract

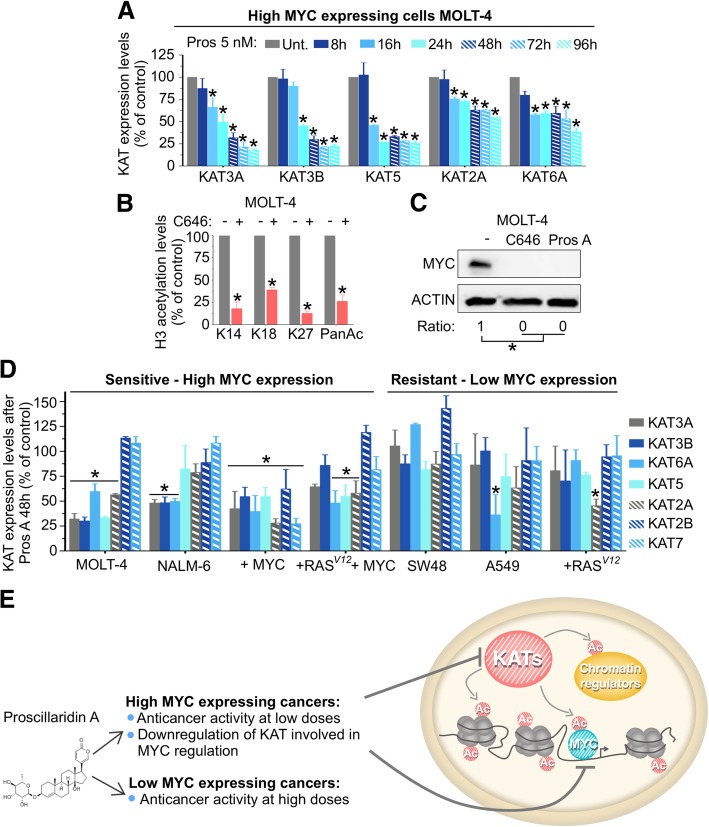
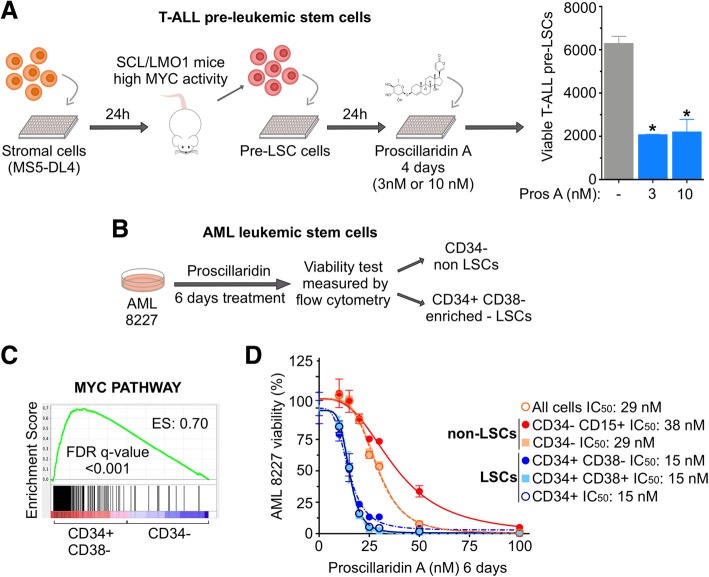
Background: Cardiac glycosides are approved for the treatment of heart failure as Na+/K+ pump inhibitors. Their repurposing in oncology is currently investigated in preclinical and clinical studies. However, the identification of a specific cancer type defined by a molecular signature to design targeted clinical trials with cardiac glycosides remains to be characterized. Here, we demonstrate that cardiac glycoside proscillaridin A specifically targets MYC overexpressing leukemia cells and leukemia stem cells by causing MYC degradation, epigenetic reprogramming and leukemia differentiation through loss of lysine acetylation.

Methods: Proscillaridin A anticancer activity was investigated against a panel of human leukemia and solid tumor cell lines with different MYC expression levels, overexpression in vitro systems and leukemia stem cells. RNA-sequencing and differentiation studies were used to characterize transcriptional and phenotypic changes. Drug-induced epigenetic changes were studied by chromatin post-translational modification analysis, expression of chromatin regulators, chromatin immunoprecipitation, and mass-spectrometry.

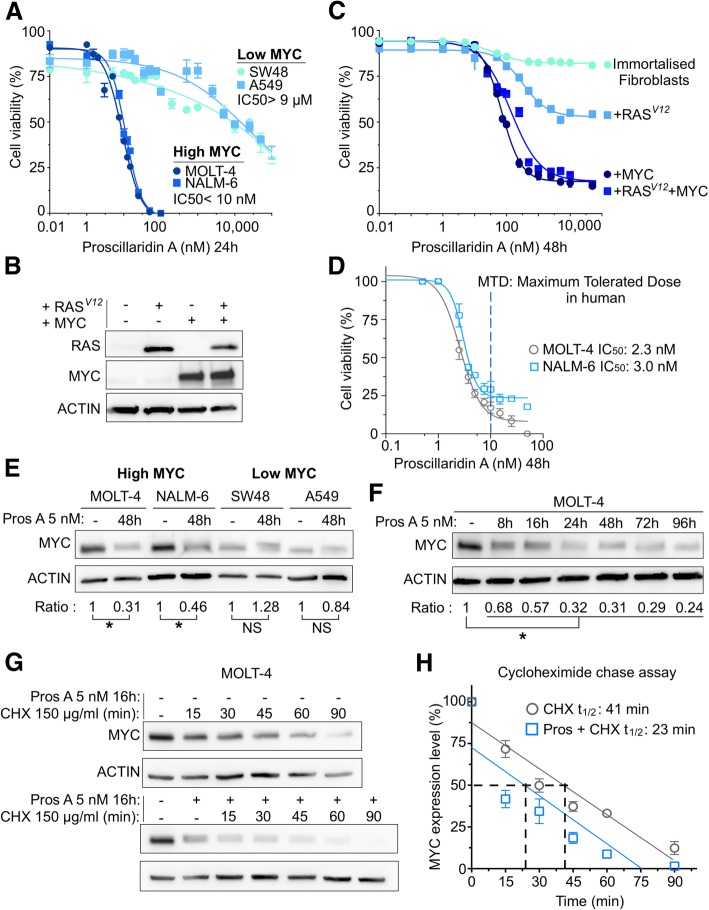
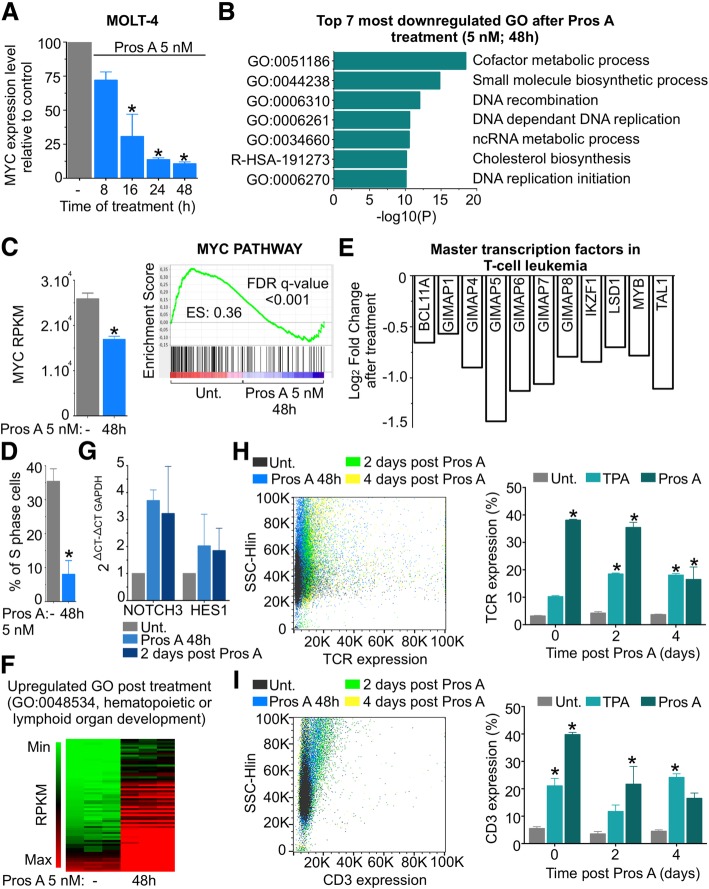
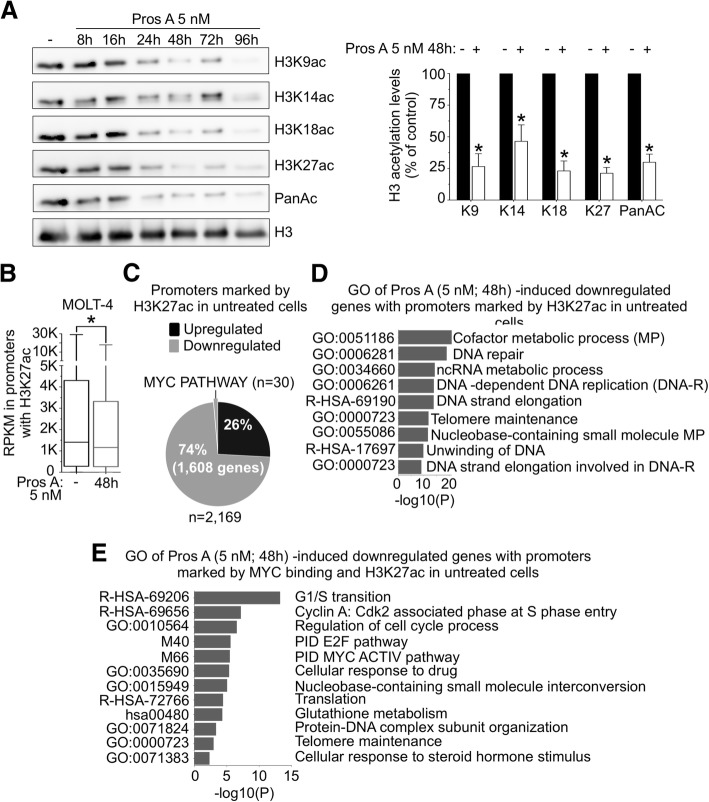
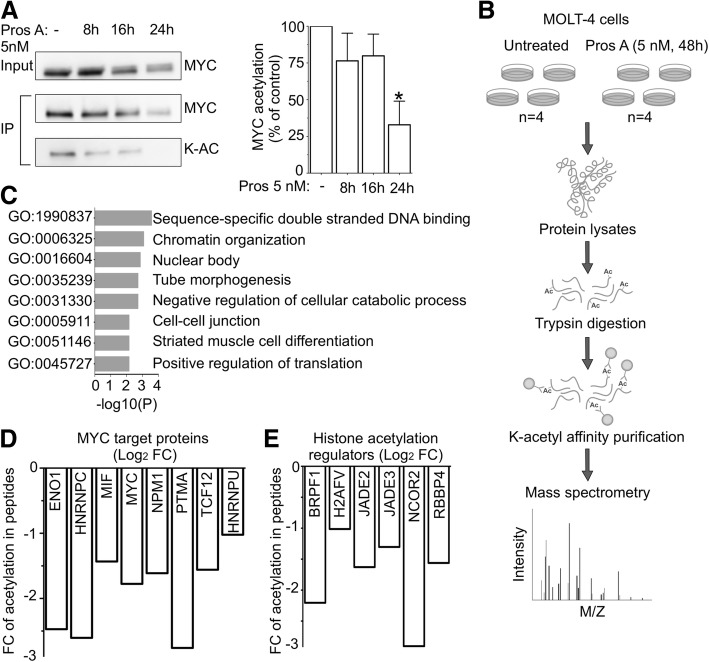
Results: At a clinically relevant dose, proscillaridin A rapidly altered MYC protein half-life causing MYC degradation and growth inhibition. Transcriptomic profile of leukemic cells after treatment showed a downregulation of genes involved in MYC pathways, cell replication and an upregulation of hematopoietic differentiation genes. Functional studies confirmed cell cycle inhibition and the onset of leukemia differentiation even after drug removal. Proscillaridin A induced a significant loss of lysine acetylation in histone H3 (at lysine 9, 14, 18 and 27) and in non-histone proteins such as MYC itself, MYC target proteins, and a series of histone acetylation regulators. Global loss of acetylation correlated with the rapid downregulation of histone acetyltransferases. Importantly, proscillaridin A demonstrated anticancer activity against lymphoid and myeloid stem cell populations characterized by MYC overexpression.

Conclusion: Overall, these results strongly support the repurposing of proscillaridin A in MYC overexpressing leukemia.

Keywords: Cardiac glycosides; Chromatin remodelling; Leukemia; Leukemia stem cells; Lysine acetylation; Lysine acetyltransferase; MYC; Proscillaridin A.


Conflict of interest statement

The authors declare that they have no competing interests.

Figures

Fig. 1
Fig. 1
Targeting High MYC Expressing Cancer Cells with Cardiac Glycoside Proscillaridin A. a Cell viability and half-maximal inhibitory concentration (IC50) calculations after a 24 h proscillaridin A treatment (ranging from 1 nM to 100 μM) in a high MYC expressing human leukemia cell lines (MOLT-4 and NALM-6) and in low MYC expressing human tumor cell lines (SW48 and A549) (n = 4). b MYC and RAS protein expression assessed by western blotting in immortalized fibroblasts and fibroblasts transduced with RASV12, MYC and RASV12/MYC (n = 3). c Dose response curves after 48 h proscillaridin A treatment (0.01 nM to 50 μM) in immortalized fibroblasts and fibroblasts transduced with RASV12, MYC and RASV12/MYC (n = 4). d Dose response curves and IC50 values after 48 h proscillaridin A treatment (ranging from 0.1 nM to 100 nM) in MOLT-4 (T-cell leukemia), and NALM-6 (B-cell leukemia) (n = 3). Maximum tolerated dose in human is indicated. e MYC protein expression after proscillaridin A treatment (5 nM; 48 h) in MOLT-4, NALM-6, SW48 (colon cancer) and A549 (lung cancer) cells assessed by western blotting. MYC expression is calculated as a ratio over ACTIN levels (*indicates P < 0.05; One-way ANOVA; n = 3). f Time course experiment in MOLT-4 cells treated with proscillaridin A at 5 nM (8 h to 96 h). MYC protein expression is calculated as a ratio over ACTIN levels (*indicates P < 0.05; One-way ANOVA; n = 3). g Effect of proscillaridin A on MYC half-life in MOLT-4 cells. MYC half-life was estimated by cycloheximide (CHX) treatment (150 μg/ml) in MOLT-4 cells pretreated or not with proscillaridin A (5 nM, 16 h). MYC protein expression was performed by Western blotting and ACTIN expression was used as loading control. h MYC expression level after cycloheximide treatment (150 μg/ml) was quantified over ACTIN levels and expressed relative to the level at time zero (grey) or expressed relative to the level following proscillaridin A treatment (5 nM, 16 h; blue). Linear regression analysis was conducted and MYC half-life was calculated
Fig. 2
Fig. 2
Transcriptomic Profiles from Replicative To Differentiated Phenotype After Low Dose Proscillaridin A Treatment in High MYC Expressing Leukemic Cells. a Quantitative PCR (qPCR) analysis of MYC mRNA expression after proscillaridin A treatment (5 nM; 8 h to 48 h) in MOLT-4 cells, relative to untreated cells and normalized to β-2-microglobulin (*indicates P < 0.05; One-way ANOVA; n = 3). b Transcriptomic analysis by RNA-Sequencing of untreated and proscillaridin A-treated (5 nM; 48 h) MOLT-4 cells (n = 3). Genes downregulated by proscillaridin A treatment (Log2 FC < -0.5) were analyzed by Metascape and the top 7 Gene Ontology (GO) pathways are displayed. c Left panel, MYC transcript (RPKM) expression after proscillaridin A treatment (5 nM; 48 h) in RNA-sequencing data set (*indicates P < 0.02, paired t-test, n = 3). Right panel, gene set enrichment analysis of MYC pathway before and after proscillaridin A treatment (5 nM; 48 h) in MOLT-4 cells. Enrichment score (ES) and false discovery rate (FDR) rates are shown on the graph. d Effect of proscillaridin A treatment (5 nM; 48 h) on the percentage of S phase cell population on MOLT-4 cells (* indicates P < 0.017, paired t-test, n = 3). e Gene expression values (Log2 fold change) obtained from RNA-sequencing in 11 genes downregulated after proscillaridin A treatment (5 nM; 48 h) in MOLT-4 cells. These genes were selected due to their role as master transcription factors associated in T-cell leukemia. f Heat map of gene expression levels (RPKM) involved in differentiation pathways (MOLT-4 cells) before and after proscillaridin A treatment (5 nM; 48 h). g Quantitative PCR (qPCR) analysis of NOTCH3 and HES1 mRNA expression measured after proscillaridin A treatment (5 nM; 48 h) and 2 days post treatment, relative to untreated cells and normalized to GAPDH in MOLT-4 cells (n = 2). h and i Left panel, T-cell differentiation markers TCR and CD3 are measured by flow cytometry in MOLT-4 cells after proscillaridin A treatment (5 nM; 48 h), as well as 2 and 4 days post treatment (n = 3). Right panel, percentage of TCR and CD3 expression in MOLT-4 cells. TPA treatment (10 nM; 48 h, followed by a 24 h resting period) was used as positive control of T-cell differentiation (*indicates P < 0.05; Two-way ANOVA; n = 3)
Fig. 3
Fig. 3
Gene Reprogramming Induced by Proscillaridin A Is Associated with Global Acetylation Loss in Histone H3. a Left panel, MOLT-4 cells were treated with proscillaridin A (5 nM) and histones were acid-extracted after 8, 16, 24, 48, 72 and 96 h. Histone 3 acetylation levels were assessed using antibodies against K9 ac, K14 ac, K18 ac, K27 ac, and total histone 3 acetylation. H3 was used as loading control. Right panel, H3 acetylation levels at 48 h treatment were quantified and expressed as a percentage of untreated cells (* indicates P < 0.05; Two-way ANOVA; n = 3). b 2169 genes are marked by H3K27ac in promoter regions (− 500/+ 500 bp) in untreated MOLT-4 cells. RPKM values of differentially expressed genes (FC > 1; FC < -0.5) from RNA-sequencing data before and after proscillaridin A treatment are displayed (* indicates P < 0.006; paired t-test; n = 3). c Pie chart shows percentage of upregulated (black) and downregulated (grey, including 30 MYC targets) genes after treatment (5 nM, 48 h) of genes marked by H3K27ac and MYC binding in promoters of untreated MOLT-4 cells. d Metascape analysis of genes marked by H3K27ac in promoters in untreated MOLT-4 cells and downregulated after proscillaridin A treatment (5 nM; 48 h). Top 9 GO pathways are displayed. e Metascape analysis of the 30 MYC target genes
Fig. 4
Fig. 4
Acetylation Decrease In MYC Targets And Chromatin Regulators Induced by proscillaridin A In High MYC Expressing Cells. a Left panel, immunoprecipitation (IP) of MYC total lysine acetylation (K-AC) after proscillaridin A treatment (5 nM; 8 h–16 h-24 h) in MOLT-4 cells. Right panel, total lysine acetylation level on MYC was quantified and expressed as a percentage of untreated cells (* indicates P < 0.05; One-way ANOVA; n = 3). b Lysine acetylome profiling of MOLT-4 cells before and after proscillaridin A treatment (5 nM; 48 h). c Lysine acetylome metascape analysis in 28 peptides with significant loss of acetylation (Log2FC < − 1) after proscillaridin A treatment (5 nM; 48 h) in MOLT-4 cells. d Log2FC of acetylation levels in MYC target proteins (untreated VS treated). e Log2FC of acetylation levels of histone regulators (untreated VS treated)
Fig. 5
Fig. 5
Proscillaridin A Treatment Induces Downregulation of KATs Involved In MYC Acetylation. a KAT2A (GCN5), KAT3A (CBP), KAT3B (P300), KAT5 (TIP60), and KAT6A (MOZ) expression levels after proscillaridin A treatment (5 nM, 48 h) were assessed by western blotting in MOLT-4 cells (ACTIN was used as loading control). b Quantification of H3 acetylation levels after treatment with KAT3B/A inhibitor C646 (10 μM, 48 h) (* indicates P < 0.05; Two-way ANOVA; n = 3). c MYC protein expression after C646 treatment and proscillaridin A treatment (5 nM; 48 h). ACTIN was used as loading control. d MOLT-4, NALM-6, SW48 and A549 cell lines were treated with proscillaridin A (5 nM, 48 h) and fibroblasts transduced with RASV12, MYC and RASV12/MYC were treated with proscillaridin A (70 nM, 48 h). KAT3A (CBP), KAT3B (P300), KAT5 (TIP60), KAT2A (GCN5), KAT2B (PCAF), KAT6A (MOZ) and KAT7 (HBO1) expression levels were assessed by western blotting, quantified and expressed as percentage of untreated cells (* indicates P < 0.05; One-way ANOVA; n = 3). e Scheme showing that proscillaridin A targets high MYC expressing leukemic cells by inhibiting histone acetyltransferases involved in MYC acetylation and stability and causing loss of histone 3 acetylation
Fig. 6
Fig. 6
Proscillaridin A Targets Leukemic Stem Cells (LSCs). a Cell viability assay of T-ALL pre-LSC co-cultured with MS5-DL4 cells. Proscillaridin A (3 nM or 10 nM) was added 24 h after co-culture, and cells were sorted for pre-LSC viability 4-days post treatment (*indicates P < 0.05; One-way ANOVA; n ≤ 3). b Cell viability assay of AML 8227 population composed of LSCs (CD34+) and non-LSCs (CD34/CD15+/−). AML 8227 were treated with proscillaridin A (10 nM to 100 nM) for 6 days and cell viability was measured for each cell subgroup by flow cytometry. c Gene set enrichment analysis of MYC pathway between two AML 8227 subgroups: LSC-enriched population CD34+/CD38 compared to non-LSC population CD34. Enrichment score (ES) and false discovery rate (FDR) rates are shown on the graph. d Dose response curves and IC50 values after a 6-day proscillaridin A treatment (ranging from 10 nM to 100 nM) in each AML 8227 subgroup (n = 3)

Similar articles

Cited by

References

    1. Bradner JE, Hnisz D, Young RA. Transcriptional addiction in cancer. Cell. 2017;168(4):629–643. - PMC - PubMed
    1. Dang CV. MYC on the path to cancer. Cell. 2012;149(1):22–35. - PMC - PubMed
    1. Delgado MD, Leon J. Myc roles in hematopoiesis and leukemia. Genes Cancer. 2010;1(6):605–616. - PMC - PubMed
    1. Gerby B, Tremblay CS, Tremblay M, Rojas-Sutterlin S, Herblot S, Hebert J, et al. SCL, LMO1 and Notch1 reprogram thymocytes into self-renewing cells. PLoS Genet. 2014;10(12):e1004768. - PMC - PubMed
    1. Felsher DW, Bishop JM. Reversible tumorigenesis by MYC in hematopoietic lineages. Mol Cell. 1999;4(2):199–207. - PubMed

MeSH terms