

Calorie restriction with regular chow, but not a high-fat diet, delays onset of spontaneous osteoarthritis in the Hartley guinea pig model
- PMID: 31196172
- PMCID: PMC6567638
- DOI: 10.1186/s13075-019-1925-8
Calorie restriction with regular chow, but not a high-fat diet, delays onset of spontaneous osteoarthritis in the Hartley guinea pig model
Abstract
Background: Obesity is a leading risk factor for osteoarthritis (OA). In contrast, calorie restriction (CR) may lessen OA due to improved systemic inflammatory status and reduced weight-bearing. The aim of this study was to determine how CR with regular chow versus a high-fat diet (HFD) alters OA progression using the Hartley guinea pig model of disease.
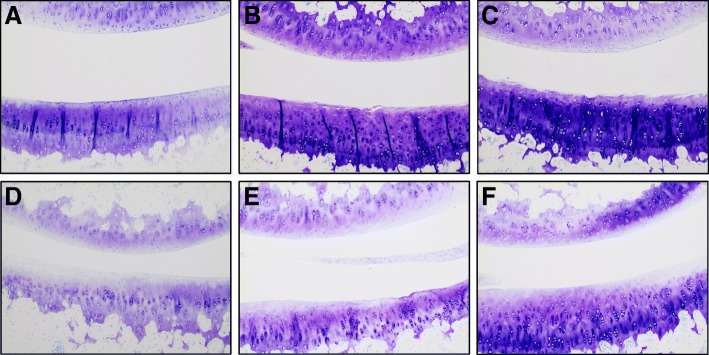
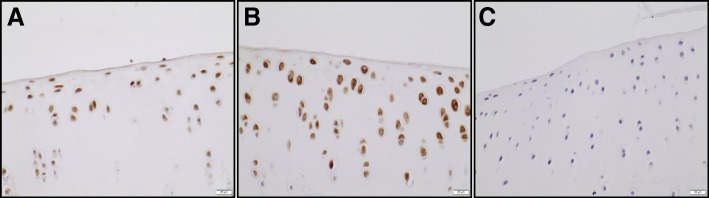
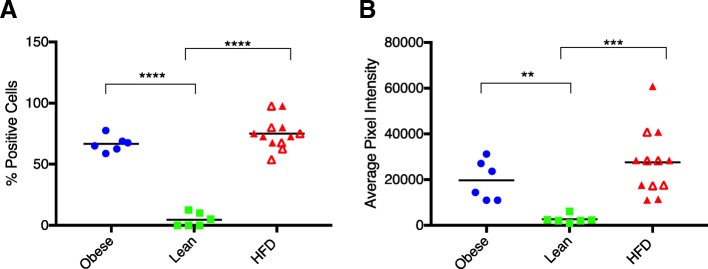
Methods: Twenty-four male guinea pigs were allocated to four groups at 2 months of age: (1) ad libitum regular chow (obese), (2) CR regular chow (lean), (3) ad libitum HFD, and (4) CR HFD. Animals in both HFD groups ate identical amounts and were combined into one HFD group for analyses. At 5 months, hind limbs were harvested for microcomputed tomography (microCT) and histopathologic evaluation of knee OA. Total body, gonad fat, and infrapatellar fat pad (IFP) masses were recorded. IFPs were collected for gene expression analysis. Immunohistochemistry for monocyte chemoattractant protein-1 (MCP-1) was performed on intact joints. Serum was utilized for protein C3 measurement. All data were compared using ordinary one-way ANOVA analyses with Tukey's post-hoc tests.
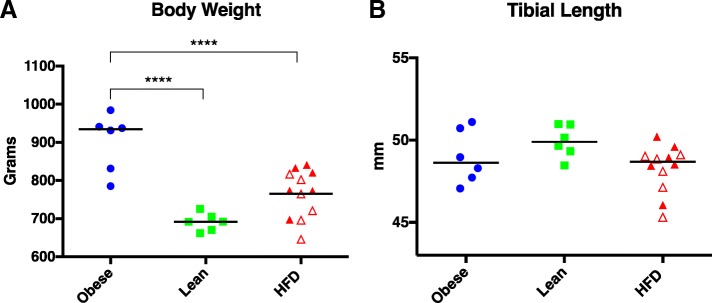
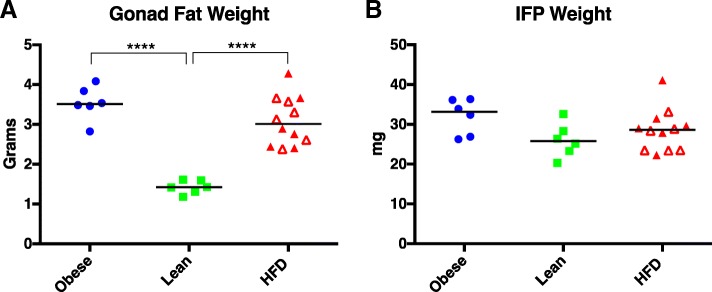
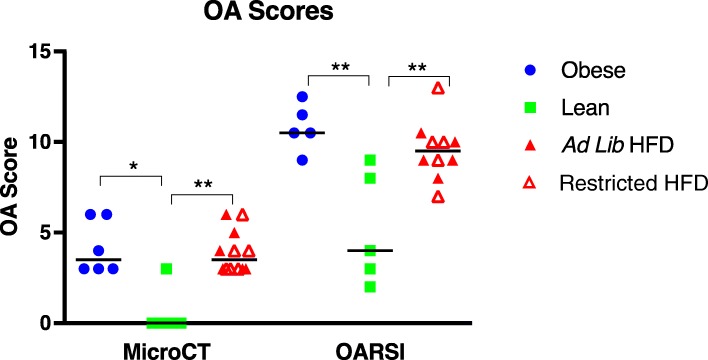
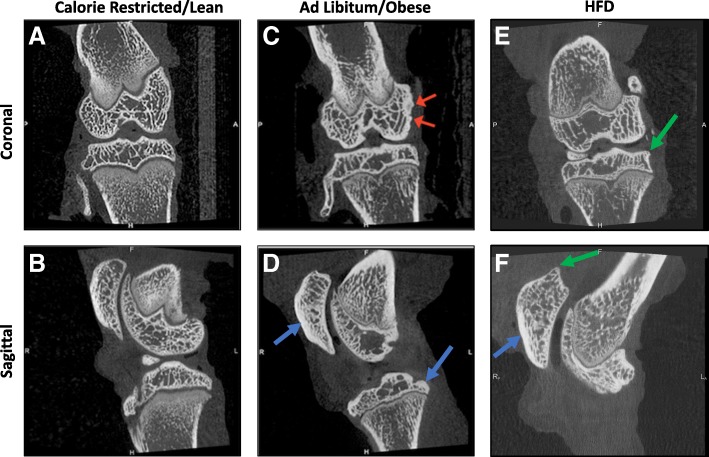
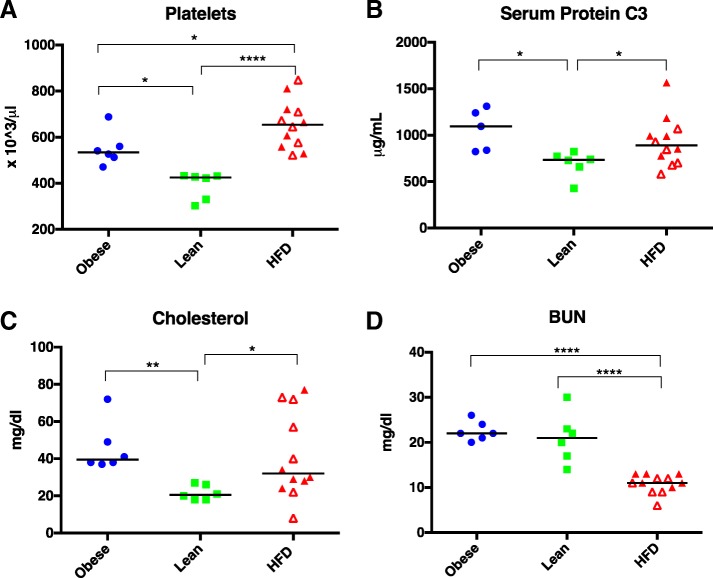
Results: Body mass in the lean and HFD groups were similar and lower than the obese group. Despite this, gonad fat pads in the HFD group were comparable to the obese group. MicroCT and histologic OA scores were similar in obese and HFD groups; both scores were significantly lower in the lean group. Obese and HFD groups displayed increased gene expression of pro-inflammatory and catabolic mediators in IFPs relative to lean animals. Consistent with this, immunohistochemistry for MCP-1 in knee joints demonstrated strong positive staining in obese and HFD groups but was minimally detected in lean animals. Serum protein C3 levels were also statistically higher.
Conclusions: This study demonstrated that CR with a regular chow diet lessened knee OA in the Hartley guinea pig and was associated with decreased local and systemic inflammation compared to obese animals. HFD animals, although under CR conditions, had OA scores and inflammatory markers similar to obese animals. Thus, diet composition, and not solely body weight, may be a key factor in development of OA.
Keywords: Calorie restriction; Hartley guinea pig; High-fat diet; Obesity; Osteoarthritis.
Conflict of interest statement
The authors declare that they have no competing interests.
Figures
Similar articles
-
Human Infrapatellar Fat Pad Mesenchymal Stem Cell-derived Extracellular Vesicles Purified by Anion Exchange Chromatography Suppress Osteoarthritis Progression in a Mouse Model.Clin Orthop Relat Res. 2024 Jul 1;482(7):1246-1262. doi: 10.1097/CORR.0000000000003067. Epub 2024 Apr 19. Clin Orthop Relat Res. 2024. PMID: 38662932 Free PMC article.
-
Systemic iron overload exacerbates osteoarthritis in the strain 13 guinea pig.Osteoarthritis Cartilage. 2020 Sep;28(9):1265-1275. doi: 10.1016/j.joca.2020.06.005. Epub 2020 Jul 3. Osteoarthritis Cartilage. 2020. PMID: 32629162 Free PMC article.
-
Development of a microcomputed tomography scoring system to characterize disease progression in the Hartley guinea pig model of spontaneous osteoarthritis.Connect Tissue Res. 2018 Nov;59(6):523-533. doi: 10.1080/03008207.2017.1409218. Epub 2017 Dec 11. Connect Tissue Res. 2018. PMID: 29226725 Free PMC article.
-
Mobile bearing vs fixed bearing prostheses for posterior cruciate retaining total knee arthroplasty for postoperative functional status in patients with osteoarthritis and rheumatoid arthritis.Cochrane Database Syst Rev. 2015 Feb 4;2015(2):CD003130. doi: 10.1002/14651858.CD003130.pub3. Cochrane Database Syst Rev. 2015. PMID: 25650566 Free PMC article.
-
Weight loss interventions for chronic asthma.Cochrane Database Syst Rev. 2012 Jul 11;2012(7):CD009339. doi: 10.1002/14651858.CD009339.pub2. Cochrane Database Syst Rev. 2012. PMID: 22786526 Free PMC article.
Cited by
-
Insulin Resistance in Osteoarthritis: Similar Mechanisms to Type 2 Diabetes Mellitus.J Nutr Metab. 2020 May 21;2020:4143802. doi: 10.1155/2020/4143802. eCollection 2020. J Nutr Metab. 2020. PMID: 32566279 Free PMC article. Review.
-
[Indirubin relieves inflammatory injury of chondrocytes in a mouse model of osteoarthritis].Nan Fang Yi Ke Da Xue Xue Bao. 2022 Sep 20;42(9):1381-1388. doi: 10.12122/j.issn.1673-4254.2022.09.15. Nan Fang Yi Ke Da Xue Xue Bao. 2022. PMID: 36210712 Free PMC article. Chinese.
-
Naturally Occurring Osteoarthritis Features and Treatments: Systematic Review on the Aged Guinea Pig Model.Int J Mol Sci. 2022 Jun 30;23(13):7309. doi: 10.3390/ijms23137309. Int J Mol Sci. 2022. PMID: 35806306 Free PMC article.
-
The current insights of mitochondrial hormesis in the occurrence and treatment of bone and cartilage degeneration.Biol Res. 2024 Jun 1;57(1):37. doi: 10.1186/s40659-024-00494-1. Biol Res. 2024. PMID: 38824571 Free PMC article. Review.
-
Potential Methods of Targeting Cellular Aging Hallmarks to Reverse Osteoarthritic Phenotype of Chondrocytes.Biology (Basel). 2022 Jun 30;11(7):996. doi: 10.3390/biology11070996. Biology (Basel). 2022. PMID: 36101377 Free PMC article. Review.
References
-
- Cross Marita, Smith Emma, Hoy Damian, Nolte Sandra, Ackerman Ilana, Fransen Marlene, Bridgett Lisa, Williams Sean, Guillemin Francis, Hill Catherine L, Laslett Laura L., Jones Graeme, Cicuttini Flavia, Osborne Richard, Vos Theo, Buchbinder Rachelle, Woolf Anthony, March Lyn. The global burden of hip and knee osteoarthritis: estimates from the Global Burden of Disease 2010 study. Annals of the Rheumatic Diseases. 2014;73(7):1323–1330. doi: 10.1136/annrheumdis-2013-204763. - DOI - PubMed
Publication types
MeSH terms
Substances
Grants and funding
LinkOut - more resources
Full Text Sources
Research Materials
Miscellaneous
