. 2019 Jun 14;7(1):90.
doi: 10.1186/s40478-019-0742-2.

Sporadic Creutzfeldt-Jakob disease prion infection of human cerebral organoids

Affiliations

Sporadic Creutzfeldt-Jakob disease prion infection of human cerebral organoids

Bradley R Groveman et al. Acta Neuropathol Commun. .

Erratum in

Abstract

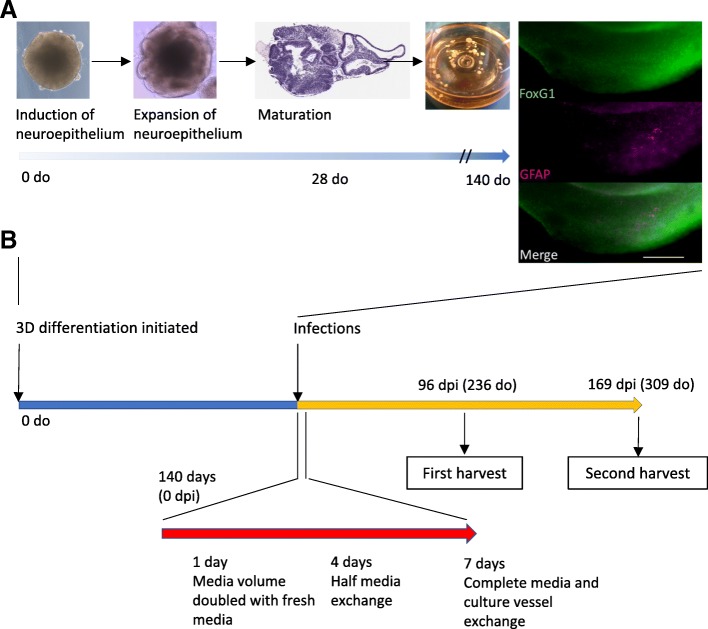
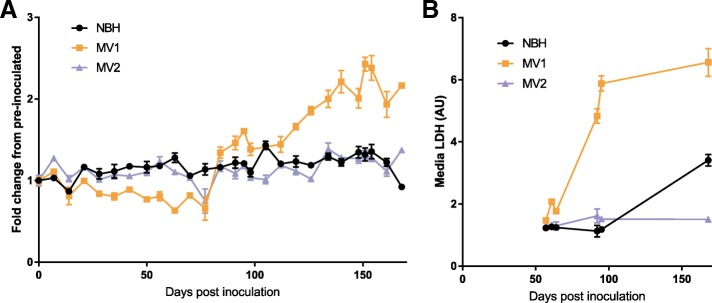
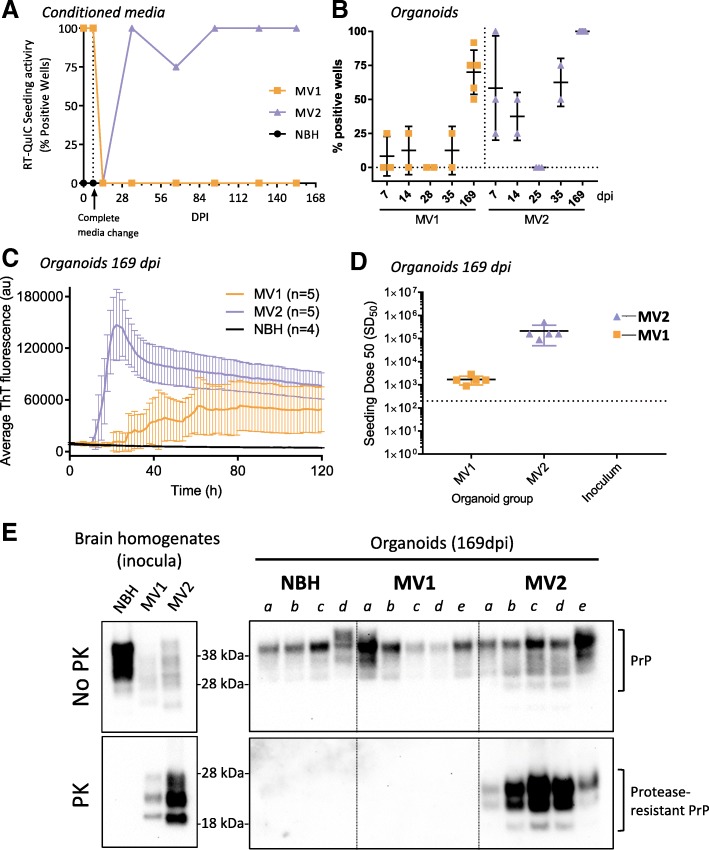
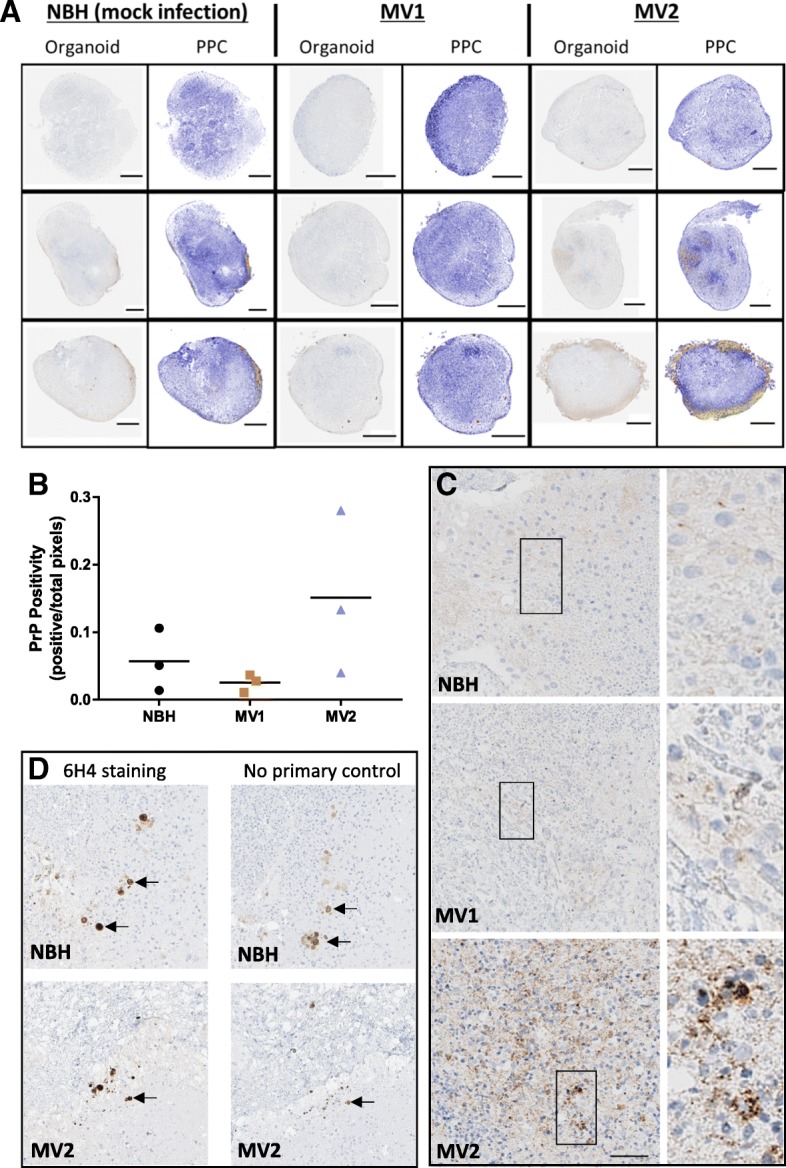
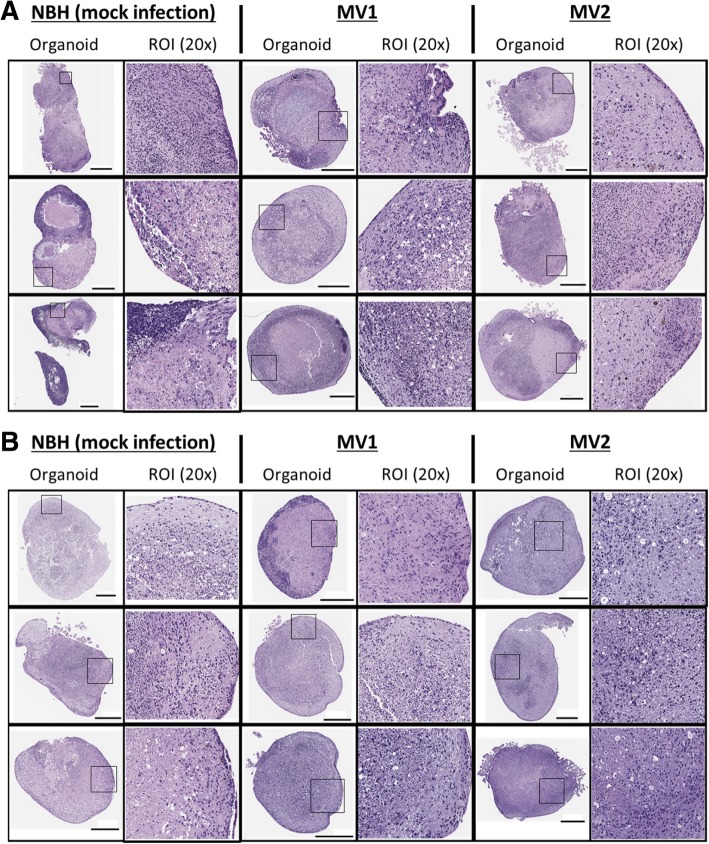
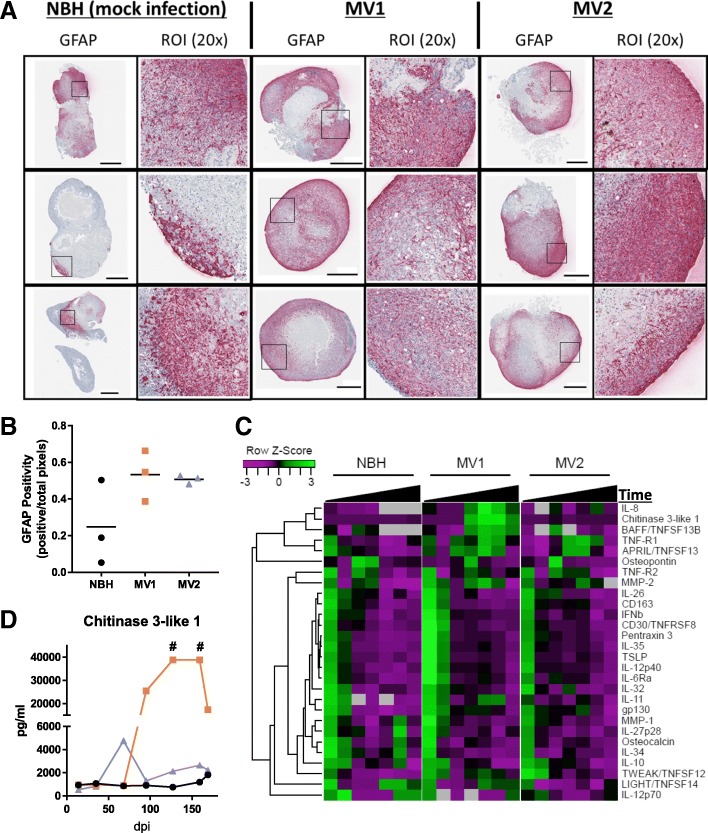
For the transmissible, neurogenerative family of prion diseases, few human models of infection exist and none represent structured neuronal tissue. Human cerebral organoids are self-organizing, three-dimensional brain tissues that can be grown from induced pluripotent stem cells. Organoids can model aspects of neurodegeneration in Alzheimer's Disease and Down's Syndrome, reproducing tau hyperphosphorylation and amyloid plaque pathology. To determine whether organoids could be used to reproduce human prion infection and pathogenesis, we inoculated organoids with two sporadic Creutzfeldt-Jakob Disease prion subtypes. Organoids showed uptake, followed by clearance, of the infectious inoculum. Subsequent re-emergence of prion self-seeding activity indicated de novo propagation. Organoid health assays, prion titer, prion protein electrophoretic mobility and immunohistochemistry demonstrated inoculum-specific differences. Our study shows, for the first time, that cerebral organoids can model aspects of human prion disease and thus offer a powerful system for investigating different human prion subtype pathologies and testing putative therapeutics.

Keywords: CJD; Human cerebral organoid; Induced pluripotent stem cells; Prion; RT-QuIC.


Conflict of interest statement

The authors declare that they have no competing interests.

Figures

Fig. 1
Fig. 1
Developmental and experimental schematic. a Example phase images show organoids at early stages of development, becoming more structured, and organoid appearance as balls of tissue in an Erlenmeyer culture flask. H&E staining at 28 days old (do) shows the complexity of the organoids with many varied, structured domains. Immunofluorescence at 140 do confirms cortical identity (FoxG1) and shows that astrocytes (GFAP) have begun populating the neuronal layers. Scale bars = 200 μm. b Schematic time line of organoid maturation, infection and sampling
Fig. 2
Fig. 2
Organoid health and viability monitoring. a Prestoblue fluorescence, indicating changes in metabolism, expressed relative to pre-inoculated organoid metabolism. The same three organoids were monitored weekly throughout. b LDH detection in organoid culture media, indicative of cell death or loss of membrane integrity, of the same 3 organoids as in A. Data points shown mean and SD of 3 replicate reads
Fig. 3
Fig. 3
RT-QuIC seeding and protease resistant PrP analysis. a Media RT-QuIC monitoring throughout the duration of infection showing the number of replicate wells positive for seeding activity at each sampling time. Each data point represents media taken from the well containing the same three organoids in Fig. 2. Minor tick marks on the x-axis show weekly full media exchanges. b Percentage of positive RT-QuIC test wells of organoids taken at various early time points during infection and when harvested at the conclusion on the experiment (169dpi). Each data point represents an individual organoid tested in RT-QuIC with 4–12 replicate wells. Bars show mean and standard deviation of all organoids in each indicated group. c RT-QuIC seeding activity of organoid homogenates diluted 10− 3 following harvest at 169 dpi. For clarity, every other datapoint was plotted. RT-QuIC traces are displayed as averages from all organoids in each group. Error bars represent standard deviation. d SD50 values of each organoid harvested at 169 dpi and the original inoculums. Each point represents an individual organoid (or inoculum) with black lines denoting the mean and colored bars the standard deviation. The dotted line represents the threshold of detection below which results are considered negative. e Western blots showing PrP and protease-resistant PrP in the original brain homogenate inocula (left plate) and the organoids harvested at 169 dpi (right plate)
Fig. 4
Fig. 4
Immunohistochemical staining for PrP in organoids harvested at 169 dpi. a Whole organoid images; left panels per condition show 6H4 PrP staining (brown) and right panels showing positive pixel counts (PPC), blue signifies low and yellow-orange denotes high pixel staining intensity. Scale bars = 500 μm. b PrP positive pixel counts. Each data point represents an individual organoid with the mean indicated as a line (Kruskal-Wallis, p = 0.132). c 6H4 PrP staining of organoid interiors. Scale bar = 50 μm and applies to left panels. Right panels are zoomed images of the boxed regions. d PrP staining artifacts visible in NBH and MV2 treated organoids. Left panels show 6H4 PrP staining and right panels show no-primary antibody control stains. Arrows indicate artifacts in sequential slices. Scale is as for C
Fig. 5
Fig. 5
H&E staining. Whole organoid and 20× magnification images of H&E stains at a 96 dpi and b 169 dpi. Regions magnified are high PrP intensity, high astrocyte intensity or both. Scale bar = 500 μm
Fig. 6
Fig. 6
Astrocyte changes during infection. a Whole organoid images at 96 dpi; left panels per condition show GFAP staining (pink) and right panels showing positive pixel counts (PPC), blue signifies low and yellow-orange denotes high pixel staining intensity. Scale bars = 500 μm. b GFAP positive pixel counts of the 96 dpi whole organoid images. Each data point represents an individual organoid with the mean indicated as a line (Kruskal-Wallis, p = 0.196). c Heatmap and dendrogram cluster analysis of cytokine detection in culture medium at 14, 35, 68, 95, 127, 159, 169 dpi. Black triangles showing increasing time from inoculation. Data points are generated using media pools from 6 individual organoids. Grey boxes indicate cytokine concentrations below the limits of detection. d Concentrations of Chitinase 3-like 1 in culture medium over time. # readings exceeded the accurate range of detection for the assay

Similar articles

Cited by

References

    1. Arellano-Anaya ZE, Huor A, Leblanc P, Lehmann S, Provansal M, Raposo G, Andreoletti O, Vilette D. Prion strains are differentially released through the exosomal pathway. Cellular and molecular life sciences. CMLS. 2015;72:1185–1196. doi: 10.1007/s00018-014-1735-8. - DOI - PMC - PubMed
    1. Babicki S, Arndt D, Marcu A, Liang Y, Grant JR, Maciejewski A, Wishart DS. Heatmapper: web-enabled heat mapping for all. Nucleic Acids Res. 2016;44:W147–W153. doi: 10.1093/nar/gkw419. - DOI - PMC - PubMed
    1. Bagley JA, Reumann D, Bian S, Levi-Strauss J, Knoblich JA. Fused cerebral organoids model interactions between brain regions. Nat Methods. 2017;14:743–751. doi: 10.1038/nmeth.4304. - DOI - PMC - PubMed
    1. Cali I, Castellani R, Yuan J, Al-Shekhlee A, Cohen ML, Xiao X, Moleres FJ, Parchi P, Zou WQ, Gambetti P. Classification of sporadic Creutzfeldt-Jakob disease revisited. Brain. 2006;129:2266–2277. doi: 10.1093/brain/awl224. - DOI - PubMed
    1. Carroll James, Chesebro Bruce. Neuroinflammation, Microglia, and Cell-Association during Prion Disease. Viruses. 2019;11(1):65. doi: 10.3390/v11010065. - DOI - PMC - PubMed

Publication types

MeSH terms

Supplementary concepts