. 2019 Aug 7;103(3):533-545.e5.
doi: 10.1016/j.neuron.2019.05.017. Epub 2019 Jun 10.

Subcortical Substrates of Explore-Exploit Decisions in Primates

Affiliations

Subcortical Substrates of Explore-Exploit Decisions in Primates

Vincent D Costa et al. Neuron. .

Abstract

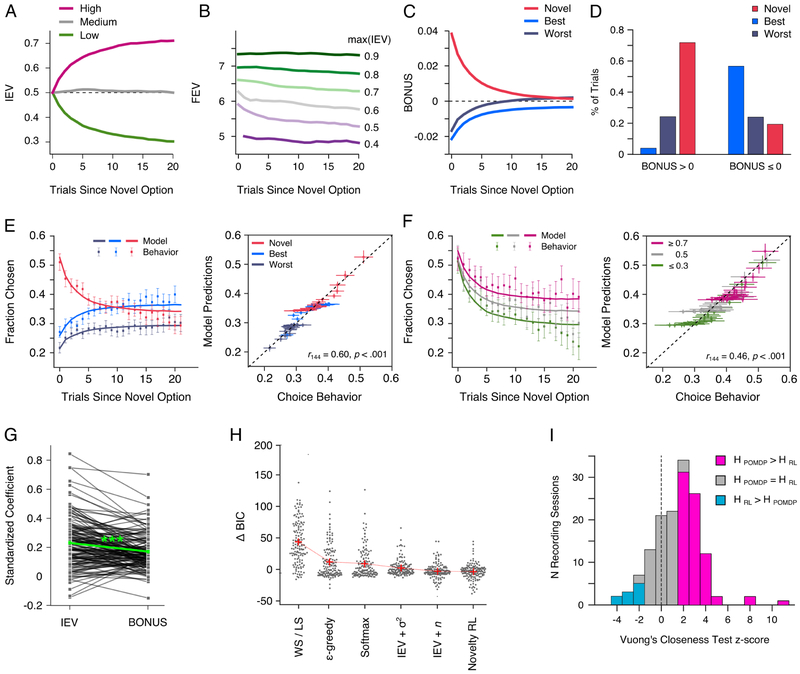
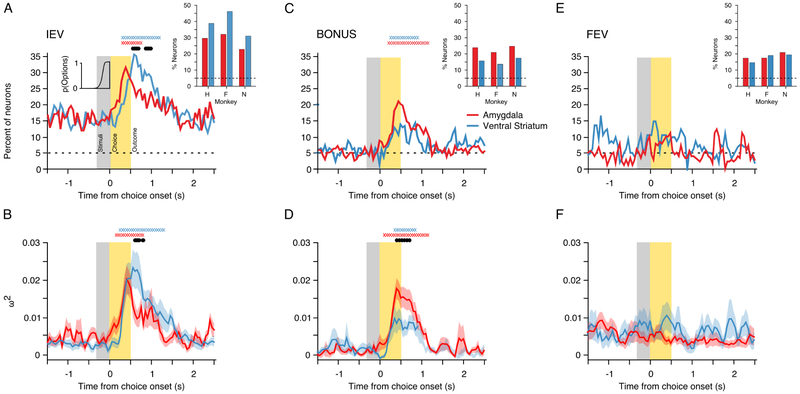
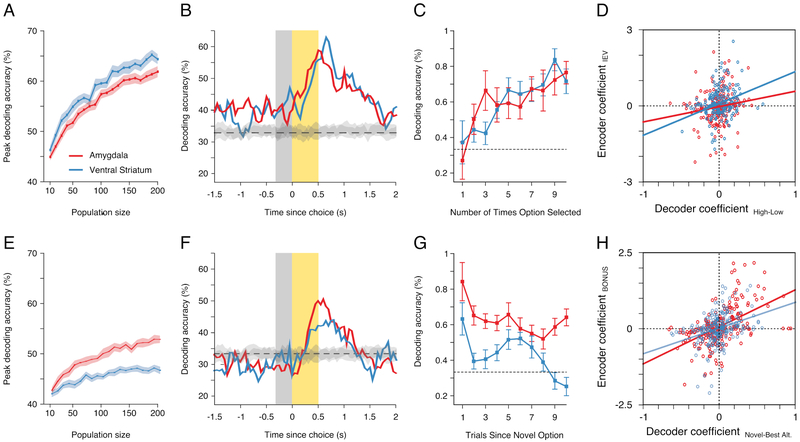
The explore-exploit dilemma refers to the challenge of deciding when to forego immediate rewards and explore new opportunities that could lead to greater rewards in the future. While motivational neural circuits facilitate learning based on past choices and outcomes, it is unclear whether they also support computations relevant for deciding when to explore. We recorded neural activity in the amygdala and ventral striatum of rhesus macaques as they solved a task that required them to balance novelty-driven exploration with exploitation of what they had already learned. Using a partially observable Markov decision process (POMDP) model to quantify explore-exploit trade-offs, we identified that the ventral striatum and amygdala differ in how they represent the immediate value of exploitative choices and the future value of exploratory choices. These findings show that subcortical motivational circuits are important in guiding explore-exploit decisions.


Conflict of interest statement

Declaration of Interests

The authors declare no competing interests.

Figures

Figure 1.
Figure 1.. Monkeys managed explore-exploit trade-offs
(A) Structure of an individual trial in the bandit task. (B) Each block of n trials, up to 650 trials, began with the presentation of 3 novel images. This set, s1, of visual choice options was repeatedly presented to the monkey for j trials. After a minimum of 10 and up to a maximum of 30 trials, one of the existing options was randomly replaced with a novel image. This formed a new of set options, s2, that were presented for j trials. The novel option in this set was randomly assigned its own reward probability from a symmetric distribution, {0.2, 0.5, 0.8}. This process of introducing a novel option was repeated up to 32 times within a block. (C) MRI guided reconstruction of recording locations in the amygdala (red) and ventral striatum (blue) projected onto views from a macaque brain atlas (Saleem and Logothetis, 2007). (D) Fraction of times the monkeys chose each option type in terms of the number of trials since the introduction of a novel option (E) The fraction of times the monkeys chose novel options based on their assigned value. (F) The fraction of times, across all trials, the monkeys chose each option type as a function of the empirical reward value of the best alternative option. (G) Choice RTs based on which option was chosen and the number of trials elapsed since a novel option was introduced.
Figure 2.
Figure 2.. Computational modeling of explore-exploit decisions using a POMDP
(A) Mean trial by trial changes in the IEV of novel options assigned different reward values (B) Mean trial by trial changes in the FEV, averaged across all three options, as a function of the maximum available IEV. (C) Mean trial by trial changes in the exploration BONUS for each option type (see Fig. S2 for detailed examples) (D) How often the monkeys chose each option type when the exploration BONUS was positive or negative in value. (E and F) The correlation between POMDP model predictions and actual choices based on the option type chosen, E, and the a priori reward probability assigned to each option, F. (G) Parameter estimates used to weight the IEV and exploration BONUS value of chosen and unchosen options in the fitted POMDP model (Table S1). (H) The difference in BIC between alternative choice models and the POMDP model (see STAR Methods and Table S1). (G) Histogram of the number of sessions in which the POMDP model (HPOMDP) better predicted monkeys’ choices than the RL model that incorporated a fixed novelty bonus (HRL).
Figure 3.
Figure 3.. Single cell examples of POMDP derived value encoding
(A) Spike density function and raster plot depicting the activity of a neuron in ventral striatum encoding the IEV of the chosen option. The amber line indicates choice onset and the amber dots indicate visual onset of the cues. (B) The left panel shows the mean activity of the neuron when the monkey chose novel options assigned different values. Mean responses were averaged over the epoch when the neuron showed significant IEV encoding (black bar in A) and based on a moving average of 3 trials. The right panel shows the corresponding mean IEV of each option derived from the POMDP model. (C) Spike density function and raster plot depicting the activity of a neuron in the amygdala encoding the FEV of the chosen option. (D) Trial to trial changes in the mean activity of the neuron during the baseline epoch when the neuron showed significant FEV encoding (black bar in C) and based on a moving average of three trials. The secondary axis shows the corresponding FEV of the chosen option. (E and F) Same as A and B, for a neuron in the amygdala that encoded the exploration BONUS for the chosen option.
Figure 4.
Figure 4.. Population encoding of POMDP derived value signals
(A) Percentage of task responsive neurons in each region that encoded the IEV of the chosen option. The inset histogram indicates the cumulative RT distribution, averaged across sessions. The inset bar plot indicates the percentage of neurons in each monkey that encoded the IEV of the chosen option, ± 250 ms from the trial outcome. (B) Mean effect size (ω2) in neurons that encoded the IEV of the chosen option in each region. (C and D) Same as A and B for encoding of the exploration BONUS for the chosen option. (E and D) Same as A and B for encoding of the FEV of the chosen option. If present, the X symbols at the top of each panel indicate for each region the time bins where encoding exceeded baseline, while the black symbols indicate a significant difference between the amygdala and ventral striatum (both FWE cluster corrected at p<.05).
Figure 5.
Figure 5.. Population encoding of stimulus identity and choice outcomes
(A) Percentage of task responsive neurons in each region that encoded the stimulus identity of the chosen option. Data were aligned to stimulus onset before analysis. The inset histogram indicates the choice RT distribution following stimulus presentation, averaged across sessions. (B) Mean effect size (ω2) for neurons that encoded the stimulus identity of the chosen option. (C and D) Same as A and B for encoding of the choice outcome on the current trial, except that the data were aligned to the trial outcome before analysis. (E and F) Same as C and D for encoding of the choice outcome that occurred on the previous trial. If present, the X symbols at the top of each panel indicate for each region the time bins where encoding exceeded baseline, while the filled black symbols indicate a significant difference between the amygdala and ventral striatum (both FWE cluster corrected at p<.05).
Figure 6.
Figure 6.. Exclusive and overlapped encoding of choice identity, value, and outcome.
(A and B) The percentage of task responsive neurons in the amygdala, A, and ventral striatum, B, that exclusively encoded the stimulus identity, IEV, or outcome of choices. (C and D) The percentage of task responsive neurons in each region that exhibited complete or partially overlapped encoding of the stimulus identity, IEV, and outcome of choices. The color of each line corresponds to the sets in the inset Venn diagrams.
Figure 7.
Figure 7.. Decoding of exploitative and exploratory choices
(A) Decoder accuracy in predicting the a priori assigned reward value of choices as function of pseudo-population size for each region. (B) For each region, the time course of mean decoding accuracy using a pseudo-population of 200 neurons. (C) Mean decoder performance (± 250 ms from the trial outcome) in predicting the a priori assigned reward value of choices, as a function of the number of times an option was selected. (D) For each region, the correlation between the decoder coefficients that discriminated selection of high versus low value options and the encoding coefficients that described learning related changes in IEV of the chosen option. (E and F) Same as A and B, when decoding whether the monkey had chosen the novel, best, or worst alternative option. (G) Mean decoder performance (± 250 ms from the trial outcome) in predicting the which option was chosen, as a function of the number of trials since a novel option was introduced. (H) For each region, the correlation between the decoder coefficients that discriminated selection of novel versus the best alternative options and the coefficient that described encoding of the exploration BONUS. In D and H, each point represents the coefficients for individual neurons.

Comment in

Similar articles

Cited by

References

    1. Addicott MA, Pearson JM, Sweitzer MM, Barack DL, and Platt ML (2017). A Primer on Foraging and the Explore/Exploit Trade-Off for Psychiatry Research. Neuropsychopharmacology 42, 1931–1939. - PMC - PubMed
    1. Amir A, Lee SC, Headley DB, Herzallah MM, and Pare D (2015). Amygdala Signaling during Foraging in a Hazardous Environment. J Neurosci 35, 12994–13005. - PMC - PubMed
    1. Apicella P (2017). The role of the intrinsic cholinergic system of the striatum: What have we learned from TAN recordings in behaving animals? Neuroscience 360, 81–94. - PubMed
    1. Asaad WF, and Eskandar EN (2008). Achieving behavioral control with millisecond resolution in a high-level programming environment. J Neurosci Methods 173, 235–240. - PMC - PubMed
    1. Aston-Jones G, and Cohen JD (2005). An integrative theory of locus coeruleus-norepinephrine function: adaptive gain and optimal performance. Annu Rev Neurosci 28, 403–450. - PubMed

Publication types

LinkOut - more resources