. 2019 Aug 1;33(15-16):1031-1047.
doi: 10.1101/gad.327494.119. Epub 2019 Jun 13.

Protein aggregation mediates stoichiometry of protein complexes in aneuploid cells

Affiliations

Protein aggregation mediates stoichiometry of protein complexes in aneuploid cells

Christopher M Brennan et al. Genes Dev. .

Abstract

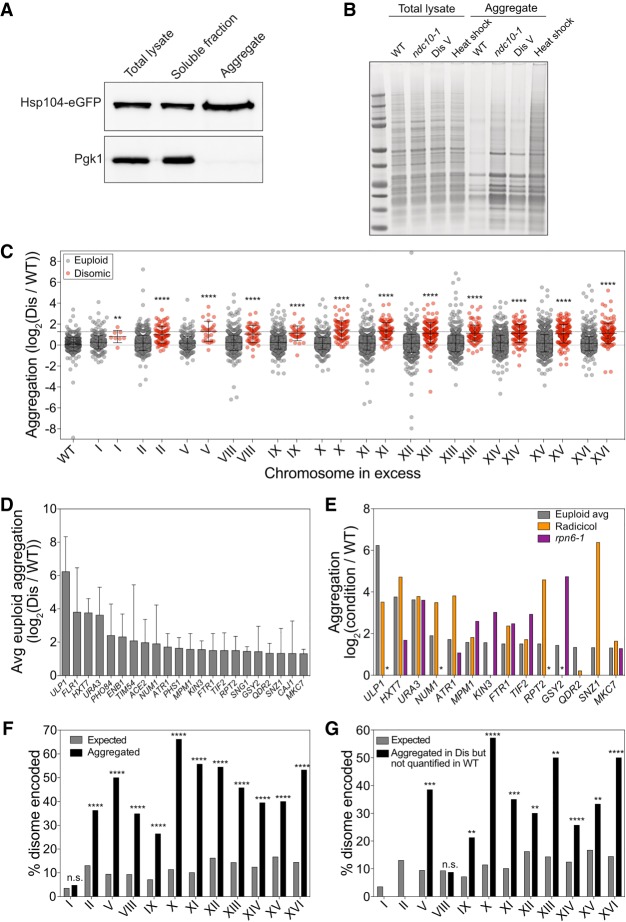
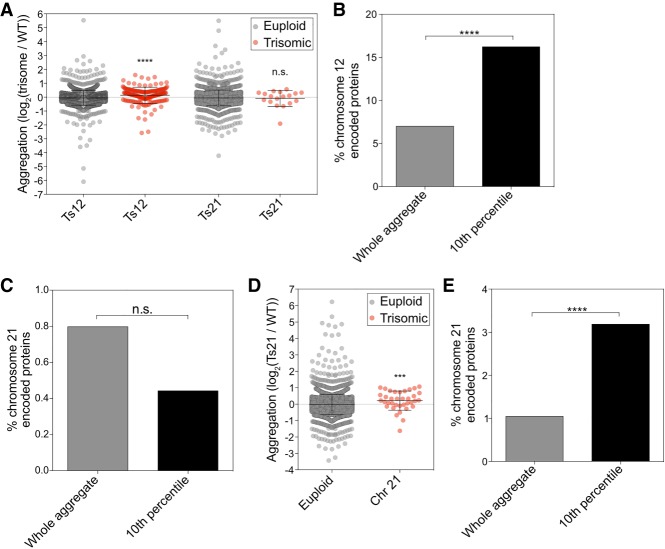
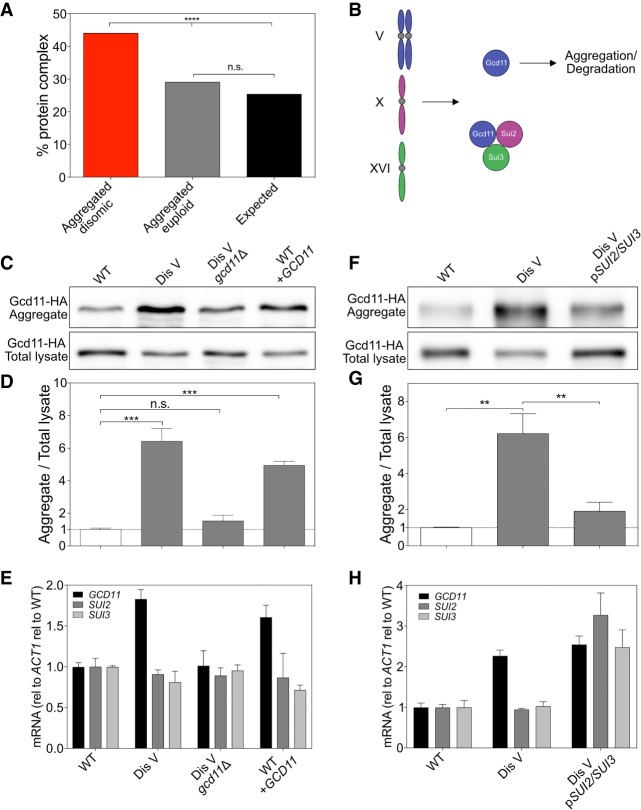
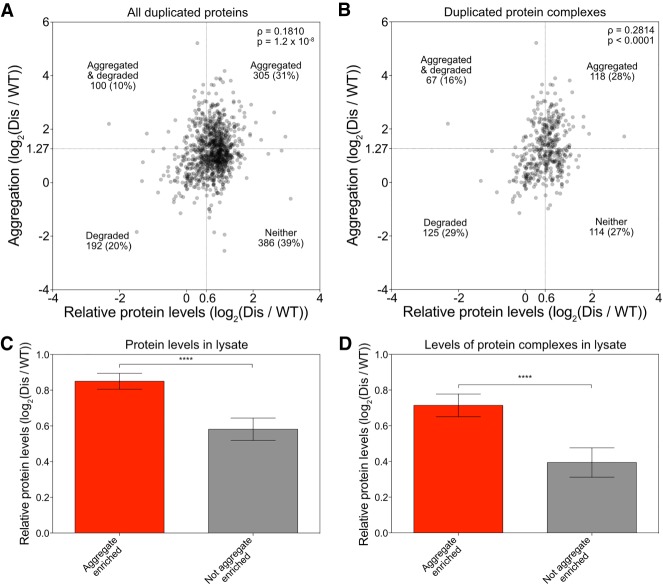
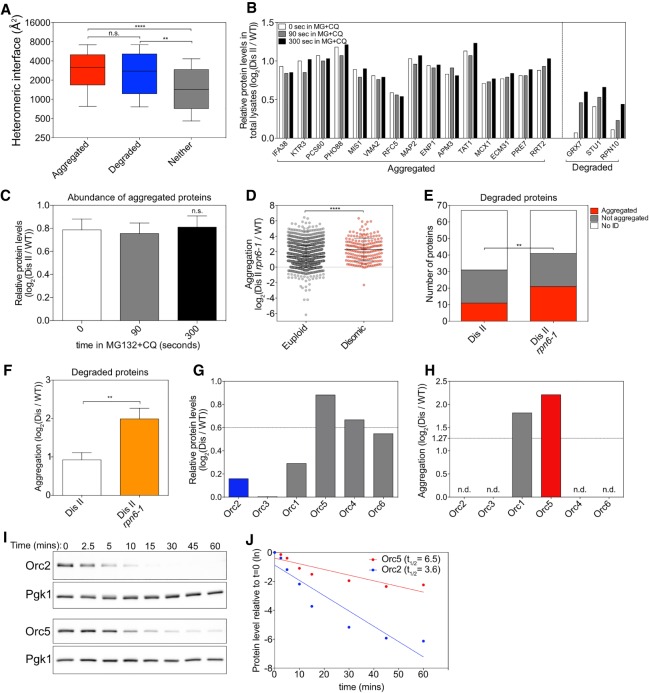
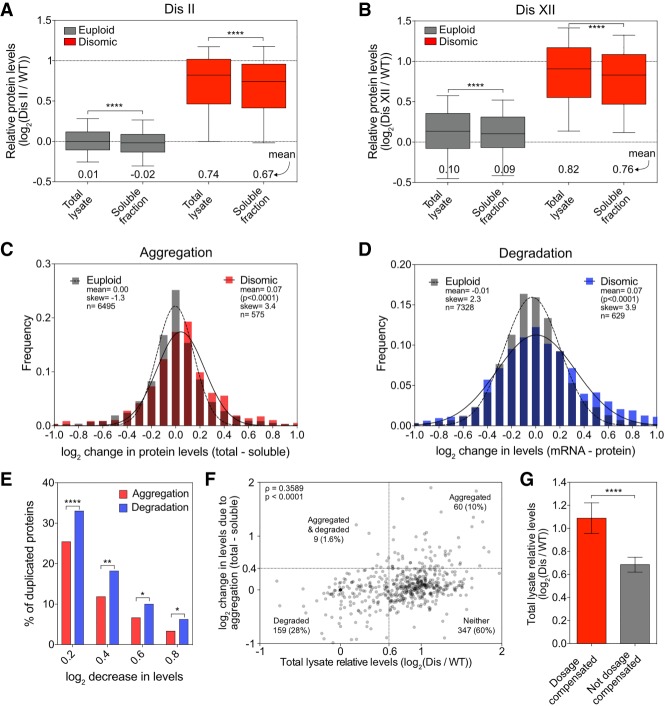
Aneuploidy, a condition characterized by chromosome gains and losses, causes reduced fitness and numerous cellular stresses, including increased protein aggregation. Here, we identify protein complex stoichiometry imbalances as a major cause of protein aggregation in aneuploid cells. Subunits of protein complexes encoded on excess chromosomes aggregate in aneuploid cells, which is suppressed when expression of other subunits is coordinately altered. We further show that excess subunits are either degraded or aggregate and that protein aggregation is nearly as effective as protein degradation at lowering levels of excess proteins. Our study explains why proteotoxic stress is a universal feature of the aneuploid state and reveals protein aggregation as a form of dosage compensation to cope with disproportionate expression of protein complex subunits.

Keywords: aneuploidy; protein aggregation; protein homeostasis.


Figures

Figure 1.
Figure 1.
Identification of proteins that aggregate in aneuploid yeast cells. (A) Total lysate, aggregates, and soluble fractions obtained from exponentially growing cells expressing Hsp104-eGFP (A31392) were analyzed for Hsp104 and Pgk1 abundance. (B) Protein aggregates and total lysates were prepared from euploid cells (wild type [WT], A35797), ndc10-1 cells (ndc10-1, A13413) grown for 4 h at 30°C, disome V cells (disome [Dis] V, A28265), and euploid cells (A2587) after an 8-min heat shock at 42°C (heat shock). Total lysates and aggregate fractions were subjected to SDS-PAGE and stained with Coomassie. (C) WT and disome cells were grown to exponential phase in synthetic complete (SC) medium containing heavy lysine and light lysine, respectively. Aggregated proteins are separated into two dot plots, with red dots indicating proteins encoded on the duplicated chromosome and gray dots indicating proteins encoded on euploid chromosomes. The first column represents aggregates purified from a mixed sample of heavy lysine-labeled WT and light lysine-labeled WT. Lines represent mean and standard deviation (SD). The top dashed line at log2 1.27 shows the cutoff used to define aggregating proteins. (**) P < 0.01; (****) P < 0.0001, Mann-Whitney test. (D) The average (Avg) aggregate enrichment of proteins encoded on euploid chromosomes that were identified in aggregates of at least three out of 12 disomes. Only proteins with an average enrichment of ≥log2 1.27 as measured in C are shown. Error bars indicate SD. (E) The enrichment of proteins from D was compared with their enrichment in aggregates purified from cells treated with radicicol (orange) or cells harboring the rpn6-1 allele (purple) from Supplemental Figure S4. An asterisk indicates proteins that were not quantified in either the radicicol or rpn6-1 experiments because they did not pass the detection threshold in aggregates purified from the reference strain but were readily detected in aggregates isolated from radicicol-treated or rpn6-1 cells. (F) The percentage of proteins encoded by the duplicated chromosome that were enriched at a level greater than the aggregation threshold of log2 1.27 (black bars) and the percentage of proteins encoded by the duplicated chromosome as a fraction of the whole proteome (gray bars). (n.s.) Not significant; (****) P < 0.0001, cumulative distribution function for a hypergeometric distribution. (G) The percentage of proteins encoded by the duplicated chromosome that were not quantified by stable isotope labeling by amino acids in cell culture (SILAC) mass spectrometry (MS) because the heavy-labeled (WT) peptides did not pass the detection threshold (black bars) and the percentage of proteins encoded by the duplicated chromosome as a fraction of the whole proteome (gray bars). (n.s.) Not significant; (**) P < 0.01; (***) P < 0.001; (****) P < 0.0001, cumulative distribution function for a hypergeometric distribution.
Figure 2.
Figure 2.
Aggregate analysis in trisomic human cells. (A) RPE-1 cells and RPE-1 cells trisomic for either chromosome 12 or chromosome 21 were cultured in medium containing heavy lysine or light lysine, respectively, for 10 generations. Within each experiment, euploid-encoded proteins (gray dots) were plotted separately from trisome-encoded proteins (red dots). (****) P < 0.0001; (n.s.) not significant, Mann-Whitney test. (B,C) Enrichment of chromosome 12-encoded (B) and chromosome 21-encoded (C) proteins in total aggregates (gray bars) and among the top 10% most highly enriched aggregated proteins (black bars). (n.s.) Not significant; (****) P < 0.0001, cumulative distribution function for a hypergeometric distribution. (D) Euploid and trisomy 21 cells were treated with 25 nM chloroquine and 1 µM MG-132, and aggregates were plotted as in A. (***) P < 0.001, Mann-Whitney test. (E) Enrichment of chromosome 21-encoded proteins in total aggregates (gray bar) and among the top 10% most highly enriched aggregated proteins (black bar). (****) P < 0.0001, cumulative distribution function for a hypergeometric distribution. (Ts) Trisome; (Chr) chromosome.
Figure 3.
Figure 3.
Stoichiometric imbalances of protein complex subunits cause protein aggregation. (A) The percentage of proteins encoded by duplicated chromosomes enriched by log2 ≥1.27 in aggregates (red), the percentage of proteins encoded by euploid chromosomes enriched by log2 ≥1.27 in aggregates (gray), and the percentage of proteins in the genome (black) that are annotated to form protein complexes by Pu et al. (2009) were calculated. (****) P < 0.0001; (n.s.) not significant, cumulative distribution function for a binomial distribution. (B) Diagram of eIF2 complex stoichiometry in disome V cells. (C) Gcd11-HA in aggregates and total lysates in WT (A40189), disome V (A40190), disome V GCD11-HA/gcd11Δ (A40191), and WT URA3::GCD11-HA (WT + GCD11; A40192) cells. Only one of the two GCD11 genes in disome V cells was tagged with HA to ensure that protein levels are comparable between strains. (D) Quantification of Western blots in C. n = 3; SD. (***) P < 0.001, t-test. (E) Cells were grown as in C, and mRNA levels for eIF2 subunits were determined. Values were normalized to ACT1 and then to WT expression levels. n = 3; SD. (FH) Western blot, relative aggregation quantification, and mRNA expression for WT (A40193), disome V (A40194), and disome V pSUI2/SUI3 (A40195) cells as described in CE. n = 3; SD. (**) P < 0.01, t-test. (Dis) Disome; (rel) relative.
Figure 4.
Figure 4.
Excess proteins are either aggregated or degraded. (A,B) Correlation between enrichment in protein aggregates (measured in Fig. 1C) and relative protein levels (measured in disome lysates by Dephoure et al. 2014) was determined for all proteins encoded by the duplicated chromosome quantified in both data sets (A) and duplicated subunits of protein complexes (B). Spearman correlation of 0.1810 (P = 1.2 × 10⁻⁸) in A and 0.2814 (P < 0.0001) in B. Dashed lines indicate thresholds for proteins that are considered aggregated (Y-axes) or degraded (X-axes). The number of proteins that fall into each quadrant is indicated. (C,D) All duplicated proteins (C) and duplicated complex subunits (D) were separated into two bins: (1) aggregated proteins (red bars), which were defined as proteins with an enrichment of at least log2 1.27 in disomic aggregates, and (2) nonaggregated proteins (gray bars), which were defined as proteins with an enrichment of log2 ≤0.727. Average relative levels in disome lysates as measured by Dephoure et al. (2014) are plotted. Error bars represent 95% confidence intervals. (****) P < 0.0001, Mann-Whitney test. (Dis) Disome.
Figure 5.
Figure 5.
Protein half-life determines whether a protein aggregates or is degraded. (A) Proteins encoded on duplicated chromosomes were separated into three categories: aggregated, degraded, and neither. Aggregated proteins (red) and degraded proteins (blue) were defined as in Figure 4A. Proteins that were identified in our analysis and that by Dephoure et al. (2014) but did not pass the threshold for aggregation or degradation were considered neither aggregated nor degraded (gray). The heteromeric interface sizes of the proteins in each category are plotted as box plots, with whiskers representing the 10th–90th percentile. (****) P < 0.0001; (**) P < 0.01; (n.s.) not significant, Mann-Whitney test. (B) The change in levels of proteins encoded on chromosome II in disome II in total lysates of cells treated with 100 µM MG-132 (MG) and 10 mM chloroquine (CQ) relative to WT (data from Dephoure et al. 2014). Examples of aggregating proteins as determined in Figure 1C and of degraded proteins as determined by Dephoure et al. (2014) are shown. White bars indicate relative levels immediately before the addition of MG-132 and chloroquine, and gray bars and black bars indicate relative levels 90 and 300 sec thereafter, respectively. (C) Mean levels of all aggregating proteins as measured in B at each time point. Error bars indicate SEM. (n.s.) Not significant, Wilcoxon matched-pairs signed rank test. (D) Disome II rpn6-1 (A40196) or WT (A23504) cells were grown to exponential phase at 30°C in SC medium containing light lysine and heavy lysine, respectively, and aggregating proteins were identified. Lines indicate mean and SD. (****) P < 0.0001, Mann-Whitney test. (E) Proteins considered degraded when duplicated by Dephoure et al. (2014) were examined in aggregates purified from disome II cells (shown in Fig. 1C) and disome II rpn6-1 cells (shown in D). A protein was considered to aggregate when it was enriched by more than log2 1.27 in aggregates (red) and not aggregated when enriched by less than log2 1.27 (gray). “No ID” indicates proteins that were not identified in aggregates (white). (**) P < 0.01, cumulative distribution function for a binomial distribution. (F) Degree of aggregation was determined for all proteins in E in disome II aggregates and disome II rpn6-1 aggregates. Bars represent SD. (**) P < 0.01, Mann-Whitney test. (G,H) Relative protein levels as determined by Dephoure et al. (2014) (G) and relative aggregation as measured in Figure 1C (H) for origin recognition complex (ORC) subunits when encoded by disomic chromosomes. (n.d.) Not detected in aggregates. (I,J) Cells were grown to exponential phase at 30°C in YEP medium containing 2% raffinose. Expression of HA-tagged ORC2 (A40197) and ORC5 (A40198) was induced with 2% galactose for 20 min. Next, protein synthesis was halted by the addition of 2% glucose and 0.5 mg/mL cycloheximide (t = 0). Protein levels were determined. Pgk1 was used as a loading control (I). Protein levels were quantified relative to the loading control and normalized to the 0-min time point (J). (Dis) Disome; (ln) natural logarithm.
Figure 6.
Figure 6.
Dosage compensation by protein aggregation. (A,B) Total lysate and soluble fractions, obtained as described in Figure 1A, were analyzed for disome II (A) and disome XII (B). Proteins encoded by euploid chromosomes (gray) and proteins encoded by the duplicated chromosome (red). Data are represented as box plots, with whiskers extending to 10th and 90th percentiles. Means are indicated below. The top dashed line represents the theoretical mean for proteins encoded by the duplicated chromosome. (****) P < 0.0001, Mann-Whitney test. (C) Changes in protein levels due to aggregation for proteins quantified in A and B were calculated for every protein by subtracting its log2 ratio in the soluble fraction from its log2 ratio in the total lysate. Disome II and disome XII data were pooled and separated into two subsets: euploid chromosome-encoded proteins (gray) and disomic chromosome-encoded proteins (red). Frequency distributions of each subset were then generated using a bin size of 0.1. Distributions were fit to Gaussian curves for euploid (dashed line) and disome (solid line). P-value shows that mean change of disome-encoded proteins is significantly different from the mean change of euploid-encoded proteins (Mann-Whitney test). (D) Changes in protein levels due to degradation for disome II and disome XII were calculated by subtracting the relative protein level from the relative mRNA level for each gene as measured by Dephoure et al. (2014). Frequency distributions were generated, and curve fitting was performed on the pooled data as in C. P-value shows that mean change of disome-encoded proteins is significantly different from the mean change of euploid-encoded proteins (Mann-Whitney test). (E) The percentage of proteins encoded by the duplicated chromosome that decreased in levels by at least a log2 of 0.2, 0.4, 0.6, and 0.8 due to aggregation (red bars) was calculated using the data described in C, and the percentage of those that decreased due to degradation (blue bars) was calculated using the data in D. (****) P < 0.0001; (**) P < 0.01; (*) P < 0.05, χ2 test. (F) The correlation between protein levels in total lysate and reduction in levels due to aggregation was determined for proteins encoded on duplicated chromosomes from the pooled data set of disome II (A) and disome XII (B). Spearman correlation of 0.3589 (P < 0.0001). Dashed lines indicate thresholds for proteins being considered dosage-compensated by aggregation (Y-axes) or degradation (X-axes). The number of proteins that fall into each quadrant is indicated (note that 19 data points fell outside the range of the axes but were included in the calculations). (G) Proteins encoded on duplicated chromosomes were separated into two categories: Dosage-compensated proteins (red) were defined as their levels being reduced by at least log2 0.4 in the soluble fraction relative to the total lysate. “Not dosage-compensated” proteins (gray) were defined as their levels being reduced by less than log2 0.4. Mean levels in total lysates are plotted; error bars indicate 95% confidence intervals. (****) P < 0.0001, Mann-Whitney test. (Dis) Disome.

Comment in

Similar articles

Cited by

References

    1. Banani SF, Lee HO, Hyman AA, Rosen MK. 2017. Biomolecular condensates: organizers of cellular biochemistry. Nat Rev Mol Cell Biol 18: 285–298. 10.1038/nrm.2017.7 - DOI - PMC - PubMed
    1. Bell SP, Kobayashi R, Stillman B. 1993. Yeast origin recognition complex functions in transcription silencing and DNA replication. Science 262: 1844–1849. 10.1126/science.8266072 - DOI - PubMed
    1. Caughey B, Lansbury PT. 2003. Protofibrils, pores, fibrils, and neurodegeneration: separating the responsible protein aggregates from the innocent bystanders. Annu Rev Neurosci 26: 267–298. 10.1146/annurev.neuro.26.010302.081142 - DOI - PubMed
    1. David DC, Ollikainen N, Trinidad JC, Cary MP, Burlingame AL, Kenyon C. 2010. Widespread protein aggregation as an inherent part of aging in C. elegans. PLoS Biol 8: e1000450 10.1371/journal.pbio.1000450 - DOI - PMC - PubMed
    1. Dephoure N, Hwang S, O'Sullivan C, Dodgson SE, Gygi SP, Amon A, Torres EM. 2014. Quantitative proteomic analysis reveals posttranslational responses to aneuploidy in yeast. Elife 3: e03023 10.7554/eLife.03023 - DOI - PMC - PubMed

Publication types

MeSH terms