. 2019 Aug 14;39(33):6513-6525.
doi: 10.1523/JNEUROSCI.1714-18.2019. Epub 2019 Jun 13.

The Ventral Visual Pathway Represents Animal Appearance over Animacy, Unlike Human Behavior and Deep Neural Networks

Affiliations

The Ventral Visual Pathway Represents Animal Appearance over Animacy, Unlike Human Behavior and Deep Neural Networks

Stefania Bracci et al. J Neurosci. .

Abstract

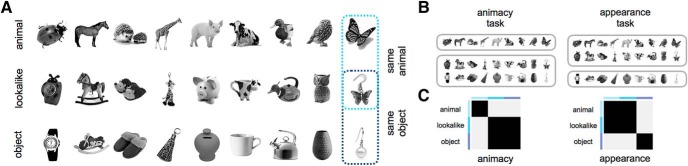
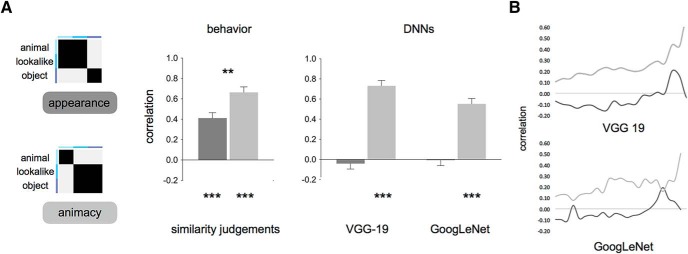
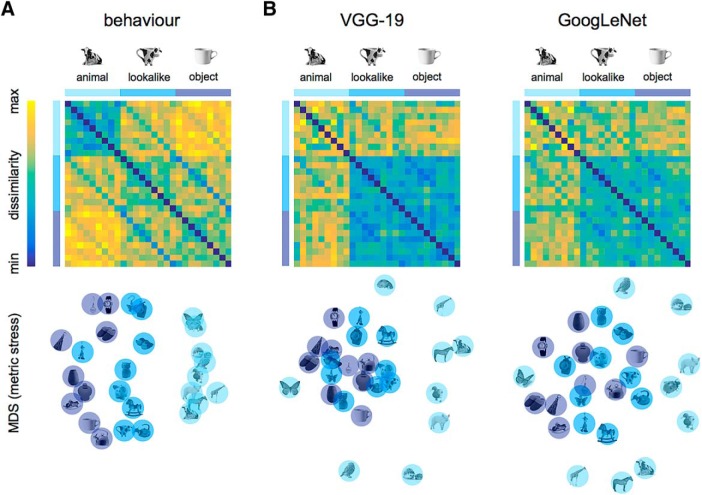
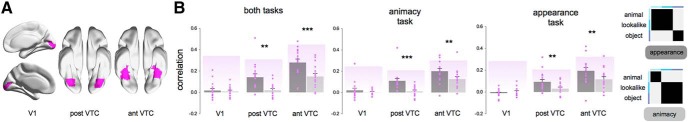
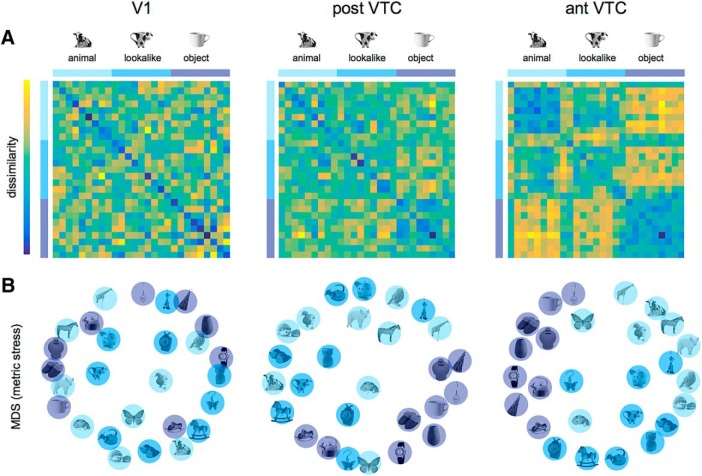
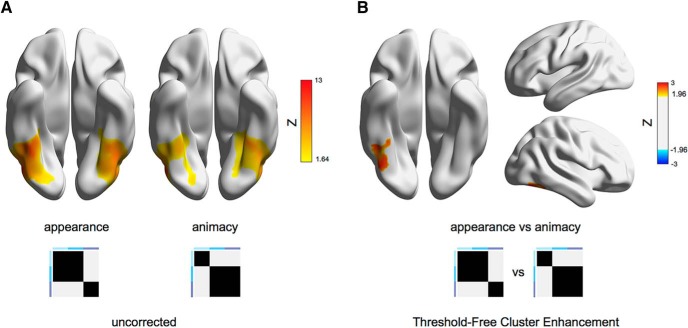
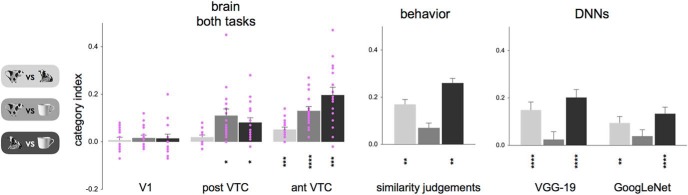
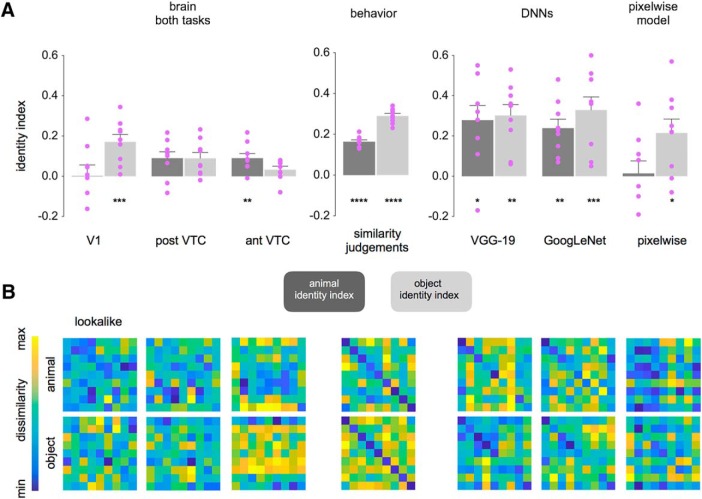
Recent studies showed agreement between how the human brain and neural networks represent objects, suggesting that we might start to understand the underlying computations. However, we know that the human brain is prone to biases at many perceptual and cognitive levels, often shaped by learning history and evolutionary constraints. Here, we explore one such perceptual phenomenon, perceiving animacy, and use the performance of neural networks as a benchmark. We performed an fMRI study that dissociated object appearance (what an object looks like) from object category (animate or inanimate) by constructing a stimulus set that includes animate objects (e.g., a cow), typical inanimate objects (e.g., a mug), and, crucially, inanimate objects that look like the animate objects (e.g., a cow mug). Behavioral judgments and deep neural networks categorized images mainly by animacy, setting all objects (lookalike and inanimate) apart from the animate ones. In contrast, activity patterns in ventral occipitotemporal cortex (VTC) were better explained by object appearance: animals and lookalikes were similarly represented and separated from the inanimate objects. Furthermore, the appearance of an object interfered with proper object identification, such as failing to signal that a cow mug is a mug. The preference in VTC to represent a lookalike as animate was even present when participants performed a task requiring them to report the lookalikes as inanimate. In conclusion, VTC representations, in contrast to neural networks, fail to represent objects when visual appearance is dissociated from animacy, probably due to a preferred processing of visual features typical of animate objects.SIGNIFICANCE STATEMENT How does the brain represent objects that we perceive around us? Recent advances in artificial intelligence have suggested that object categorization and its neural correlates have now been approximated by neural networks. Here, we show that neural networks can predict animacy according to human behavior but do not explain visual cortex representations. In ventral occipitotemporal cortex, neural activity patterns were strongly biased toward object appearance, to the extent that objects with visual features resembling animals were represented closely to real animals and separated from other objects from the same category. This organization that privileges animals and their features over objects might be the result of learning history and evolutionary constraints.

Keywords: MVPA; animacy; deep neural networks; fMRI; object representations; occipitotemporal cortex.


Figures

Figure 1.
Figure 1.
Experimental design. A, The stimulus set was specifically designed to dissociate object appearance from object identity. We included nine different object triads. Each triad included an animal (e.g., butterfly), an inanimate object (e.g., earring), and a lookalike object closely matched to the inanimate object in terms of object identity and to the living animal in terms of object appearance (e.g., a butterfly-shaped earring). B, During fMRI acquisition, participants performed two different tasks counterbalanced across runs. During the animacy task, participants judged animacy: “does this image depict a living animal?” During the animal appearance task, participants judged animal resemblance: “does this image look like an animal?” Participants responded “yes” or “no” with the index and middle finger. Responses were counterbalanced across runs. C, Model predictions represent the required response similarity in the two tasks. The animacy model predicts high similarity among images that share semantic living/animate properties, thus predicting all inanimate objects (objects and lookalikes) to cluster together and separately from living animals. Conversely, the animal appearance model predicts similarities based on visual appearance despite differences in object identity and animacy, thus predicting lookalikes and animals to cluster together and separately from inanimate objects. The two models are independent (r = 0.07).
Figure 2.
Figure 2.
DNNs predict human perception of object animacy but not appearance. A, RSA (Kriegeskorte et al., 2008a) results for the appearance model (dark gray) and the animacy model (light gray) are shown for human judgments (left), and DNNs (right). Asterisks indicate significant values computed with permutation tests (10,000 randomizations of stimulus labels) and error bars indicate SE computed by bootstrap resampling of the stimuli. ***p < 0.0001, **p < 0.001. B, RSA results for the two models are shown for DNNs' individual layers.
Figure 3.
Figure 3.
DNNs and human perception predict a representation based on object animacy, over appearance. A, B, Dissimilarities matrices (top) and 2D arrangements derived from MDS (metric stress; bottom) showing stimuli pairwise distances for behavioral judgments (A) and DNNs (B). Light blue, Animals; blue, lookalikes; dark blue, objects.
Figure 4.
Figure 4.
Animal appearance better explains representational content in human visual cortex. A, Group-averaged ROIs (V1, post-VTC, ant-VTC) are shown on an inflated human brain template in BrainNet Viewer (Xia et al., 2013). B, RSA (Kriegeskorte et al., 2008a) results for the appearance model (dark gray) and the animacy model (light gray) are shown for the data combined across the two tasks and for each task separately. Individual participant's (n = 16) correlation values are shown in purple. Purple-shaded backgrounds represent reliability values of the correlational patterns taking into account the noise in the data (Materials and Methods). These values give an estimate of the highest correlation that we can expect in each ROI. Error bars indicate SEM. Asterisks indicate significant difference between the two models (***p < 0.001; **p < 0.01).
Figure 5.
Figure 5.
Neural similarity space in VTC reflects animal appearance. A, Neural dissimilarity matrices (1 − Person's r) derived from the neural data (averaged across subjects and tasks) showing pairwise dissimilarities among stimuli in the three ROIs. B, The MDS (metric stress), performed on the dissimilarity matrices averaged across subjects and tasks, shows pairwise distances in a 2D space for the three ROIs. Light blue, Animals; blue, lookalikes; dark blue, objects.
Figure 6.
Figure 6.
Whole-brain RSA. Shown are the results of random-effects whole-brain RSA for (A) individual models (uncorrected) and (B) the direct contrast between the two predictive models (appearance vs animacy) corrected with the TFCE (Smith and Nichols, 2009) method are displayed on a brain template by means of BrainNet Viewer (Xia et al., 2013).
Figure 7.
Figure 7.
VTC representations differ in category discriminability from DNNs and human behavior. The category index reflects representational discriminability among the three stimulus categories (animals, lookalikes, and objects) and is computed for each condition pair by subtracting the average of between-condition correlations (e.g., for animals and lookalikes), from the average of within-condition correlations (e.g., for animals and lookalikes). Results are reported for neural data (left), behavior (middle), and DNNs (right). Light gray, Animals versus lookalikes; gray, lookalikes versus objects; dark gray, animals versus objects. For neural data, individual participant's (n = 16) data points are shown in purple. Asterisks indicate significant values relative to baseline and error bars indicate SEM. For behavioral and DNNs data, asterisks indicate significant values relative to baseline computed with permutation tests (10,000 randomizations of stimulus labels) and error bars indicate SE computed by bootstrap resampling of the stimuli. ****p < 0.00001, *** < p < 0.0001, ** < p < 0.001, * < p < 0.01.
Figure 8.
Figure 8.
VTC representations sustain animal identity, but not object identity, categorization. A, The identity index reflects information for individual object ad animal pairs (e.g., the cow mug and the mug represent the same object; the cow mug and the cow represent the same animal) and is computed separately for each condition (animals and objects). For each lookalike object (n = 9), we took the on-diagonal correlation (e.g., between the cow mug and the mug) and subtracted the average off-diagonal correlations (e.g., between the cow mug and the remaining objects). The identity index for animals and objects was computed for the brain data (V1, post-VTC, and ant-VTC), behavioral data (similarity judgments), DNNs (VGG-19, GoogLeNet), and the image pixelwise data. Light gray, Animal identity index; dark gray, object identity index. Asterisks (****p < 0.00001, *** < p < 0.0001, ** < p < 0.001, *p < 0.01) indicate significant values relative to baseline and error bars indicate SEM. B, For each dataset, dissimilarity matrices used to compute the identity index are shown separately for animals and objects.
Figure 9.
Figure 9.
Classification analysis. Shown are decoding results for category discriminability (A; leave-one-run-out) and its generalization across triads (B; leave-one-triad-out) for animals, lookalikes, and objects in the three ROIs. The red line shows chance level. The confusion matrix (bottom) shows classification errors between conditions. The color scale from white (low) to blue (high) indicates classification predictions. C, Stimulus identity classification within- (top) and between-conditions (bottom). D, Summary representational geometry in ant-VTC based on results from classification analyses. Gray underlays indicate clusters derived from results shown in A. Shorter distance between the clusters (animals and lookalikes) indicates higher confusability derived from analysis on the confusion matrix. Within-condition stimulus identity discriminability (C, top) is shown with red dotted lines. Stimulus identity generalization across conditions (C, bottom) is shown with light blue (lookalikes and animals) and dark blue (lookalikes and objects) solid lines. Significant and nonsignificant generalization of stimulus identity across conditions is show with “<” and “ns,” respectively. Individual participant's (n = 16) data points are shown in purple. Error bars indicate SEM. Asterisks (***p < 0.001, ** < p < 0.01, * < p < 0.05) indicate significant values relative to chance level.

Similar articles

Cited by

References

    1. Baldassi C, Alemi-Neissi A, Pagan M, Dicarlo JJ, Zecchina R, Zoccolan D (2013) Shape similarity, better than semantic membership, accounts for the structure of visual object representations in a population of monkey inferotemporal neurons. PLoS Comput Biol 9:e1003167. 10.1371/journal.pcbi.1003167 - DOI - PMC - PubMed
    1. Bracci S, Op de Beeck H (2016) Dissociations and associations between shape and category representations in the two visual pathways. J Neurosci 36:432–444. 10.1523/JNEUROSCI.2314-15.2016 - DOI - PMC - PubMed
    1. Bracci S, Daniels N, Op de Beeck H (2017a) Task context overrules object- and category-related representational content in the human parietal cortex. Cereb Cortex 27:310–321. 10.1093/cercor/bhw419 - DOI - PMC - PubMed
    1. Bracci S, Ritchie JB, de Beeck HO (2017b) On the partnership between neural representations of object categories and visual features in the ventral visual pathway. Neuropsychologia 105:153–164. 10.1016/j.neuropsychologia.2017.06.010 - DOI - PMC - PubMed
    1. Brainard DH. (1997) The psychophysics toolbox. Spat Vis 10:433–436. 10.1163/156856897X00357 - DOI - PubMed

Publication types