. 2019 Jul 1;218(7):2247-2264.
doi: 10.1083/jcb.201811131. Epub 2019 Jun 13.

The exocyst controls lysosome secretion and antigen extraction at the immune synapse of B cells

Affiliations

The exocyst controls lysosome secretion and antigen extraction at the immune synapse of B cells

Juan José Sáez et al. J Cell Biol. .

Abstract

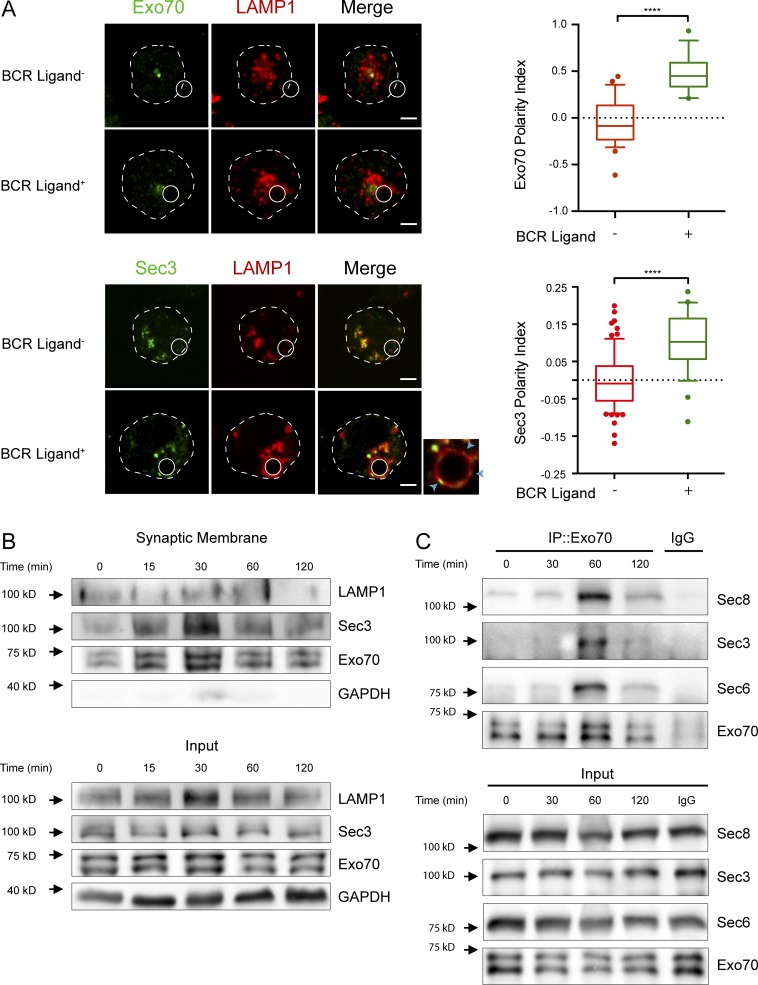
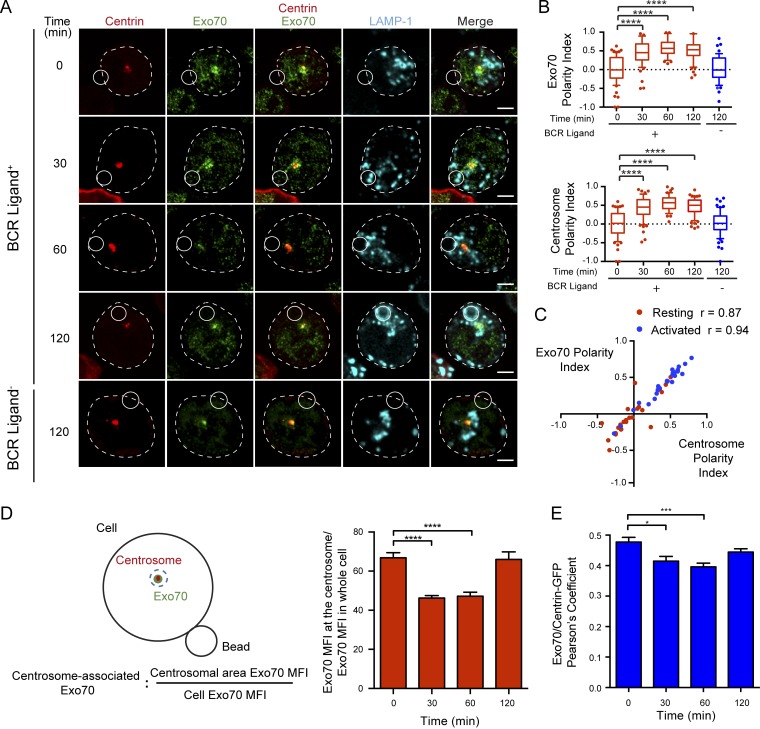
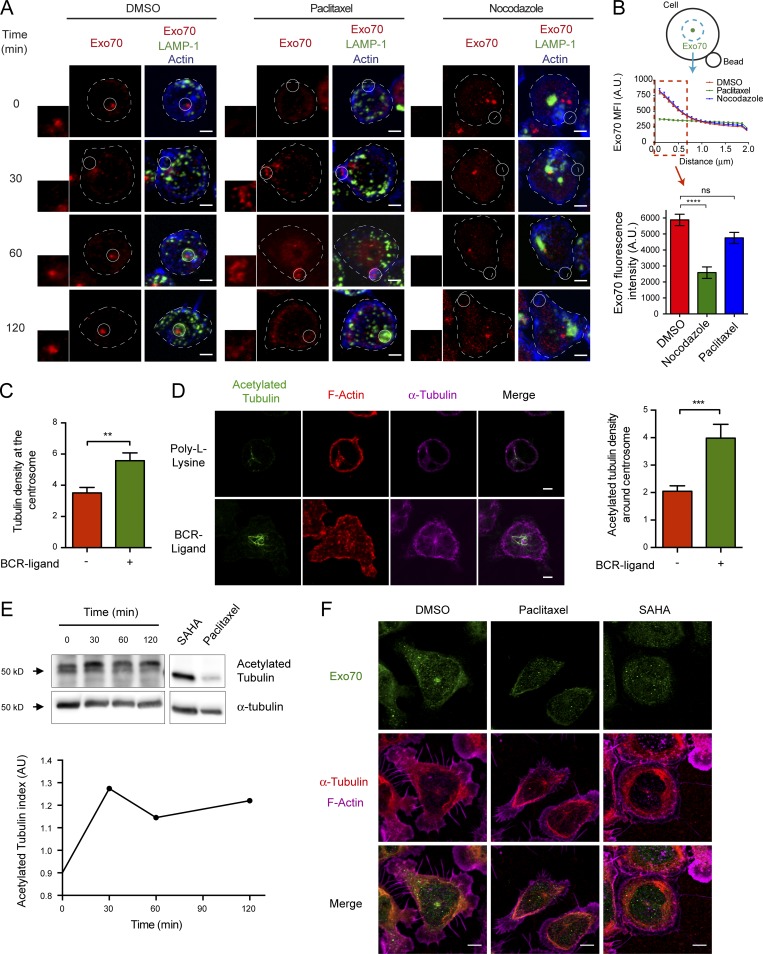
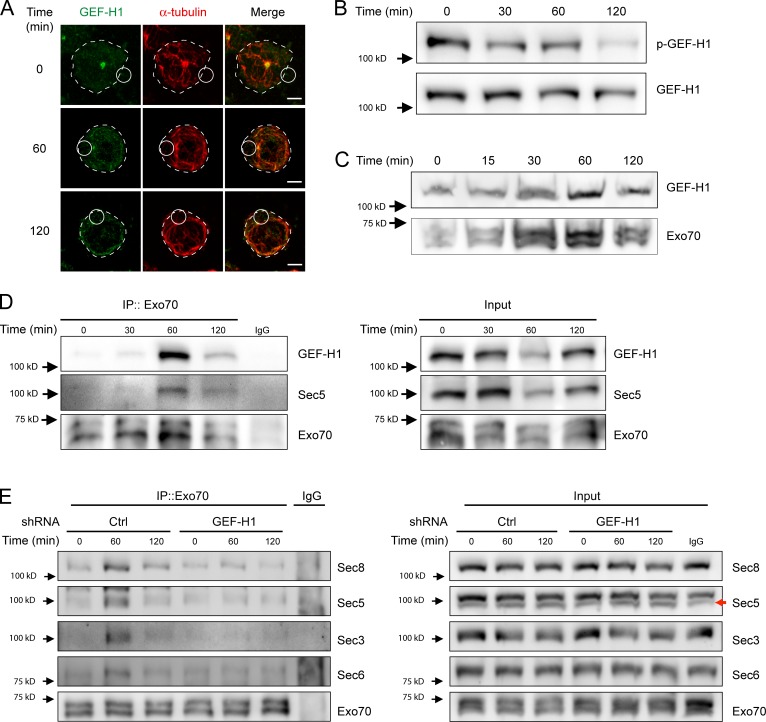
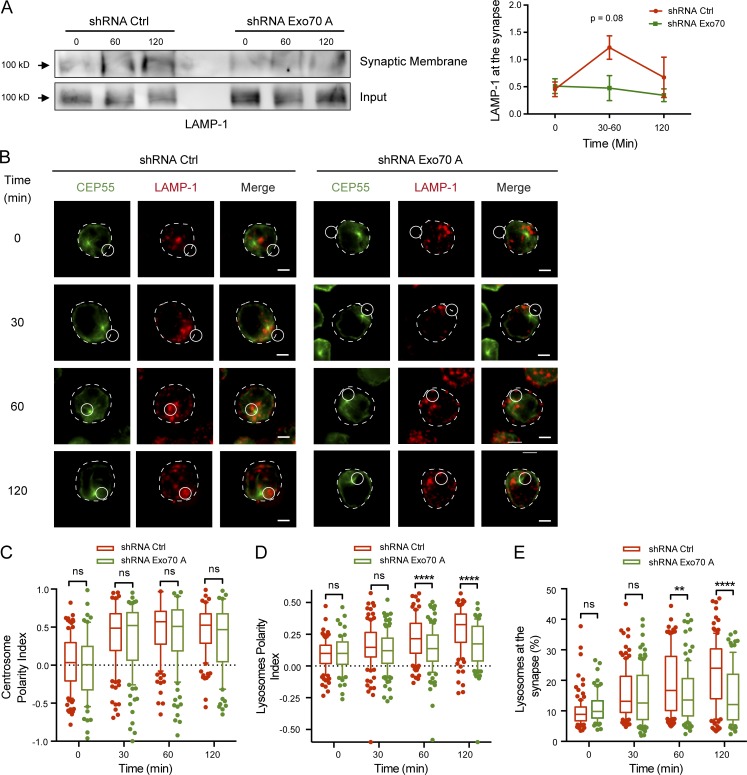
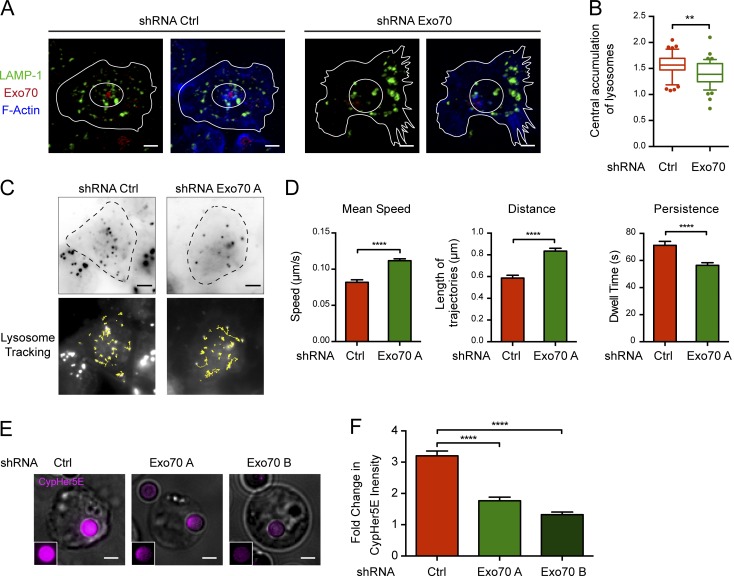
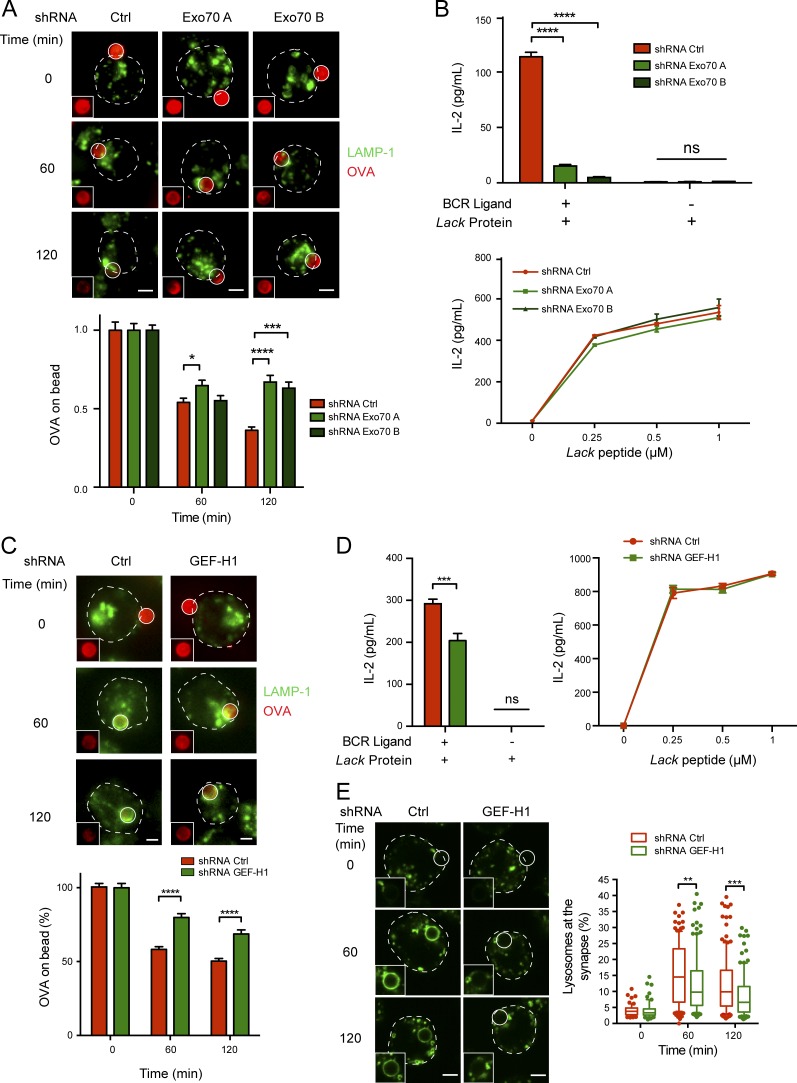
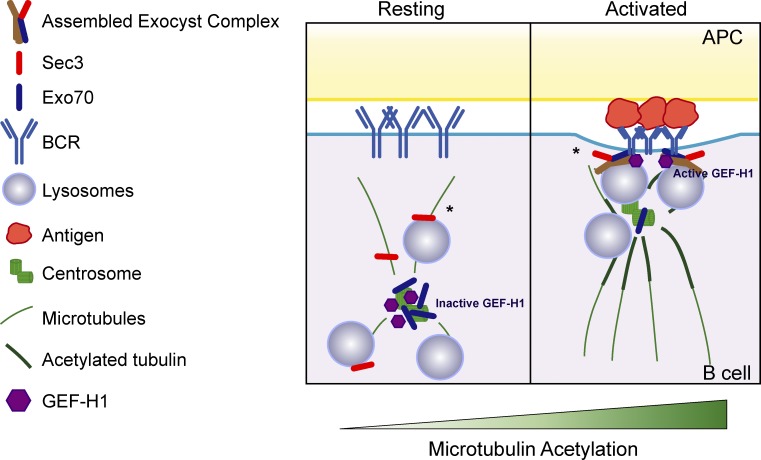
B lymphocytes capture antigens from the surface of presenting cells by forming an immune synapse. Local secretion of lysosomes, which are guided to the synaptic membrane by centrosome repositioning, can facilitate the extraction of immobilized antigens. However, the molecular basis underlying their delivery to precise domains of the plasma membrane remains elusive. Here we show that microtubule stabilization, triggered by engagement of the B cell receptor, acts as a cue to release centrosome-associated Exo70, which is redistributed to the immune synapse. This process is coupled to the recruitment and activation of GEF-H1, which is required for assembly of the exocyst complex, used to promote tethering and fusion of lysosomes at the immune synapse. B cells silenced for GEF-H1 or Exo70 display defective lysosome secretion, which results in impaired antigen extraction and presentation. Thus, centrosome repositioning coupled to changes in microtubule stability orchestrates the spatial-temporal distribution of the exocyst complex to promote polarized lysosome secretion at the immune synapse.


Figures

Figure 1.
Figure 1.
BCR engagement triggers the recruitment of Exo70 and Sec3 to the IS and exocyst assembly. (A) Left: Representative confocal images of B cells incubated with nonactivating (BCR ligand) or activating (BCR ligand+) beads for 1 h at 37°C. Cells were fixed and stained for endogenous Exo70 (green) and LAMP-1 (red) or transfected with Sec3-HA and stained for HA (green) and LAMP-1 (red). White circles and dashed lines indicate bead position and cell boundaries, respectively. Blue arrowheads on inset point to LAMP-1+Sec3+ spots at the IS. Scale bar: 3 µm. Right: Quantification of Exo70 or Sec3 polarity indexes toward the IS. Data are shown as box-and-whisker plots. The ends of whiskers represent the 10th and 90th percentile. Unpaired t test; ****, P < 0.0001; Exo70 polarity index was calculated from n ≥ 39 cells from three independent experiments; Sec3, from n ≥ 26 cells from two independent experiments. (B) B cells were stimulated with BCR ligand+ Dynabeads for the indicated times, and synaptic membranes were isolated containing BCR-associated protein complexes, followed by Exo70, Sec3, LAMP-1, and GAPDH detection by Western blot. Representative of two independent experiments. (C) Exo70 immunoprecipitation (IP) assay to detect the formation of the exocyst complex in B cells activated for indicated times. Representative of four independent experiments.
Figure 2.
Figure 2.
Exo70 is enriched at the centrosome of B cells. (A) Confocal images of centrin-GFP–expressing cells (shown in red) activated with BCR ligand–positive or –negative beads for the indicated times. Exo70 (green) and LAMP-1 (cyan). Scale bar: 3 µm. (B) Exo70 and centrosome polarity indexes were calculated from the images in A. ****, P < 0.0001; two-way ANOVA with Sidak’s multiple comparison test; n ≥ 39 cells from three independent experiments. (C) Correlation analysis between Exo70 and centrosome polarity indexes from B cells resting (red) and activated for 120 min (blue). (Spearman correlation coefficient). (D) Left: Scheme depicting the method used to quantify centrosome-associated Exo70. Right: Quantification of centrosome-associated Exo70 during B cell activation. ****, P < 0.0001; two-way ANOVA with Sidak’s multiple comparison test; n ≥ 64 cells from three independent experiments. (E) Pearson’s coefficient between Exo70 and centrin-GFP at different times. *, P = 0.0112; ***, P = 0.0009; two-way ANOVA with Sidak’s multiple comparison test; n ≥ 52 cells from two independent experiments. Error bars are mean ± SEM.
Figure 3.
Figure 3.
Localization of Exo70 at the centrosome is regulated by microtubule dynamics. (A) Z-projections of confocal images of B cells pretreated with DMSO, paclitaxel, or nocodazole for 1 h and activated with BCR ligand+ beads for the indicated times. Exo70 (red), LAMP-1 (green), and F-actin (blue). Insets highlight the IS area. Scale bar: 3 µm. (B) Scheme depicting quantification of Exo70 MFI as a radial profile in a 3-µm radius area from the brightest point of Exo70. Graph represents the MFI of Exo70 within the first 0.7 µm of the graph, plotted for DMSO-, paclitaxel-, or nocodazole-treated cells. ****, P < 0.0001; two-way ANOVA with Sidak’s multiple comparison test; n ≥ 80 cells from two independent experiments. (C) Microtubule accumulation at the centrosome was quantified in resting or 60-min-activated B cells. n ≥ 31 cells per time point from three independent experiments. ***, P = 0.0006; unpaired t test; n ≥ 31 cells from two independent experiments. (D) Left: B cells were seeded on poly-l-lysine or BCR-ligand+ coated coverslips for 60 min. Acetylated tubulin (green), α-tubulin (red), and F-actin (phalloidin, magenta). Scale bar: 3 µm. Right: Quantification of the centrosomal acetylated tubulin. **, P = 0.0032; unpaired t test; n ≥ 49 cells from two independent experiments. Error bars are mean ± SEM. (E) B cells were activated as described in D. Top: Acetylated tubulin levels were evaluated by Western blot. Bottom: Quantification of acetylated tubulin levels normalized by total tubulin levels. (F) Z-projections of confocal images of B cells seeded for 30 min on BCR ligand+ coated coverslips and then treated with paclitaxel 20 µM or SAHA 1 µM for 30 min. Exo70, green; α-tubulin, red; F-actin (phalloidin), magenta. Scale bar: 3 µm.
Figure 4.
Figure 4.
GEF-H1 accumulates at the IS of B cells and is required for exocyst assembly. (A) Representative confocal images of B cells activated with BCR ligand+ coated beads for different times. GEF-H1 (green) and α-tubulin (red). Scale bar: 3 µm. (B) B cells were activated on BCR ligand+ coated plates for different times, and p-GEF-H1 and total GEF-H1 were detected by Western blot. Representative of three independent experiments. (C) Detection of GEF-H1 in synaptic membranes. B cells were stimulated with BCR ligand+ Dynabeads for the indicated times, and GEF-H1 was detected in isolated synaptic membranes by Western blot. Representative of two independent experiments. (D) B cells were activated as described in B, and Exo70 was immunoprecipitated (IP) from corresponding lysates. Associated GEF-H1 and Sec5 were detected by Western blot. Representative of four independent experiments. (E) Control or GEF-H1–silenced B cells were activated as in B, and the formation of exocyst complexes was evaluated by immunoprecipitating Exo70 from lysates. Sec8, Sec5, Sec3, Sec6, and Exo70 were detected by Western blot. Red arrow specifies the band corresponding to Sec5. Representative of two independent experiments.
Figure 5.
Figure 5.
Exo70-silenced B cells display deficient lysosome stabilization and fusion at the IS. (A) Control or Exo70-deficient B cells were stimulated with BCR ligand+ Dynabeads for indicated times, and synaptic membranes were isolated. Left: Detection of LAMP-1 by Western blot. Right: Quantification of LAMP-1 normalized to input protein levels in total lysates from four independent experiments. Error bars are mean ± SEM. (B) Representative images of B cells stained for the centrosome (CEP55, green) and lysosomes (LAMP-1, red) after indicated activation times with BCR ligand+ beads. The centrosome plane of the CEP55 staining is shown along the Z-projection of LAMP-1. Scale bar: 3 µm. (C–E) Quantification of centrosome and lysosome polarity indexes (C and D) and lysosome accumulation (E) at the IS. **, P = 0.0026; ****, P < 0.0001; ANOVA with Sidak’s multiple comparison test. n ≥ 70 cells from two independent experiments. ns, not significant.
Figure 6.
Figure 6.
Defective lysosome docking and secretion at the IS of Exo70-silenced cells. (A) Confocal images of control and Exo70-silenced cells activated on BCR ligand+ coverslips for 60 min. LAMP-1 (green), Exo70 (red), and F-actin (blue). Scale bar: 3 µm. (B) Ratio between the central and peripheral lysosomes in the cell. **, P = 0.001; unpaired t test; n ≥ 44 cells from two independent experiments. (C) Top: TIRF images of LysoSensor Green–stained lysosomes at IS of control and Exo70-silenced B cells plated on BCR ligand+ coated slides. Bottom: Lysosome trajectories of the TIRF images are shown as yellow lines. Scale bar: 5 µm. (D) Quantification of dynamic parameters of lysosomes at the IS. ****, P < 0.0001; unpaired t test; n ≥ 500 lysosome trajectories from ≥14 cells per condition from two independent experiments. Error bars are mean ± SEM. (E) Representative epifluorescence images of Exo70-silenced or control cells activated with CypHer5E-coupled BCR ligand+ beads for 90 min. Cells are shown as Z-projections of a stack. Insets highlight the CypHer5E fluorescence in the bead. Scale bar: 3 µm. (F) Quantification of the bead CypHer5E intensity, normalized by the intensity of noninteracting beads. ****, P < 0.0001; two-way ANOVA with Sidak’s multiple comparison test; n ≥ 160 cells from two independent experiments. Error bars are mean ± SEM.
Figure 7.
Figure 7.
Impaired antigen extraction and presentation in Exo70-silenced and GEF-H1 silenced cells. (A and C) Antigen extraction assay. Top: Representative epifluorescence images of control and Exo70-silenced (A) or GEF-H1–silenced (C) cells incubated with BCR ligand+ beads coupled to OVA for the indicated times. Cells were fixed and stained for OVA (red) and LAMP-1 (green). Images are shown as Z-projections of a stack. Insets highlight the remaining OVA fluorescence intensity on the bead. Scale bar: 3 µm. Bottom: Quantification of OVA fluorescence intensity remaining on beads. Values were normalized by the initial fluorescence. *, P < 0.05; ***, P < 0.001; ****, P < 0.0001; two-way ANOVA with Sidak’s multiple comparison test; Exo70: n ≥ 59 cells from two independent experiments; GEF-H1: n ≥ 73 cells from three independent experiments. (B and D) Antigen presentation assays. Top: Antigen presentation assay with control and Exo70-silenced (B) or GEF-H1–silenced (D) cells. Bottom: Peptide control for the cells used. Mean amounts of IL-2 are shown for a representative of three independent experiments performed in triplicate for Exo70-silenced cells, two independent experiments for GEF-H1–silenced cells. ***, P = 0.0006; ****, P < 0.0001; two-way ANOVA with Sidak’s multiple comparison test. Error bars are mean ± SEM. (E) Representative images of lysosome recruitment to antigen-coated beads in control and GEF-H1–silenced cells. **, P < 0.01; ***, P < 0.001; two-way ANOVA with Sidak’s multiple comparison test; n ≥ 93 cells from three independent experiments.
Figure 8.
Figure 8.
Scheme depicting how the recruitment of the exocyst at the IS is regulated. In resting conditions, Exo70 is mainly associated to the centrosome and inactive GEF-H1 to microtubules. BCR engagement enhances microtubule acetylation surrounding the centrosome, which releases Exo70 allowing its recruitment to the IS, and activates GEF-H1, which promotes the assembly of the exocyst complex to support local lysosome fusion at the synaptic membrane. Asterisk indicates that the localization of Sec3 and the site of exocyst assembly complex remain to be elucidated. APC, antigen-presenting cell.

Similar articles

Cited by

References

    1. Ahmed S.M., and Macara I.G.. 2017. The Par3 polarity protein is an exocyst receptor essential for mammary cell survival. Nat. Commun. 8:14867 10.1038/ncomms14867 - DOI - PMC - PubMed
    1. Avalos A.M., and Ploegh H.L.. 2014. Early BCR events and antigen capture, processing, and loading on MHC class II on B cells. Front. Immunol. 5:92 10.3389/fimmu.2014.00092 - DOI - PMC - PubMed
    1. Baek K., Knödler A., Lee S.H., Zhang X., Orlando K., Zhang J., Foskett T.J., Guo W., and Dominguez R.. 2010. Structure-function study of the N-terminal domain of exocyst subunit Sec3. J. Biol. Chem. 285:10424–10433. 10.1074/jbc.M109.096966 - DOI - PMC - PubMed
    1. Batista F.D., and Neuberger M.S.. 2000. B cells extract and present immobilized antigen: implications for affinity discrimination. EMBO J. 19:513–520. 10.1093/emboj/19.4.513 - DOI - PMC - PubMed
    1. Bendezú F.O., Vincenzetti V., and Martin S.G.. 2012. Fission yeast Sec3 and Exo70 are transported on actin cables and localize the exocyst complex to cell poles. PLoS One. 7:e40248 10.1371/journal.pone.0040248 - DOI - PMC - PubMed

Publication types

MeSH terms

Substances