. 2019 Aug 2;294(31):11805-11816.
doi: 10.1074/jbc.RA119.008708. Epub 2019 Jun 13.

Enhanced acetylation of ATP-citrate lyase promotes the progression of nonalcoholic fatty liver disease

Affiliations

Enhanced acetylation of ATP-citrate lyase promotes the progression of nonalcoholic fatty liver disease

Liang Guo et al. J Biol Chem. .

Abstract

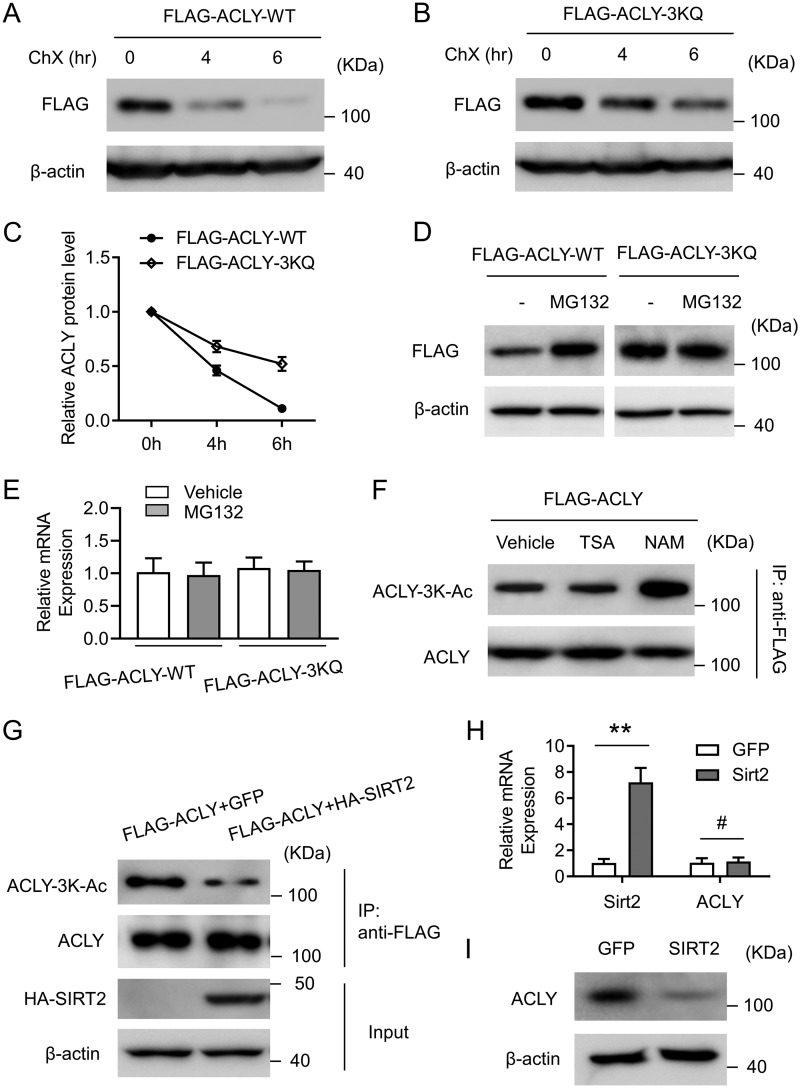
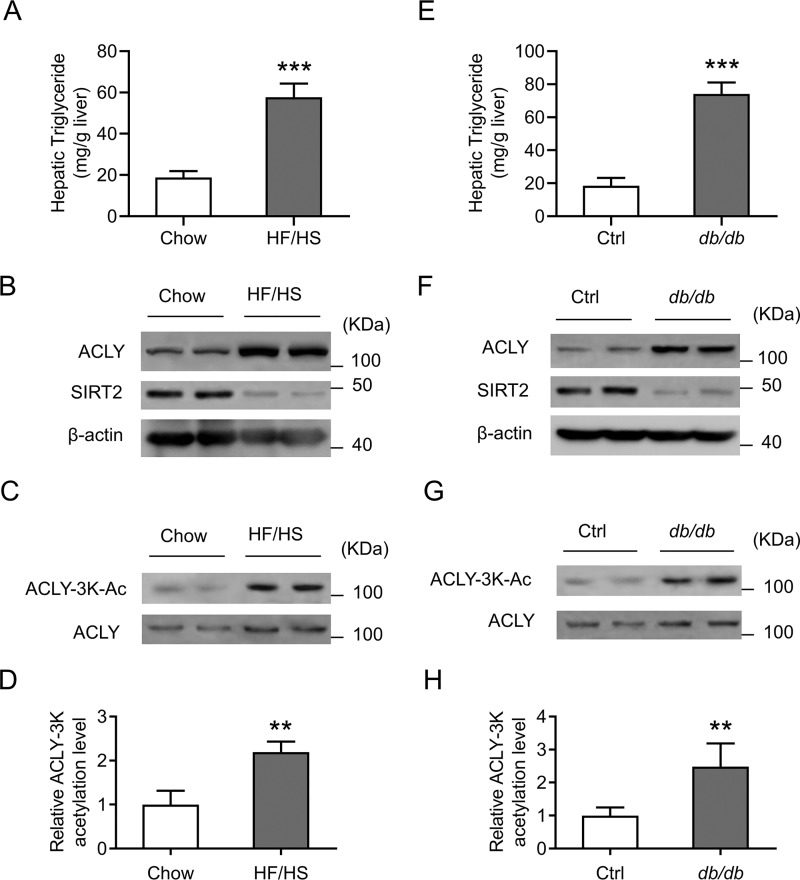
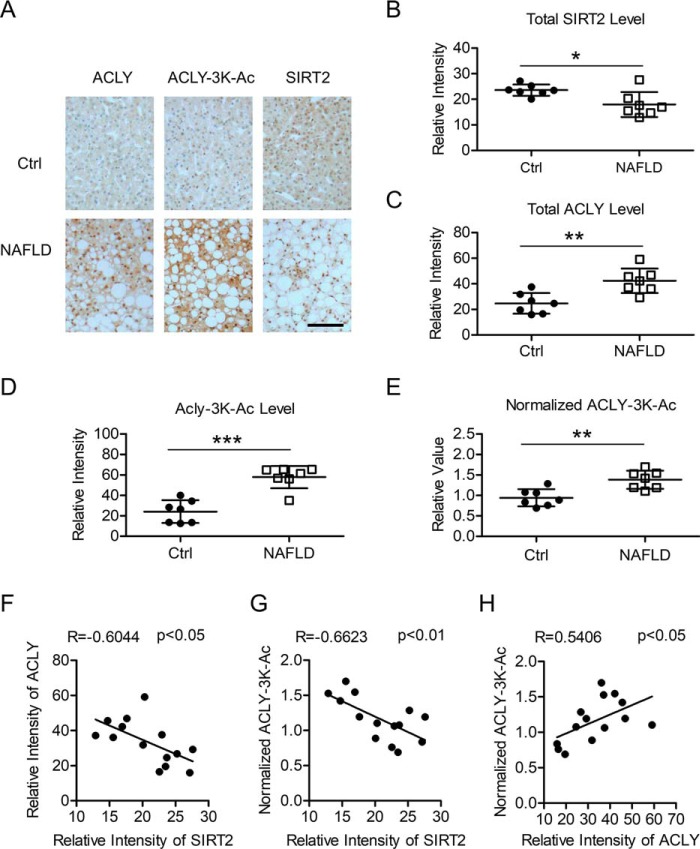
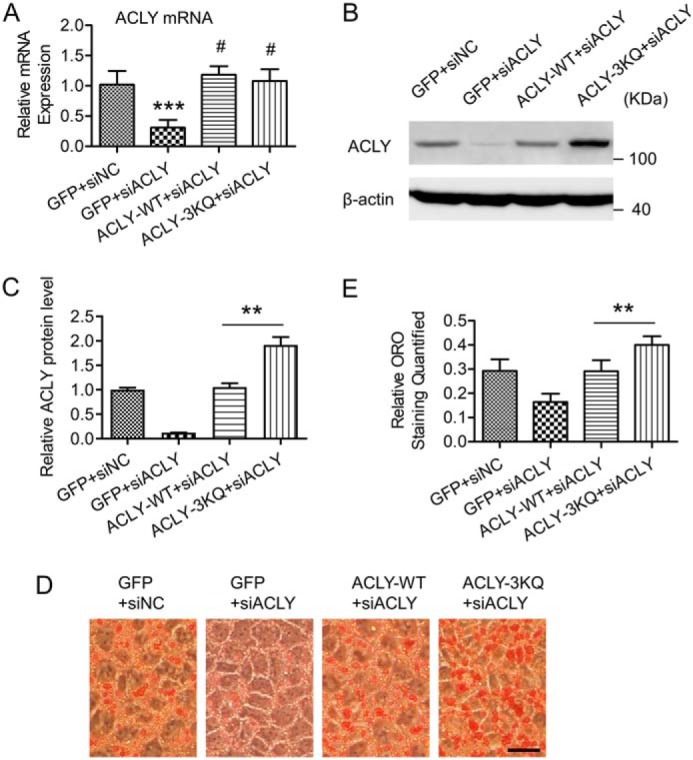
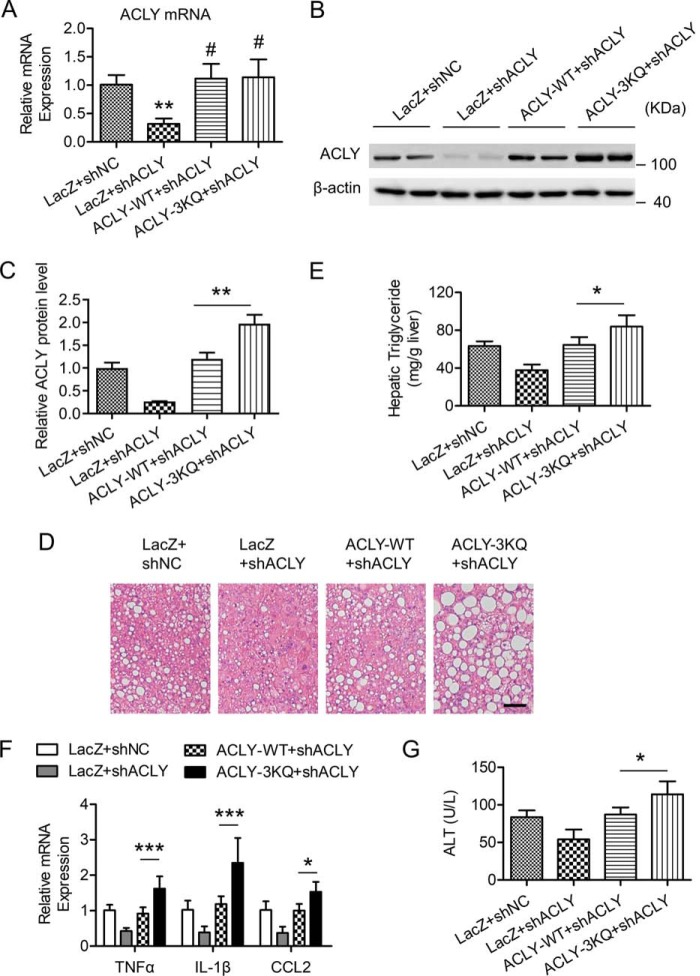
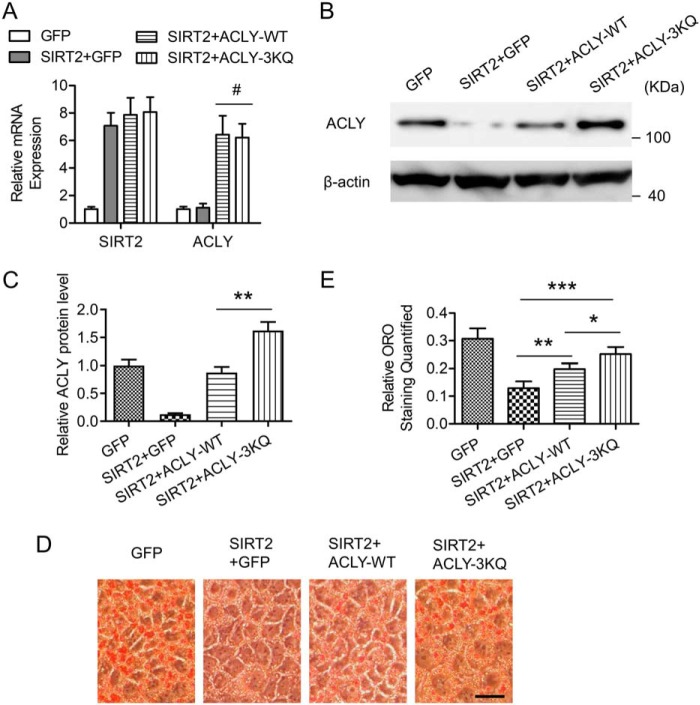
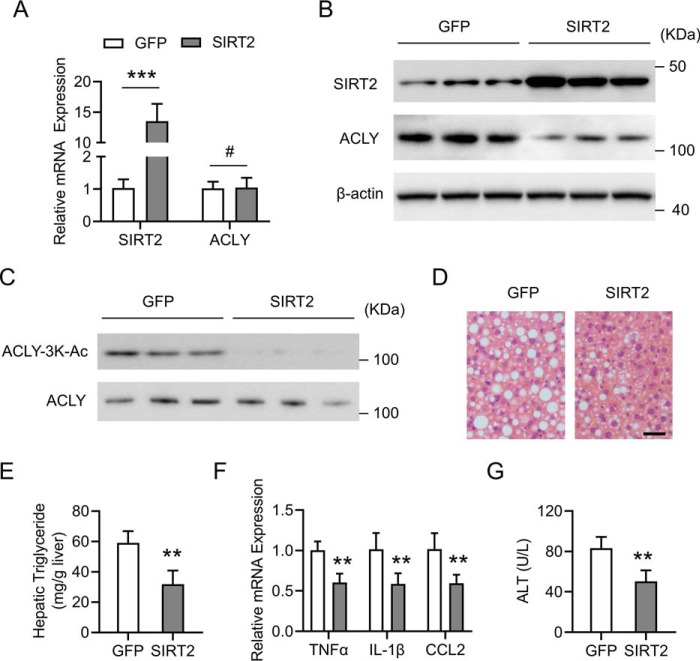
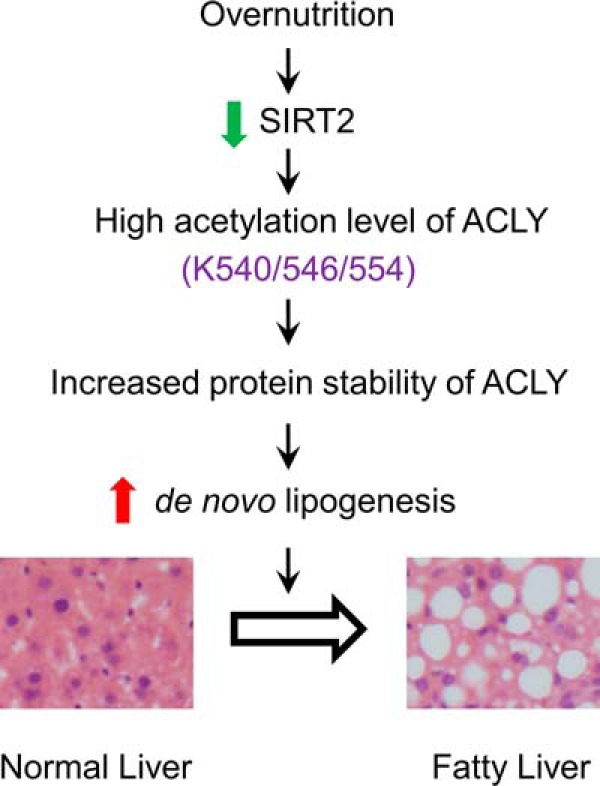
Hepatic steatosis is a hallmark of nonalcoholic fatty liver disease (NAFLD) and is promoted by dysregulated de novo lipogenesis. ATP-citrate lyase (ACLY) is a crucial lipogenic enzyme that is up-regulated in individuals with NAFLD. A previous study has shown that acetylation of ACLY at Lys-540, Lys-546, and Lys-554 (ACLY-3K) increases ACLY protein stability by antagonizing its ubiquitylation, thereby promoting lipid synthesis and cell proliferation in lung cancer cells. But the functional importance of this regulatory mechanism in other cellular or tissue contexts or under other pathophysiological conditions awaits further investigation. Here, we show that ACLY-3K acetylation also promotes ACLY protein stability in AML12 cells, a mouse hepatocyte cell line, and found that the deacetylase sirtuin 2 (SIRT2) deacetylates ACLY-3K and destabilizes ACLY in these cells. Of note, the livers of mice and humans with NAFLD had increased ACLY protein and ACLY-3K acetylation levels and decreased SIRT2 protein levels. Mimicking ACLY-3K acetylation by replacing the three lysines with three glutamines (ACLY-3KQ variant) promoted lipid accumulation both in high glucose-treated AML12 cells and in the livers of high-fat/high-sucrose (HF/HS) diet-fed mice. Moreover, overexpressing SIRT2 in AML12 cells inhibited lipid accumulation, which was more efficiently reversed by overexpressing the ACLY-3KQ variant than by overexpressing WT ACLY. Additionally, hepatic SIRT2 overexpression decreased ACLY-3K acetylation and its protein level and alleviated hepatic steatosis in HF/HS diet-fed mice. Our findings reveal a posttranscriptional mechanism underlying the up-regulation of hepatic ACLY in NAFLD and suggest that the SIRT2/ACLY axis is involved in NAFLD progression.

Keywords: ATP-citrate lyase (ACLY); acetylation; deacetylase; hepatic steatosis; hepatocyte; lipid metabolism; lipogenesis; metabolic disorder; nonalcoholic fatty liver disease (NAFLD); protein stability; sirtuin.


Conflict of interest statement

The authors declare that they have no conflicts of interest with the contents of this article

Figures

Figure 1.
Figure 1.
SIRT2-mediated ACLY deacetylation on lysine residues 540, 546, and 554 (3K sites) decreases ACLY protein stability in the mouse hepatocyte cell line AML12. A and B, AML12 cells were transfected with the plasmids encoding FLAG-tagged WT or 3KQ variant of ACLY. At 24 h after transfection, cells were treated with CHX for the indicated time and then subjected to Western blotting. C, the band intensity of the Western blotting results in A and B was quantified by ImageJ. The values are normalized to the 0-h time point. D, AML12 cells were transfected with the plasmids encoding FLAG-tagged WT or 3KQ variant of ACLY. At 24 h after transfection, cells were treated with or without MG132 for 4 h before being harvested. Cell lysates were then subjected to Western blotting using the indicated antibodies. β-Actin serves as an internal control. E, cells were treated as in D, and the mRNA levels of ACLY were determined by RT-qPCR. Data are normalized to the FLAG-ACLY-WT/vehicle group. F, AML12 cells were transfected with the plasmid encoding FLAG-ACLY-WT. At 24 h after transfection, cells were treated with TSA or NAM before being harvested. Immunoprecipitation was then performed with anti-FLAG antibody, and the immunoprecipitated proteins were subjected to Western blotting using the indicated antibodies. G, AML12 cells were transfected with the indicated plasmids. At 24 h after transfection, immunoprecipitation (IP) was performed with anti-FLAG antibody, and the immunoprecipitated proteins and the whole-cell lysates (Input) were subjected to Western blotting using the indicated antibodies. H and I, AML12 cells were transfected with the plasmid encoding GFP or SIRT2. At 48 h after transfection, cells were harvested. The mRNA levels of the indicated genes were determined by RT-qPCR (H), and the cell lysates were subjected to Western blotting with the indicated antibodies (I). For RT-qPCR results in H, data are normalized to the GFP group. Two-way analysis of variance and Bonferroni's post hoc tests were performed in H. All values are represented as means with error bars representing S.D. **, p < 0.01; #, p > 0.05. n = 5 for each group.
Figure 2.
Figure 2.
ACLY protein level and ACLY-3K acetylation are up-regulated, whereas SIRT2 protein level is decreased in the livers of HF/HS diet–fed mice and db/db mice. A, hepatic triglyceride levels of chow diet– and HF/HS diet–fed mice were determined and plotted. B, the livers from chow diet– and HF/HS diet–fed mice were lysed and subjected to Western blotting with the indicated antibodies. The ACLY and SIRT2 protein levels were compared against β-actin. C, the livers from chow diet– and HF/HS diet–fed mice were lysed and subjected to Western blotting with the indicated antibodies. The ACLY-3K acetylation levels were compared against total ACLY protein levels. D, the ACLY-3K acetylation band intensity of the Western blotting results in C was quantified by ImageJ. The values are normalized to the chow diet–fed group. E, hepatic triglyceride levels of lean control (Ctrl) and db/db mice were determined and plotted. F, the livers from lean control and db/db mice were lysed and subjected to Western blotting with the indicated antibodies. The ACLY and SIRT2 protein levels were compared against β-actin. G, the livers from lean control and db/db mice were lysed and subjected to Western blotting with the indicated antibodies. The ACLY-3K acetylation levels were compared against total ACLY protein levels. H, the ACLY-3K acetylation band intensity of the Western blotting results in G was quantified by ImageJ. The values are normalized to the control group. For statistical analysis, unpaired two-tailed Student's t tests were used in A, D, E, and H. **, p < 0.01; ***, p < 0.001. Data were compared with the chow diet–fed group in A and D and compared with the control group in E and H. All values are represented as means with error bars representing S.D. n = 5 for each group.
Figure 3.
Figure 3.
ACLY protein level and ACLY-3K acetylation are up-regulated, whereas SIRT2 protein level is decreased in the livers of NAFLD patients. A, IHC staining of total ACLY, ACLY-3K-Ac, and total SIRT2 in the livers of control patients (Ctrl) and NAFLD patients. Representative images are shown. Scale bar, 50 μm. B–D, the relative staining intensity for SIRT2, total ACLY, and ACLY-3K acetylation of the IHC images was calculated by ImageJ and plotted. E, normalized ACLY-3K acetylation of the IHC images was calculated by normalizing the relative intensity of ACLY-3K acetylation to the relative intensity of total ACLY. F–H, based on the IHC results, linear regression analyses between the indicated parameters were performed and plotted. Unpaired two-tailed Student's t tests were performed from B–E. All values are represented as means with error bars representing S.D. *, p < 0.05; **, p < 0.01; ***, p < 0.001. n = 7 for control patients and n = 7 for NAFLD patients.
Figure 4.
Figure 4.
ACLY-3K acetylation enhances lipid accumulation in high glucose–treated AML12 cells. A, AML12 cells cultured in high-glucose (25 mm) medium were transfected with control siRNA (siNC) or siRNA against ACLY (siACLY) together with the plasmids encoding GFP, RNAi-resistant WT ACLY (ACLY-WT), or ACLY-3KQ variant. At 48 h after transfection, cells were harvested, and the mRNA level of ACLY was determined by RT-qPCR. For RT-qPCR results in A, data are normalized to the GFP+siNC group. For statistical analysis, all groups were compared with the GFP+siNC group. B, AML12 cells were treated as in A, and at 48 h after transfection, cell lysates were subjected to Western blotting with the indicated antibodies. β-Actin serves as an internal control. C, the band intensity of ACLY in the Western blotting results of B was quantified by ImageJ. The values are normalized to the GFP+siNC group. D, AML12 cells were treated as in A, and at 48 h after transfection, Oil Red O staining of the cells was performed. Scale bar, 50 μm. E, Oil Red O (ORO) was extracted from cells in D and measured by absorbance at 490 nm. For statistical analysis, one-way analysis of variance and Bonferroni's post hoc tests were carried out in A, C, and E. **, p < 0.01; ***, p < 0.001; #, p > 0.05. All values are represented as means with error bars representing S.D. n = 6 for each group.
Figure 5.
Figure 5.
ACLY-3K acetylation aggravates hepatic steatosis in mice challenged by HF/HS diet. Male C57BL/6J mice fed an HF/HS diet for 12 weeks were injected once a week with adenovirus harboring shNC or shACLY together with adenovirus harboring the gene encoding LacZ, RNAi-resistant WT ACLY (ACLY-WT), or ACLY-3KQ variant through the tail vein. Mice were sacrificed, and measurements were performed 15 days after the first virus injection. The mRNA levels and protein levels of ACLY in the mouse livers were determined by RT-qPCR (A) and Western blotting (B), respectively. For RT-qPCR results in A, data are normalized to the LacZ+shNC group. For statistical analysis, all groups were compared with the LacZ+shNC group. β-Actin serves as an internal control in B. C, the band intensity of ACLY in the Western blotting results of B was quantified by ImageJ. The values are normalized to the LacZ+shNC group. D, representative images of H&E staining of mouse liver sections are shown. Scale bar, 50 μm. E, hepatic triglyceride levels were determined and plotted. F, the mRNA levels of the indicated inflammatory genes in mouse livers were determined by RT-qPCR. The data are normalized to the LacZ+shNC group. G, plasma ALT levels of the mice were determined and plotted. For statistical analysis, one-way analysis of variance and Bonferroni's post hoc tests were carried out in A, C, E, and G, and two-way analysis of variance and Bonferroni's post hoc tests were carried out in F. *, p < 0.05; **, p < 0.01; ***, p < 0.001; #, p > 0.05. All values are represented as means with error bars representing S.D. n = 5 for each group.
Figure 6.
Figure 6.
Deacetylation of ACLY-3K contributes to SIRT2-mediated inhibition of lipid accumulation in high glucose–treated AML12 cells. A, AML12 cells cultured in high-glucose (25 mm) medium were transfected with the plasmid encoding GFP or SIRT2 together with the plasmid encoding ACLY-WT or ACLY-3KQ variant. At 48 h after transfection, cells were harvested, and the mRNA levels of SIRT2 and ACLY were determined by RT-qPCR. Data are normalized to the GFP group. B, AML12 cells were treated as in A, and at 48 h after transfection, cell lysates were subjected to Western blotting with the indicated antibodies. β-Actin serves as an internal control. C, the band intensity of ACLY in the Western blotting results of B was quantified by ImageJ. The values are normalized to the GFP group. D, AML12 cells were treated as in A, and at 48 h after transfection, Oil Red O staining of the cells was performed. Scale bar, 50 μm. E, Oil Red O (ORO) was extracted from cells in D and measured by absorbance at 490 nm. For statistical analysis, two-way analysis of variance and Bonferroni's post hoc tests were carried out in A, and one-way analysis of variance and Bonferroni's post hoc tests were carried out in C and E. *, p < 0.05; **, p < 0.01; ***, p < 0.001; #, p > 0.05. All values are represented as means with error bars representing S.D. n = 6 for each group.
Figure 7.
Figure 7.
Overexpression of hepatic SIRT2 decreases ACLY-3K acetylation and its protein level with alleviated hepatic steatosis in mice challenged by HF/HS diet. Male C57BL/6J mice fed an HF/HS diet for 12 weeks were injected once a week with adenovirus harboring the gene encoding GFP or SIRT2 through the tail vein. Mice were sacrificed, and measurements were performed 15 days after the first virus injection. A, the mRNA levels of SIRT2 and ACLY in the mouse livers were determined by RT-qPCR. Data are normalized to the GFP group. B and C, the mouse livers were lysed and subjected to Western blotting with the indicated antibodies. β-Actin serves as an internal control in B. The ACLY-3K acetylation levels were compared against total ACLY protein levels in C. D, representative images of H&E staining of mouse liver sections are shown. Scale bar, 50 μm. E, hepatic triglyceride levels were determined and plotted. F, the mRNA levels of the indicated inflammatory genes in mouse livers were determined by RT-qPCR. The data are normalized to the GFP group. G, plasma ALT levels of the mice were determined and plotted. For statistical analysis, unpaired two-tailed Student's t tests were used in E and G, and two-way analysis of variance and Bonferroni's post hoc tests were carried out in A and F. Data were compared with the GFP group in E, F, and G. **, p < 0.01; ***, p < 0.001; #, p > 0.05. All values are represented as means with error bars representing S.D. n = 6 for each group.
Figure 8.
Figure 8.
A proposed model for the role of dysregulated ACLY-3K acetylation in the pathogenic development of NAFLD. The expression of SIRT2 in the liver is decreased after overnutrition, thereby increasing the acetylation level of ACLY on lysine residues 540, 546, and 554 (3K sites). Enhanced ACLY-3K acetylation increases the protein stability of ACLY, which promotes de novo lipogenesis. The effect above contributes to hepatic steatosis and could be involved in the pathogenic development of NAFLD.

Similar articles

Cited by

References

    1. Day C. P., and James O. F. (1998) Steatohepatitis: a tale of two “hits”? Gastroenterology 114, 842–845 10.1016/S0016-5085(98)70599-2 - DOI - PubMed
    1. Marchesini G., and Babini M. (2006) Nonalcoholic fatty liver disease and the metabolic syndrome. Minerva Cardioangiol. 54, 229–239 - PubMed
    1. Rinella M. E. (2015) Nonalcoholic fatty liver disease: a systematic review. JAMA 313, 2263–2273 10.1001/jama.2015.5370 - DOI - PubMed
    1. Dietrich P., and Hellerbrand C. (2014) Non-alcoholic fatty liver disease, obesity and the metabolic syndrome. Best Pract. Res. Clin. Gastroenterol. 28, 637–653 10.1016/j.bpg.2014.07.008 - DOI - PubMed
    1. Koppe S. W. (2014) Obesity and the liver: nonalcoholic fatty liver disease. Transl. Res. 164, 312–322 10.1016/j.trsl.2014.06.008 - DOI - PubMed

Publication types

MeSH terms