

Bicarbonate is essential for protein-tyrosine phosphatase 1B (PTP1B) oxidation and cellular signaling through EGF-triggered phosphorylation cascades
- PMID: 31197039
- PMCID: PMC6699834
- DOI: 10.1074/jbc.RA119.009001
Bicarbonate is essential for protein-tyrosine phosphatase 1B (PTP1B) oxidation and cellular signaling through EGF-triggered phosphorylation cascades
Abstract
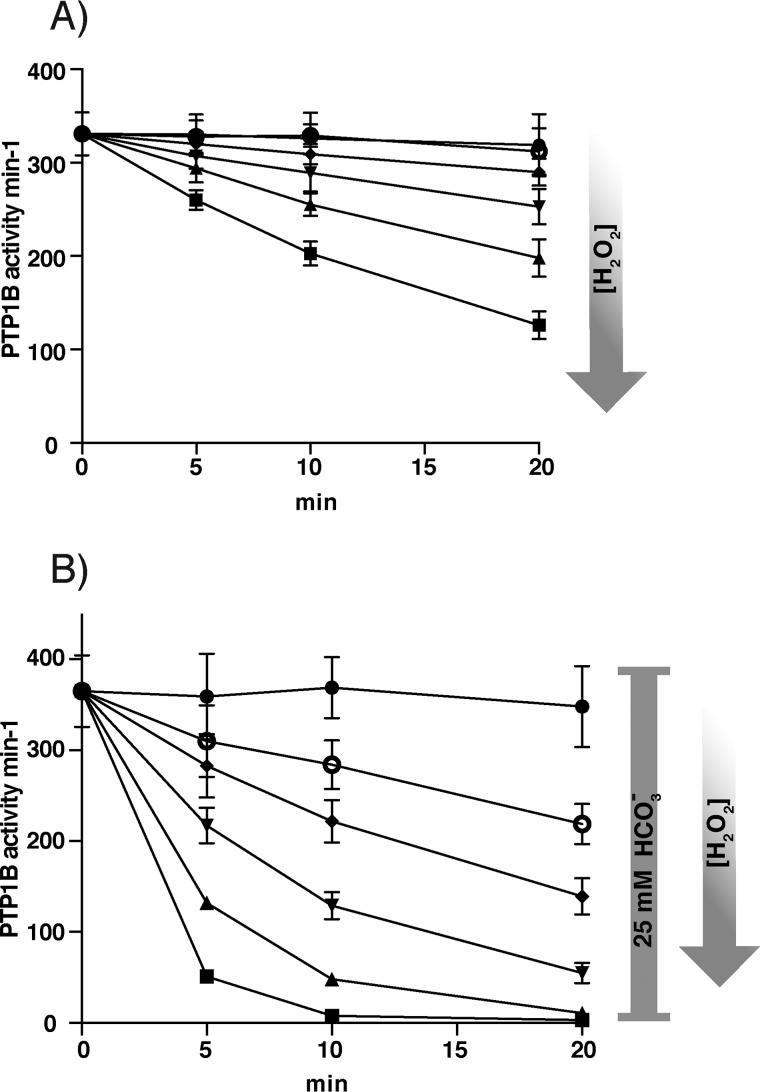
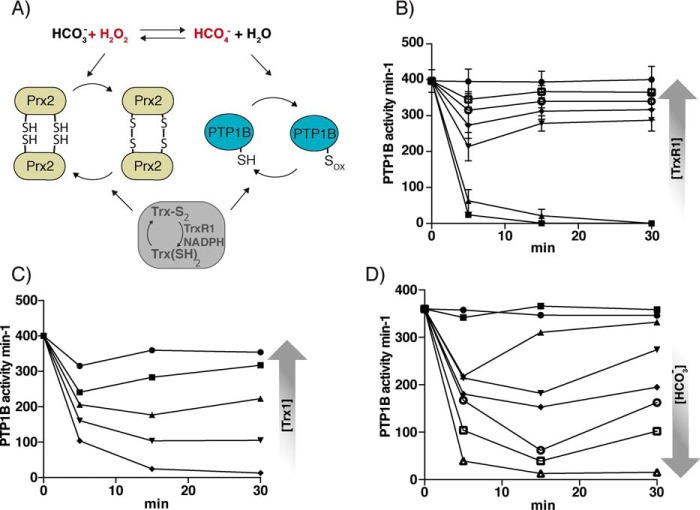
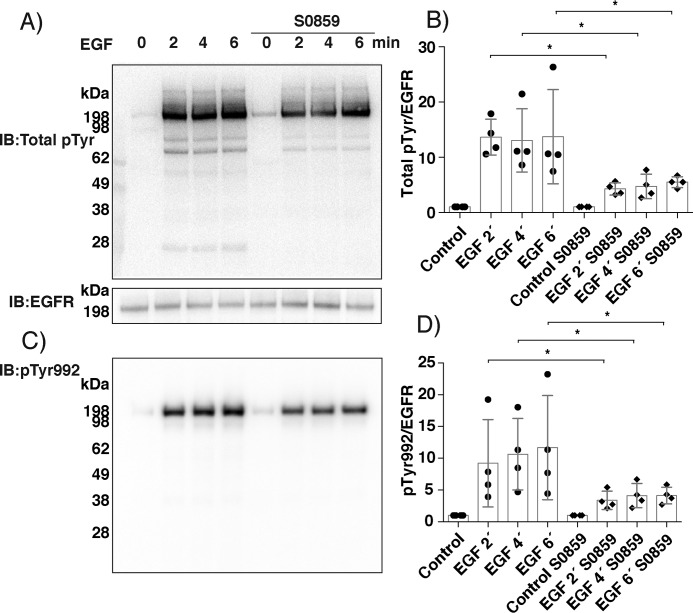
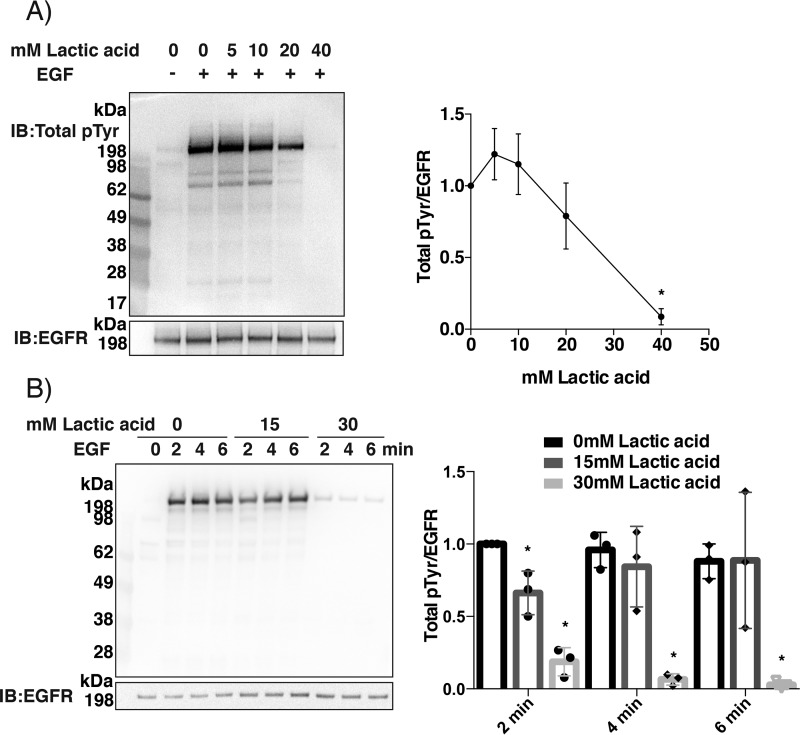
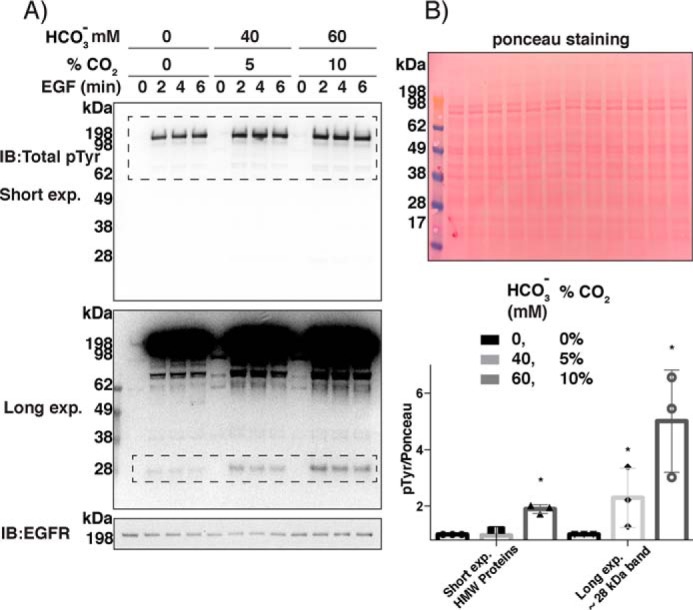
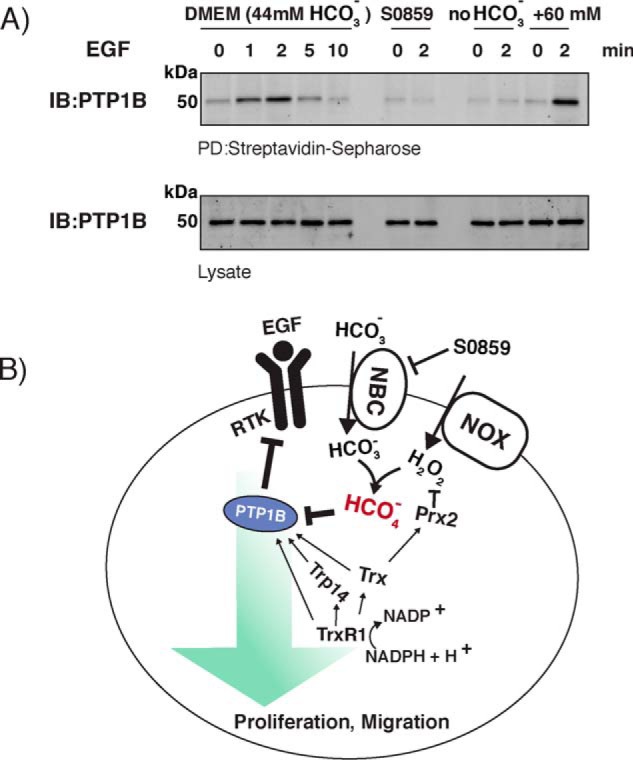
Protein-tyrosine phosphatases (PTPs) counteract protein tyrosine phosphorylation and cooperate with receptor-tyrosine kinases in the regulation of cell signaling. PTPs need to undergo oxidative inhibition for activation of cellular cascades of protein-tyrosine kinase phosphorylation following growth factor stimulation. It has remained enigmatic how such oxidation can occur in the presence of potent cellular reducing systems. Here, using in vitro biochemical assays with purified, recombinant protein, along with experiments in the adenocarcinoma cell line A431, we discovered that bicarbonate, which reacts with H2O2 to form the more reactive peroxymonocarbonate, potently facilitates H2O2-mediated PTP1B inactivation in the presence of thioredoxin reductase 1 (TrxR1), thioredoxin 1 (Trx1), and peroxiredoxin 2 (Prx2) together with NADPH. The cellular experiments revealed that intracellular bicarbonate proportionally dictates total protein phosphotyrosine levels obtained after stimulation with epidermal growth factor (EGF) and that bicarbonate levels directly correlate with the extent of PTP1B oxidation. In fact, EGF-induced cellular oxidation of PTP1B was completely dependent on the presence of bicarbonate. These results provide a plausible mechanism for PTP inactivation during cell signaling and explain long-standing observations that growth factor responses and protein phosphorylation cascades are intimately linked to the cellular acid-base balance.
Keywords: bicarbonate; epidermal growth factor receptor (EGFR); oxidative inactivation; peroxiredoxin; peroxymonocarbonate; phosphatase; phosphorylation cascade; protein-tyrosine phosphatase (PTP); redox regulation; redox signaling; thioredoxin reductase.
© 2019 Dagnell et al.
Conflict of interest statement
The authors declare that they have no conflicts of interest with the contents of this article
Figures
Similar articles
-
Thioredoxin reductase 1 and NADPH directly protect protein tyrosine phosphatase 1B from inactivation during H2O2 exposure.J Biol Chem. 2017 Sep 1;292(35):14371-14380. doi: 10.1074/jbc.M117.793745. Epub 2017 Jul 6. J Biol Chem. 2017. PMID: 28684416 Free PMC article.
-
Selective activation of oxidized PTP1B by the thioredoxin system modulates PDGF-β receptor tyrosine kinase signaling.Proc Natl Acad Sci U S A. 2013 Aug 13;110(33):13398-403. doi: 10.1073/pnas.1302891110. Epub 2013 Jul 30. Proc Natl Acad Sci U S A. 2013. PMID: 23901112 Free PMC article.
-
Qualitative Differences in Protection of PTP1B Activity by the Reductive Trx1 or TRP14 Enzyme Systems upon Oxidative Challenges with Polysulfides or H2O2 Together with Bicarbonate.Antioxidants (Basel). 2021 Jan 14;10(1):111. doi: 10.3390/antiox10010111. Antioxidants (Basel). 2021. PMID: 33466723 Free PMC article.
-
Reactive oxygen species as mediators of cell adhesion.Ital J Biochem. 2003 Mar;52(1):28-32. Ital J Biochem. 2003. PMID: 12833635 Review.
-
Endogenous electrophiles and peroxymonocarbonate can link tyrosine phosphorylation cascades with the cytosolic TXNRD1 selenoprotein and the KEAP1/NRF2 system.Curr Opin Chem Biol. 2024 Dec;83:102522. doi: 10.1016/j.cbpa.2024.102522. Epub 2024 Sep 6. Curr Opin Chem Biol. 2024. PMID: 39243480 Review.
Cited by
-
Redox regulation of PTPN22 affects the severity of T-cell-dependent autoimmune inflammation.Elife. 2022 May 19;11:e74549. doi: 10.7554/eLife.74549. Elife. 2022. PMID: 35587260 Free PMC article.
-
Ten "Cheat Codes" for Measuring Oxidative Stress in Humans.Antioxidants (Basel). 2024 Jul 22;13(7):877. doi: 10.3390/antiox13070877. Antioxidants (Basel). 2024. PMID: 39061945 Free PMC article. Review.
-
Piperlongumine Inhibits Thioredoxin Reductase 1 by Targeting Selenocysteine Residues and Sensitizes Cancer Cells to Erastin.Antioxidants (Basel). 2022 Apr 4;11(4):710. doi: 10.3390/antiox11040710. Antioxidants (Basel). 2022. PMID: 35453395 Free PMC article.
-
Carbon dioxide inhibits COVID-19-type proinflammatory responses through extracellular signal-regulated kinases 1 and 2, novel carbon dioxide sensors.Cell Mol Life Sci. 2021 Dec;78(24):8229-8242. doi: 10.1007/s00018-021-04005-3. Epub 2021 Nov 6. Cell Mol Life Sci. 2021. PMID: 34741187 Free PMC article.
-
Mechanisms of Mitochondrial ROS Production in Assisted Reproduction: The Known, the Unknown, and the Intriguing.Antioxidants (Basel). 2020 Sep 29;9(10):933. doi: 10.3390/antiox9100933. Antioxidants (Basel). 2020. PMID: 33003362 Free PMC article. Review.
References
-
- Andersen J. N., Mortensen O. H., Peters G. H., Drake P. G., Iversen L. F., Olsen O. H., Jansen P. G., Andersen H. S., Tonks N. K., and Møller N. P. (2001) Structural and evolutionary relationships among protein tyrosine phosphatase domains. Mol. Cell. Biol. 21, 7117–7136 10.1128/MCB.21.21.7117-7136.2001 - DOI - PMC - PubMed
Publication types
MeSH terms
Substances
Grants and funding
LinkOut - more resources
Full Text Sources
Research Materials
Miscellaneous
