. 2019 Jun 13;10(1):2586.
doi: 10.1038/s41467-019-10556-8.

Environmental pH and peptide signaling control virulence of Streptococcus pyogenes via a quorum-sensing pathway

Affiliations

Environmental pH and peptide signaling control virulence of Streptococcus pyogenes via a quorum-sensing pathway

Hackwon Do et al. Nat Commun. .

Abstract

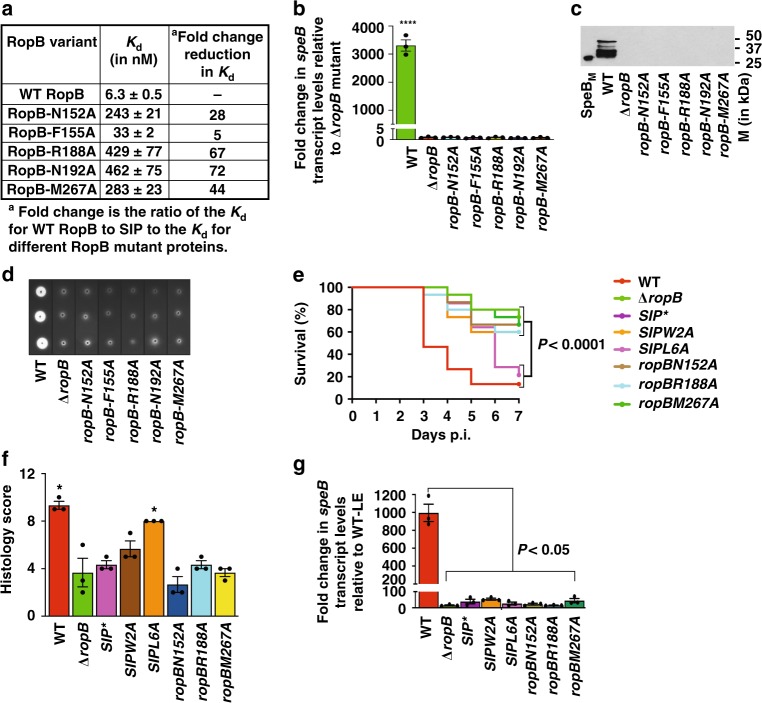
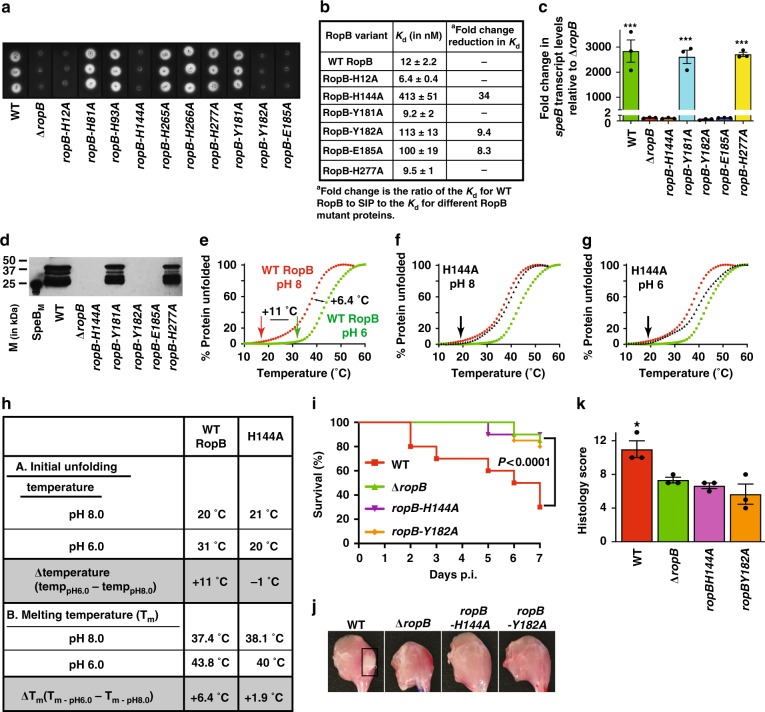
Bacteria control gene expression in concert with their population density by a process called quorum sensing, which is modulated by bacterial chemical signals and environmental factors. In the human pathogen Streptococcus pyogenes, production of secreted virulence factor SpeB is controlled by a quorum-sensing pathway and environmental pH. The quorum-sensing pathway consists of a secreted leaderless peptide signal (SIP), and its cognate receptor RopB. Here, we report that the SIP quorum-sensing pathway has a pH-sensing mechanism operative through a pH-sensitive histidine switch located at the base of the SIP-binding pocket of RopB. Environmental acidification induces protonation of His144 and reorganization of hydrogen bonding networks in RopB, which facilitates SIP recognition. The convergence of two disparate signals in the SIP signaling pathway results in induction of SpeB production and increased bacterial virulence. Our findings provide a model for investigating analogous crosstalk in other microorganisms.


Conflict of interest statement

The authors declare no competing interests.

Figures

Fig. 1
Fig. 1
Environmental acidification controls speB expression. a Wild-type (WT) GAS was grown in THY broth, samples were collected at the indicated time points, and growth medium pH, speB transcript levels, and absorption at wavelength 600 nm (A600) were determined. Right Y-axes represent fold-change in speB transcript levels (red) and A600 (green). Fold-changes in transcript levels at indicated time points relative to starting culture (time point t= 0 h) are shown. Data are mean + standard deviation for three biological replicates. b WT GAS was grown in THY to late-exponential growth phase (LE, A600 ~1.5), harvested by centrifugation, suspended in fresh THY adjusted to indicated pH and incubated for 1 h. The fold-change in speB transcript levels relative to WT-LE growth is shown. P values (*P< 0.5, ***P< 0.001) of the indicated samples relative to WT LE growth are shown. c Gross analyses of hindlimb lesions collected at 24 h postinfection from mice infected with 1 × 107 CFUs of each indicated strain. Larger lesion with extensive tissue damage in WT-infected mice in pH 6 is boxed (black box). d Histopathology scores of mouse muscle tissue infected with each indicated strain (n = 3 per strain). Data are mean + standard deviation. P values (n.s. = not significant) of the indicated strains were compared to WT GAS in pH 8. e Twenty mice were infected intramuscularly and mean colony-forming units (CFUs) recovered from the infected muscle tissue are shown. n.s indicates no statistical significance (P > 0.05). Data graphed are mean ± standard deviation. f Analysis of the speB transcript level in the intramuscular lesions from mice infected with indicated strains. Samples were collected at 24 h postinoculation from the lesions (n = 4 per strain) and analyzed in triplicate by qRT-PCR. The speB transcript levels in WT-LE (A600 ~1.5) was used as a reference and fold-changes in speB transcript levels relative to the reference are shown. P values (****P < 0.0001) of the indicated strains were compared to WT GAS in pH 6. P values were determined by t test
Fig. 2
Fig. 2
Environmental pH controls speB expression via SIP signaling pathway. a The SIP* mutant strain was grown to early stationary phase (STAT, A600 ~1.7) and harvested by centrifugation. Bacteria were suspended in THY broth adjusted to indicated pH, supplemented with synthetic SIP and incubated for 1 h. The fold-changes in speB transcript levels relative to the unsupplemented SIP* mutant strain are shown. P values (***P< 0.001) of the indicated samples were compared to unsupplemented GAS growth. P values were determined by t test. The amino acid sequence of the synthetic peptide SIP is shown in the inset. b Confocal microscopy images of isogenic SIP* mutant strain either unsupplemented or supplemented with indicated synthetic peptides in medium adjusted to indicated pH. For each sample, bright field, fluorescence field, merged images, and magnified views are shown. c The SIP* mutant strain was grown to STAT phase (A600 ~1.7). Cells were transferred to THY broth adjusted to indicated pH and supplemented with either the indicated synthetic peptide or the carrier for the synthetic peptides (DMSO). After 1 h incubation, fluorescence measurements were obtained from clarified cell lysates using excitation and emission wavelengths of 480 and 520 nm, respectively. The changes in relative fluorescence units relative to the unsupplemented isogenic SIP* mutant strain are shown. The amino acid sequence of the synthetic peptide SIP with fluorescein modification at its amino-terminus (FITC-SIP) is shown in the inset. d RopB–SIP-binding constants assessed in binding buffer adjusted to indicated pH. e The relationship between pH and the ratio of cFSE intensities at wavelength 490 to 438 nm. The calibration curve with observed fluorescence ratio between fluorescence intensities at wavelength 490 to 435 nm in buffers adjusted to indicated pH (black triangles) is shown. The ratio of fluorescence intensities at wavelength 490 to 435 nm for cFSE-loaded GAS incubated in buffers adjusted to indicated pH are marked on the calibration curve (red circles). f The calculated GAS intracellular pH values in each tested extracellular pH values as determined by the equation derived from the calibration curve
Fig. 3
Fig. 3
Molecular mechanism of SIP recognition by RopB. a Ribbon diagram of RopB–CTD dimer bound to SIP. Individual subunits of the dimer molecule are color-coded (blue and green). The 2Fo–Fc electron density map of SIP contoured at 1σ is shown. The SIP-binding pocket is boxed and labeled. The N- and C-termini of one subunit is marked as N and C, respectively. b Close up view of the interactions between RopB–CTD and SIP. SIP is shown as pink sticks and the eight amino acids of SIP are labeled. The SIP-interacting amino acid residues in RopB that are included in the mutational analyses from different subunits are colored in green and blue, respectively. The other SIP-contacting amino acid residues in RopB are colored in gray. The α-helices in RopB that form the SIP-binding pocket are labeled. c RopB–SIP-binding constants for synthetic SIP variants containing single alanine replacements at each position. d Analysis of the speB regulatory activity of synthetic SIP variants. The amino acid sequences of the synthetic peptides used in the experiment are shown in the inset. Scrambled peptide (SCRA) was used as a negative control. The SIP* mutant strain supplemented with DMSO was used as a reference and fold-changes in speB transcript levels relative to the reference are shown. P values (***P< 0.001, *P< 0.05) of the indicated samples were compared to SIP* mutant strain supplemented with WT SIP. e Western immunoblot analysis of secreted SpeB from indicated samples. Cell growth and synthetic peptide supplementation were performed as described in panel (d). Cell-free growth media (THY medium) were probed with anti-SpeB polyclonal rabbit antibody, and detected by chemiluminescence. The masses of molecular weight markers (M) in kilodaltons (kDa) are marked. Characterization of SIP mutant strains for speB gene transcript levels (f), secreted SpeB levels (g), and SpeB protease activity detected by casein plate assay (h). P values (****P< 0.0001) of the indicated strains were compared to SIP* mutant strain. P values were determined by t-test. Source data for panels (d) and (g) are provided as a Source Data file
Fig. 4
Fig. 4
SIP-contacting residues in RopB are crucial for speB expression. a RopB–SIP-binding constants for recombinant RopB mutant proteins containing single alanine replacements in SIP-contacting amino acid residues. Characterization of isogenic ropB mutant strains for (b) speB gene transcript levels, (c) immunoreactive secreted SpeB levels, and (d) SpeB protease activity. P values (****P< 0.0001) of the indicated strains were compared to ∆ropB mutant strain. P values were determined by t test. Source data are provided as a Source Data file. e Twenty outbred CD-1 mice per strain were injected intramuscularly with 1 × 107 CFUs of each indicated strain. Kaplan–Meier survival curve with P values derived by log rank-test are shown. f Histopathology scores of hindlimb lesions from mice infected with each indicated strain. Histopathology analysis of the infected hindlimbs was performed at 48 h post-inoculation. Data are expressed as means + standard deviation. P values (*P< 0.05) of the indicated strains were compared to isogenic ∆ropB mutant strain. P values were determined by t test. g Analysis of the speB transcript level in the intramuscular lesions from mice infected with indicated strains. Samples were collected 24 h postinoculation from the lesions (n = 5 per strain) and analyzed in triplicate by qRT-PCR. The speB transcript levels in wild-type GAS grown in THY to late-exponential growth phase (WT-LE, A600 ~1.5) was used as a reference and fold-changes in speB transcript levels relative to the reference are shown. P values were determined by t test
Fig. 5
Fig. 5
A histidine switch in RopB senses environmental pH. a Individual subunits of RopB–CTD dimer are color-coded in dark and light gray. The N- and C-termini of one subunit is marked as N and C, respectively. The two SIP-binding pockets in each subunit of a RopB–CTD dimer are circled (dotted lines). The green line connecting the two SIP-binding pockets indicates the location of the base of the SIP-binding pocket. SIP located in the peptide-binding pockets of the RopB–CTD dimer are shown as sticks and colored in cyan. The main chain atoms of surface-exposed histidines in one subunit of RopB–CTD are shown as green spheres and labeled. The side chains of H144, Y176, Y182’, and E185’ located at the base of the SIP-binding pocket for each subunit of a RopB–CTD dimer are shown as spheres and boxed in red rectangle (and in panel b). The ‘ indicates the amino acid residue from the second subunit of a RopB–CTD dimer. The side chains of the amino acid residues involved in intramolecular interactions from two subunits of a RopB–CTD dimer are color-coded in orange and purple, respectively. b A magnified view of the intramolecular interactions at the base of SIP-binding pocket of RopB in the boxed area (red) in panel a. The side chains of H144, Y176, Y182’, and E185’ located at the base of the SIP-binding pocket for each subunit of a RopB–CTD dimer are shown as sticks and the side chains from two subunits are color-coded in orange and purple, respectively. The amino acid residues from the second subunit of RopB–CTD dimer are indicated by ’. The distances (in angstroms, Å) between the amino acid residues are shown
Fig. 6
Fig. 6
The histidine switch in RopB is critical for speB expression and GAS virulence. a SpeB protease activity made by each isogenic ropB mutant strain. b RopB–SIP-binding constants for the indicated recombinant RopB mutant proteins. Characterization of ropB mutant strains for speB transcript levels (c), and secreted SpeB levels (d). P values (***P< 0.001) of the indicated strains were compared to ∆ropB mutant strain. P values were determined by t-test. Source data are provided as a Source Data file. e Thermal stability of WT RopB was determined by a thermofluor assay. Thermal shift assay results for WT RopB in below (pH 6, colored green) and above neutral pH (pH 8, colored red) are shown. The temperature at which initial unfolding of WT RopB occurs are marked by vertical arrows and color coded. The horizontal two-headed arrows indicate the differences in melting temperatures (Tm) and in temperatures at which initial unfolding occurs between below and above neutral pH. The thermal stability curves of H144A mutant protein in above (pH 8) (f) and below (pH 6) (g) neutral pH are overlaid onto the thermal stability curves of WT RopB and colored in black. The temperature at which initial unfolding of H144A mutant protein occurs is marked by black vertical arrows. h Comparison of thermal shift assay results of WT RopB and H144A mutant protein. i Twenty outbred CD-1 mice per strain were injected intramuscularly with 1 × 107 CFUs of each indicated bacterial strain. Kaplan–Meier survival curve with P values derived by log rank-test are shown. j Analyses of gross hindlimb lesions from mice infected with each indicated strain. Analysis of the infected hindlimbs was performed at 48 h postinoculation. Larger lesion with extensive tissue damage in WT-infected mice in pH 6 is boxed (black box). k Histopathology scores of hindlimb lesions from mice infected with each indicated strain. Histopathology analysis of the infected hindlimbs was performed at 48 h postinoculation. Data are expressed as means + standard deviation. P values (*P< 0.05) relative to ∆ropB mutant strain are shown. P values were determined by t test
Fig. 7
Fig. 7
Model of GAS virulence regulation by environmental pH and SIP. At low-bacterial population density and near-neutral environmental pH (left panel), the deprotonated side chain of H144 destabilizes the intramolecular interactions with Y176, Y182’, and E185’. The weakened interactions at the base of the SIP-binding pocket inhibit high-affinity RopB–SIP interactions resulting in defective RopB–DNA interactions and decreased RopB-dependent transcription activation of SIP and speB. At high-population density (right panel), environmental pH decreases to pH 5.5, resulting in acidification of the GAS cytosol. When the intracellular pH becomes closer to the pKa of histidine (pH ~6.2), the protonated side chain of RopB H144 facilitates the interactions with Y176, Y182’, and E185’. The stabilized intramolecular interactions at acidic pH promote high-affinity RopB–SIP interactions. The high-affinity RopB–DNA interactions and RopB polymerization aided by SIP binding leads to upregulation of SIP expression, which then triggers robust induction of SIP production by a positive feedback mechanism. Finally, SIP-dependent upregulation of speB results in secretion of SpeB zymogen (SpeBZ). The acidified extracellular environment promotes rapid maturation of SpeBZ to SpeBM, and maximal protease activity of SpeBM, facilitating disease progression by cleaving various host and GAS proteins

Similar articles

Cited by

References

    1. Beavers WN, Skaar EP. Neutrophil-generated oxidative stress and protein damage in Staphylococcus aureus. Pathog. Dis. 2016;74:ftw060–ftw060. doi: 10.1093/femspd/ftw060. - DOI - PMC - PubMed
    1. Hood MI, Skaar EP. Nutritional immunity: transition metals at the pathogen–host interface. Nat. Rev. Microbiol. 2012;10:525–537. doi: 10.1038/nrmicro2836. - DOI - PMC - PubMed
    1. De Bernardis F, Mühlschlegel FA, Cassone A, Fonzi WA. The pH of the host niche controls gene expression in and virulence of Candida albicans. Infect. Immun. 1998;66:3317–3325. - PMC - PubMed
    1. Fang FC, Frawley ER, Tapscott T, Vázquez-Torres A. Bacterial stress responses during host infection. Cell Host Microbe. 2016;20:133–143. doi: 10.1016/j.chom.2016.07.009. - DOI - PMC - PubMed
    1. Sanson M, et al. Adhesin competence repressor (AdcR) from Streptococcus pyogenes controls adaptive responses to zinc limitation and contributes to virulence. Nucl. Acids Res. 2015;43:418–432. doi: 10.1093/nar/gku1304. - DOI - PMC - PubMed

Publication types