. 2019 Jun 13;10(1):2585.
doi: 10.1038/s41467-019-10564-8.

Layer-specific integration of locomotion and sensory information in mouse barrel cortex

Affiliations

Layer-specific integration of locomotion and sensory information in mouse barrel cortex

Aslı Ayaz et al. Nat Commun. .

Abstract

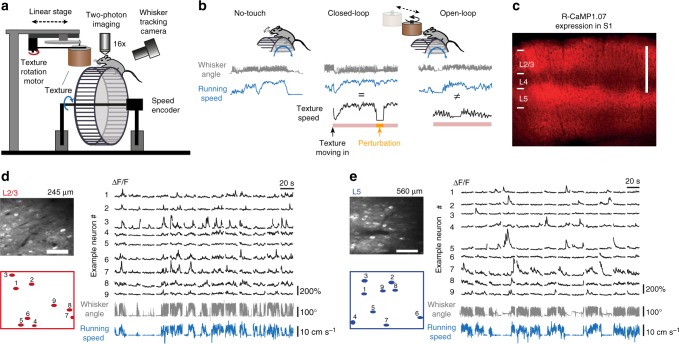
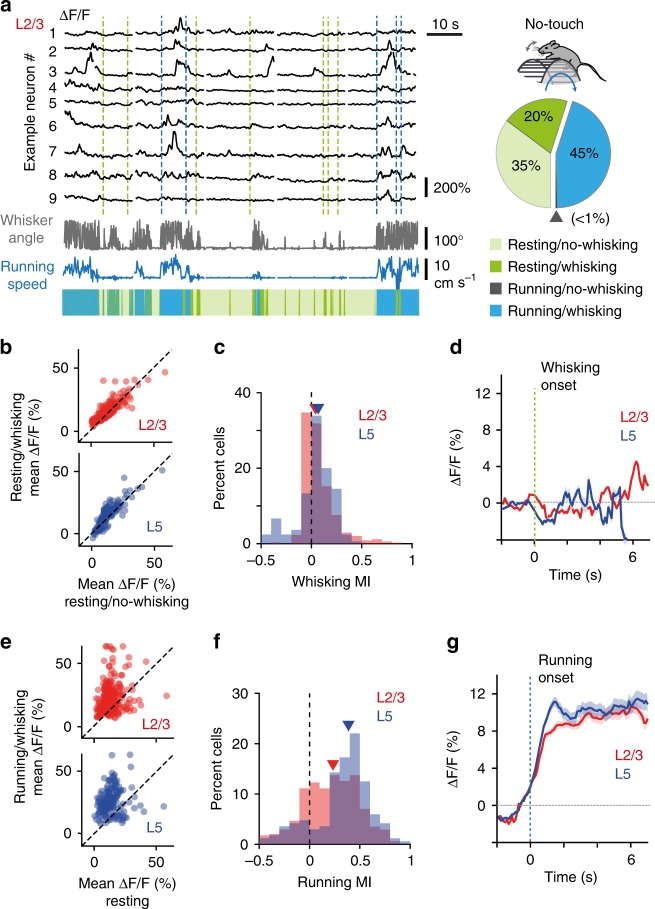
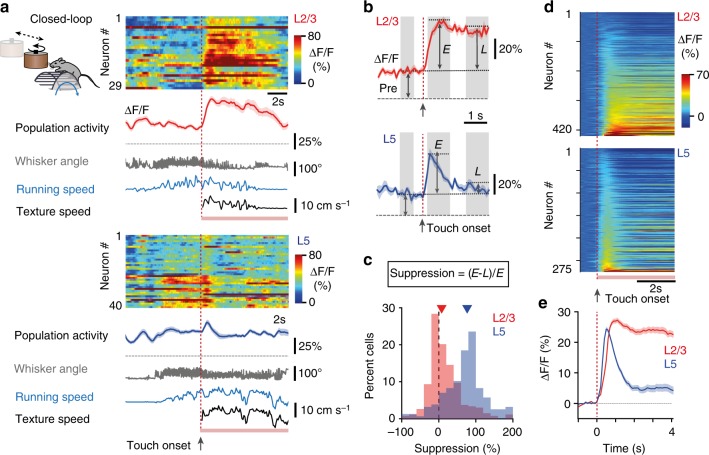
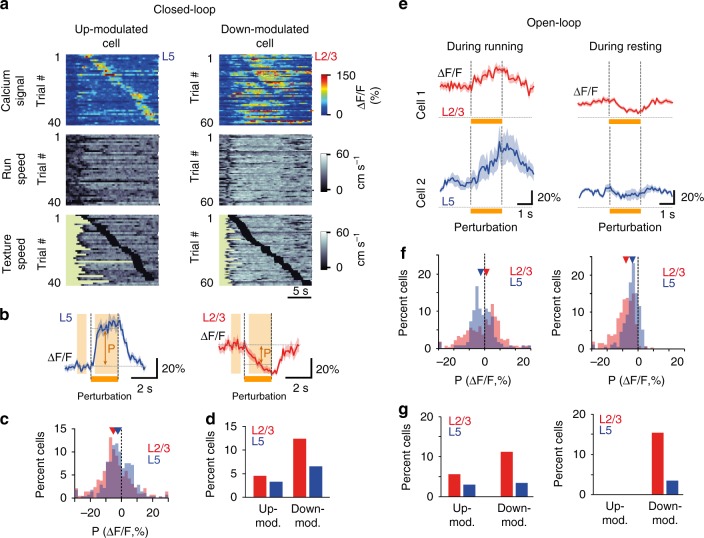
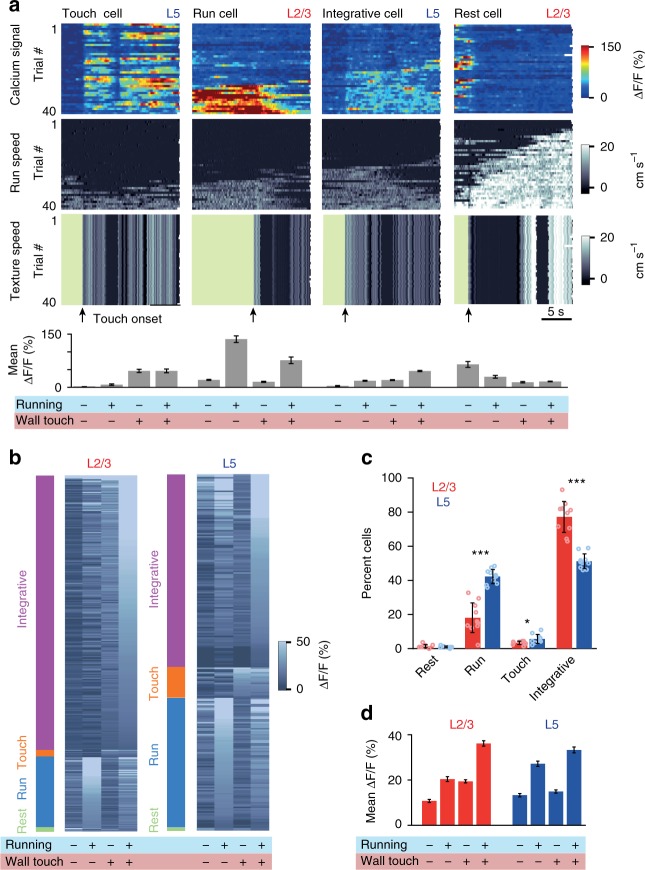
During navigation, rodents continually sample the environment with their whiskers. How locomotion modulates neuronal activity in somatosensory cortex, and how it is integrated with whisker-touch remains unclear. Here, we compared neuronal activity in layer 2/3 (L2/3) and L5 of barrel cortex using calcium imaging in mice running in a tactile virtual reality. Both layers increase their activity during running and concomitant whisking, in the absence of touch. Fewer neurons are modulated by whisking alone. Whereas L5 neurons respond transiently to wall-touch during running, L2/3 neurons show sustained activity. Consistently, neurons encoding running-with-touch are more abundant in L2/3 and they encode the run-speed better during touch. Few neurons across layers were also sensitive to abrupt perturbations of tactile flow during running. In summary, locomotion significantly enhances barrel cortex activity across layers with L5 neurons mainly reporting changes in touch conditions and L2/3 neurons continually integrating tactile stimuli with running.


Conflict of interest statement

The authors declare no competing interests.

Figures

Fig. 1
Fig. 1
Calcium imaging in L2/3 and L5 of mouse barrel cortex during various running and whisking conditions. a Schematic of virtual reality setup with a head-restrained mouse on top of a rung-ladder treadmill. A sandpaper-covered cylinder (texture) can be moved in contact with the whiskers. Run speed is tracked with an encoder and the mean whisker angle is monitored with a high-speed video camera. b Example traces of whisker angle (gray), run speed (blue), and texture-rotation speed (black), illustrating the three experimental conditions: ‘No-touch’, ‘Closed-loop’, and ‘Open-loop’. The pink bottom bar indicates when the texture contacts the whiskers. The orange segment highlights the intermittent halt of texture-rotation to introduce a brief perturbation period in Closed-loop trials by uncoupling run speed and texture speed. c Confocal image of virally-induced R-CaMP1.07 expression pattern in a coronal slice of somatosensory cortex of a wild-type mouse. Scale bar is 500 µm. d Left: In vivo two-photon image of R-CaMP1.07-expressing L2/3 neurons with selected ROIs below (scale bar, 50 µm). Right: ΔF/F calcium transients of nine example neurons with simultaneously recorded mean whisker angle (gray) and running speed (blue) below. e Same as in (d) but for example L5 neurons in S1
Fig. 2
Fig. 2
Running with concomitant whisking increases L2/3 and L5 activity more than whisking alone. a Left: Example ΔF/F traces along with whisker angle and running speed in the initial No-touch trials of Fig. 1d. The four possible running and whisking state conditions are color-coded. Green and blue vertical dotted lines mark whisking onset (only during resting periods) and running onset, respectively. Right: Pie chart of the distribution of times spent in the four states for five mice (in the ‘No-touch’ condition). Gray triangle indicates <1% fraction of time spent in the running/no-whisking state. b Scatter plots of mean ΔF/F amplitude in resting/whisking periods versus resting/no-whisking periods for 342 L2/3 neurons (red) and 168 L5 neurons (blue). Dashed lines indicate unity lines. c Distribution of whisking modulation index (MI) for L2/3 and L5 neurons. Red and blue triangles indicate medians. d Population average of whisking-onset-aligned ΔF/F traces for all recorded neurons. e Scatter plots of mean ΔF/F amplitude in running/whisking periods versus resting periods for L2/3 (top) and L5 (bottom) neurons. f, g Analog plots to (c), (d) for running modulation index (MI) and running-onset-aligned ΔF/F traces
Fig. 3
Fig. 3
Wall touch during running evokes sustained responses in L2/3 and transient responses in L5. a Population dynamics in L2/3 (left) and L5 (right) neurons for two example trials under the Closed-loop condition. The heat map represents ΔF/F calcium transients in pseudo-color code. Below the heat maps the population mean ΔF/F trace (solid line, ±s.e.m.), whisker angle (gray), running speed (blue), and texture speed (black) are shown. Touch onsets are indicated by red vertical dotted lines; pink bars represent periods of texture contact. b Mean ΔF/F traces aligned to touch onset (red dotted line) for an example L2/3 and L5 neuron. Shaded areas indicate windows for analysis (pre-touch, ‘Pre’, −1 to −0.3 s; early, ‘E’, 0.3 to 1.3 s; late, ‘L’, 2 to 3 s). c Distribution of percent suppression as defined in the equation for L2/3 and L5 touch-responsive neurons. Arrowheads mark medians of 76.6% and 7.7%, respectively. d Heat maps representing touch onset responses of all L2/3 (top, n = 420) and L5 (bottom, n = 275) neurons in Closed-loop condition. Pre-touch activity was subtracted from calcium transients and neurons were sorted according to their ΔF/F responses in the early window, E. e Population averages (±s.e.m.) of touch-aligned ΔF/F traces for all touch-responsive neurons in L2/3 (red, n = 268/420) and L5 (blue, n = 157/275). Neurons were considered touch-responsive when E > 2σ, where σ is the minimum standard deviation (see Methods)
Fig. 4
Fig. 4
Touch-evoked responses under Open-loop condition. a Population dynamics in L2/3 (left) and L5 (right) neurons for two example trials under Open-loop condition. The heat map represents ΔF/F calcium transients in pseudo-color code. Below the population mean ΔF/F trace (solid line, ±s.e.m.) are whisker angle (gray), running speed (blue), and texture speed (black). Touch onsets are indicated by red vertical dotted lines; pink bars represent periods of texture contact; orange segment is the period where texture rotation is briefly stopped. Imaging field of views are the same as in Fig. 3a, with identical neuron numbers for L2/3. In L5 some neurons were not captured in the corresponding imaging session, hence the smaller number of neurons. b Of the touch-responsive neurons in Open-loop condition 255 of 342 L2/3 neurons and 177 of 236 L5 neurons had touch events during running. Heat maps show touch onset responses of these neurons in L2/3 (top) and L5 (bottom) during running. Initial white segments correspond to NaN values for neurons with very short pre-touch periods. c Population averages (±s.e.m.) of touch-aligned ΔF/F traces during running. d Distribution of percent suppression of touch responses during running. Mean suppression was 8.1 ± 2.9% and 44.1 ± 5.6% for L2/3 and L5 neurons, respectively (p = 1.3 × 10−16, Wilcoxon rank sum test). e Heat maps show touch responses that occurred during resting for the same neurons shown in (b). Neurons that did not have touch events during resting conditions are shown as white rows in heat maps. f Population averages (±s.e.m.) of touch-aligned ΔF/F traces during resting (245/342 L2/3 neurons, red, and 167/236 L5 neurons, blue). g Mean suppression was 6.4 ± 4.4% for L2/3 and 49.8 ± 6.3% for L5 neurons, respectively (p = 4.0 × 10−14, Wilcoxon rank sum test)
Fig. 5
Fig. 5
A subset of neurons responds to perturbations of tactile flow. a Calcium signals for two example neurons across multiple Closed-loop trials. Trials are sorted according to when the perturbation (2-s texture halt) occurred. Running speed and texture speed are plotted below with black periods marking stop of texture rotation. The left L5 neuron is an example of an up-modulated cell whereas the right L2/3 neuron exemplifies down-modulation upon perturbation. b Mean ΔF/F traces (±s.e.m.) aligned to perturbation onset for the example neurons in (a). ‘P’ indicates the amplitude of perturbation-induced modulation defined as the difference between mean ΔF/F values before (−1 to −0.3 s window) and during perturbation (+0.3 to 2 s, orange shaded areas). c Distribution of perturbation-induced modulation for all L2/3 (red, n = 420) and L5 (blue, n = 275) neurons. Triangles mark medians of −5.1% and −2.3% for L2/3 and L5 neurons, respectively. d Percentage of significantly up-modulated (P > 2σ) and down-modulated (P < −2σ) neurons in L2/3 and L5 populations, respectively, with σ denoting baseline noise (see Methods). e Perturbation responses of two example neurons in Open-loop condition, where sudden stalling of the texture rotation may occur during running (left panels) or resting (right panels). f Distribution of perturbation modulation (P) for neurons in L2/3 (red, n = 269) and L5 (blue, n = 234) neurons during running (left panel, mean P: −0.7 ± 0.7% and −1.7 ± 0.6% for L2/3 and L5; p < 0.05) and during resting (right panel, 253 L2/3 neurons, red, and 172 L5 neurons, blue; mean P: −9.2 ± 0.5% and −4.3 ± 0.4% for L2/3 and L5, respectively, p < 0.0001). Wilcoxon rank sum test was used for distribution comparisons. g Percentage of neurons that are significantly up-modulated (P > 2σ) and down-modulated (P < −2σ) for L2/3 (red) and L5 (blue) populations during running (left) and during resting state (right)
Fig. 6
Fig. 6
A higher fraction of neurons integrate locomotion and concurrent wall touch in L2/3 compared with L5. a Four example neurons with different response properties recorded during Open-loop stimulation. Each column presents data from a single neuron across trials in a single session. Top panel heat map shows ΔF/F calcium signal with each row representing a trial. Trials are sorted according to the mean run speed of a trial. Middle and bottom panels show the run speed and texture-rotation speed of corresponding trials. Green periods in the bottom panel indicate when the texture was not in contact with whiskers. Bar graphs at the bottom are mean ΔF/F activity during the four stimulus and movement conditions: no-touch/no-running, running/no-touch, touch/no-running, and touch/running. b Categorization of all L2/3 (n = 338, 5 mice) and L5 (n = 236, 4 mice) neurons according to their activity during their first Open-loop session. Color bars on the left show categories, gray scale shading shows mean ΔF/F at four stimulus/behavior conditions. Cells are sorted according to their mean activity during ‘running/wall touch’ condition relevant to their assigned category. c Normalized distributions of four response categories in L2/3 and L5 populations. Means and standard deviations are calculated from 10 random selections of 11 sessions out of total 24 recording sessions. (Two-sampled T-test is performed to compare distributions for each category prest = 0.2, prun = 5.7 × 10−7, ptouch = 0.02, pintegrative = 3.7 × 10−7.) d Average population responses for the four stimulus/movement conditions for L2/3 (in red) and L5 (in blue) neurons shown in (b) (mean ΔF/F ± s.e.m.)

Similar articles

Cited by

References

    1. Niell CM, Stryker MP. Modulation of visual responses by behavioral state in mouse visual cortex. Neuron. 2010;65:472–479. doi: 10.1016/j.neuron.2010.01.033. - DOI - PMC - PubMed
    1. Ayaz A, Saleem AB, Schölvinck ML, Carandini M. Locomotion controls spatial integration in mouse visual cortex. Curr. Biol. 2013;23:890–894. doi: 10.1016/j.cub.2013.04.012. - DOI - PMC - PubMed
    1. Erisken S, et al. Effects of locomotion extend throughout the mouse early visual system. Curr. Biol. 2014;24:2899–2907. doi: 10.1016/j.cub.2014.10.045. - DOI - PubMed
    1. Saleem AB, Ayaz A, Jeffery KJ, Harris KD, Carandini M. Integration of visual motion and locomotion in mouse visual cortex. Nat. Neurosci. 2013;16:1864–1869. doi: 10.1038/nn.3567. - DOI - PMC - PubMed
    1. Fu Y, et al. A cortical circuit for gain control by behavioral state. Cell. 2014;156:1139–1152. doi: 10.1016/j.cell.2014.01.050. - DOI - PMC - PubMed

Publication types