. 2019 Jun 13;10(1):2603.
doi: 10.1038/s41467-019-10525-1.

Identification of a genomic enhancer that enforces proper apoptosis induction in thymic negative selection

Affiliations

Identification of a genomic enhancer that enforces proper apoptosis induction in thymic negative selection

Miki Arai Hojo et al. Nat Commun. .

Abstract

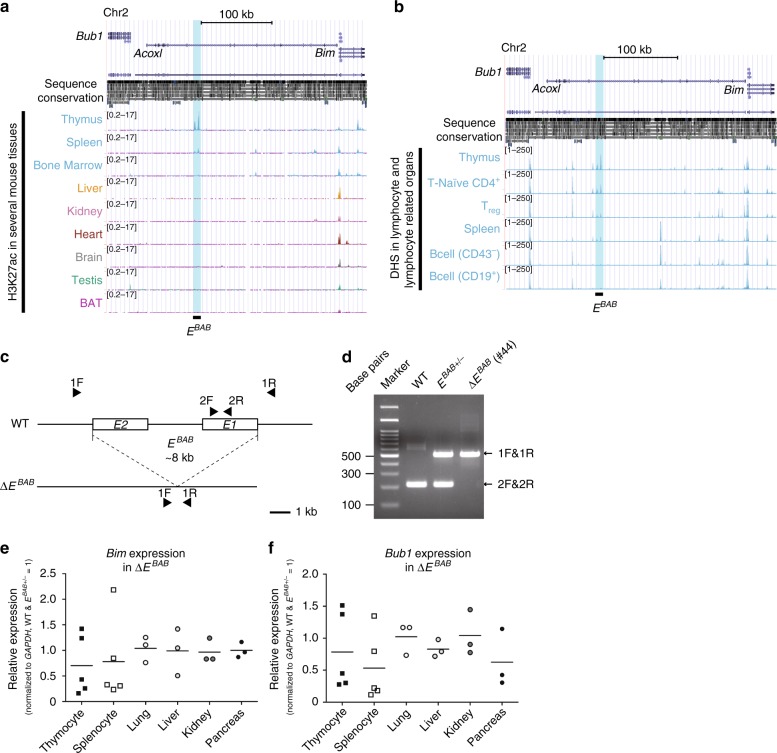
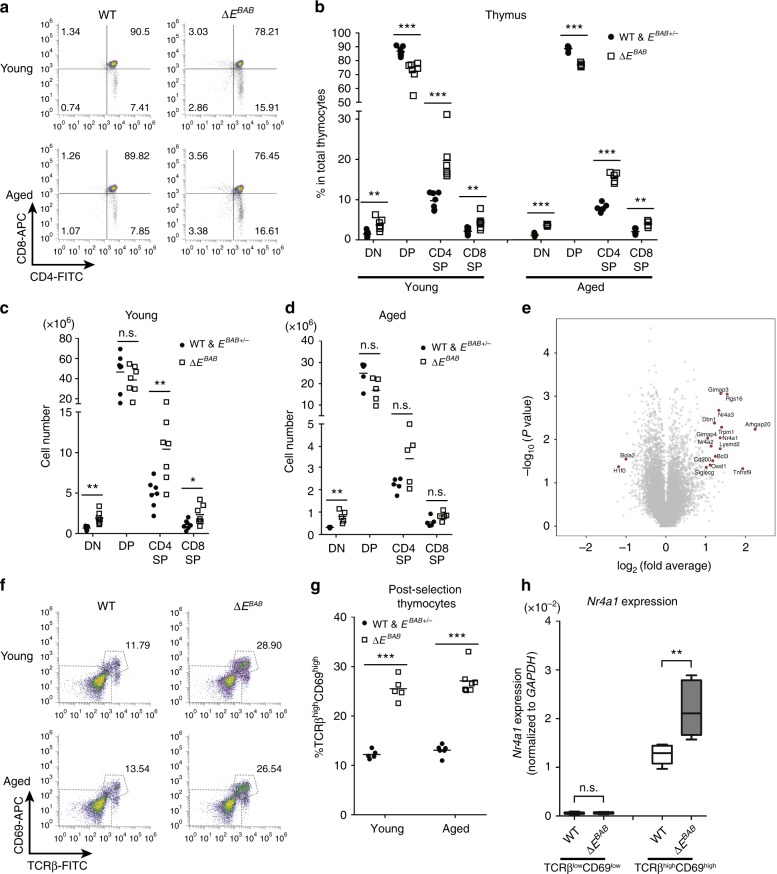
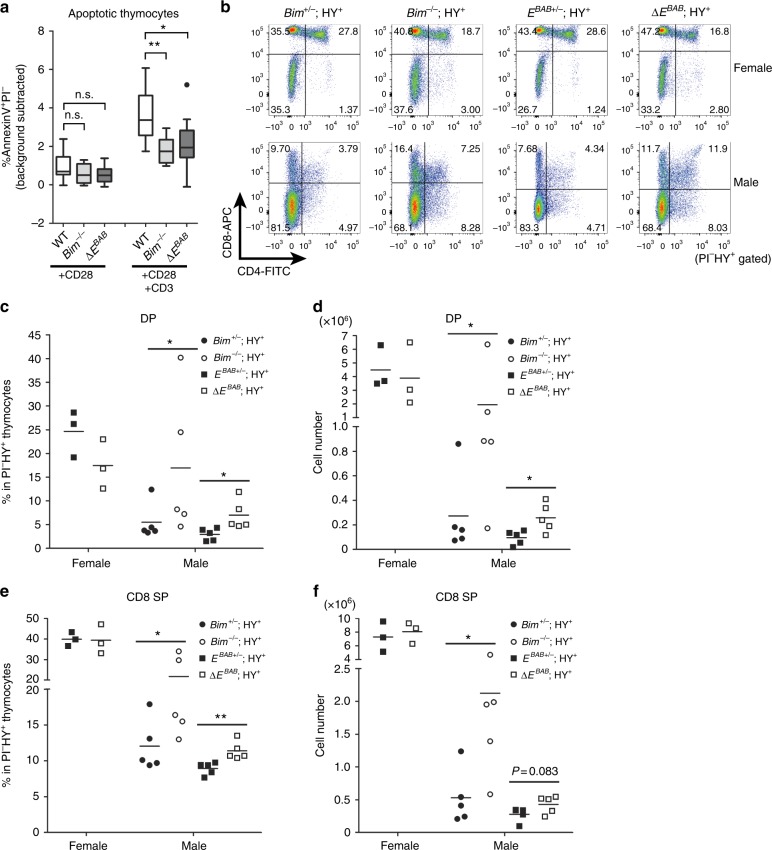
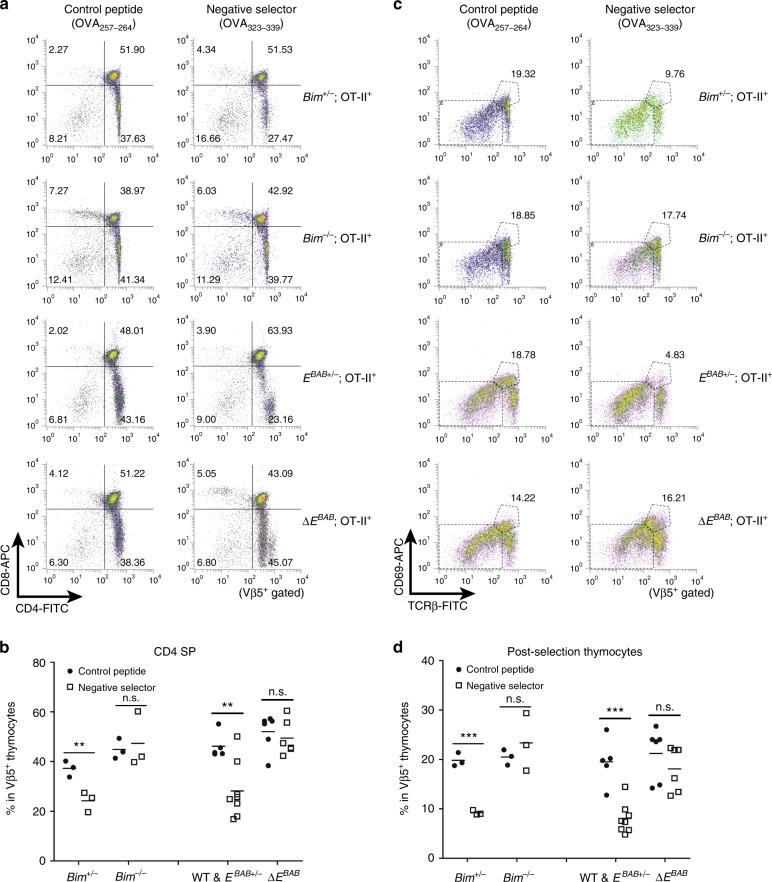
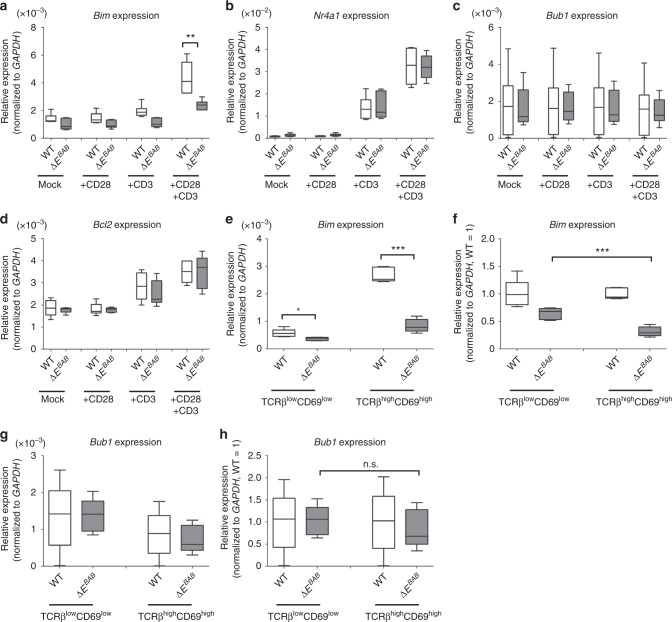
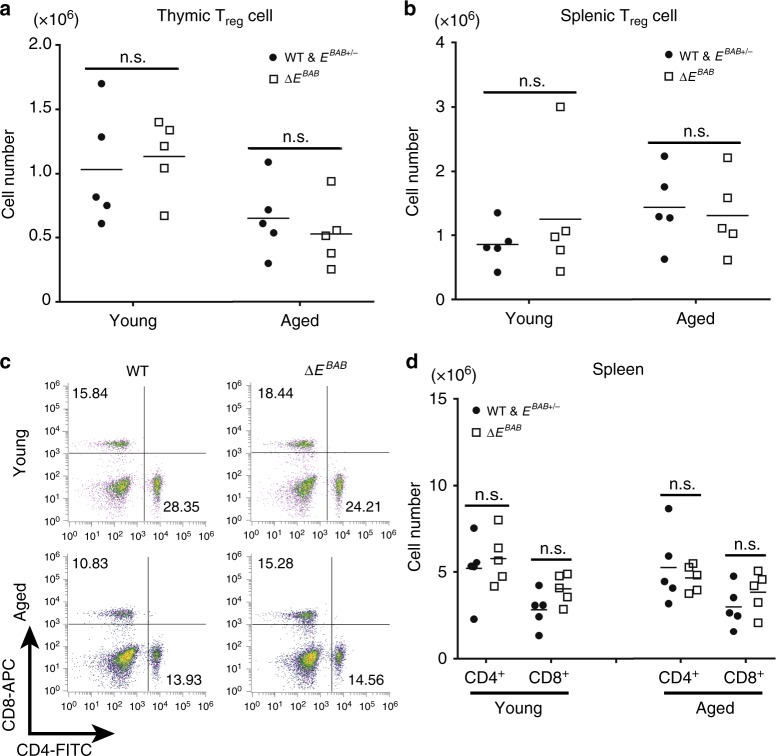
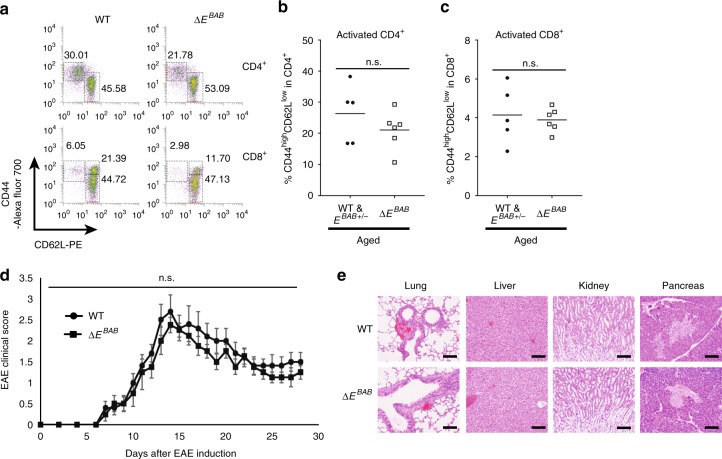
During thymic negative selection, autoreactive thymocytes carrying T cell receptor (TCR) with overtly strong affinity to self-MHC/self-peptide are removed by Bim-dependent apoptosis, but how Bim is specifically regulated to link TCR activation and apoptosis induction is unclear. Here we identify a murine T cell-specific genomic enhancer EBAB (Bub1-Acoxl-Bim), whose deletion leads to accumulation of thymocytes expressing high affinity TCRs. Consistently, EBAB knockout mice have defective negative selection and fail to delete autoreactive thymocytes in various settings, with this defect accompanied by reduced Bim expression and apoptosis induction. By contrast, EBAB is dispensable for maintaining peripheral T cell homeostasis via Bim-dependent pathways. Our data thus implicate EBAB as an important, developmental stage-specific regulator of Bim expression and apoptosis induction to enforce thymic negative selection and suppress autoimmunity. Our study unravels a part of genomic enhancer codes that underlie complex and context-dependent gene regulation in TCR signaling.


Conflict of interest statement

The authors declare no competing interests.

Figures

Fig. 1
Fig. 1
Identification of a T cell-specific cis-regulatory element EBAB. a ChIP-seq visualization of H3K27ac in several mouse tissues. H3K27ac profiles from the thymus, spleen, bone marrow, liver, kidney, heart, brain, testis, and brown adipose tissues (BAT) are visualized using the UCSC genome browser (mm9). The EBAB region is highlighted. b DNase hypersensitivity sites (DHS) in the same locus shown in (a). DHS profiles from the thymus, T-Naïve CD4+, regulatory T (Treg) cells, spleen, and B cells (CD43 or CD19+) are visualized using the UCSC genome browser (mm9). The EBAB region is highlighted. c Schematic representation of ΔEBAB. Arrowheads indicate the primers listed in Supplementary Data 1. d Genomic PCR against the EBAB locus of WT, heterozygotes (EBAB+/−), and ΔEBAB mice. A representative gel-image of founder #44-derived DNAs is shown. See also Supplementary Fig. 2 for the results from #47- and #50-derived DNAs. e, f qPCR analysis for Bim (e) and Bub1 (f) on thymocytes, splenocytes, lung, liver, kidney, and pancreas. Data are pooled from five independent experiments (thymocyte, splenocyte; n = 5 WT and EBAB+/−–ΔEBAB littermate pairs, 7–17 weeks old, mean ± s.d.) or three independent experiments (lung, liver, kidney, pancreas; n = 3 WT & EBAB+/−–ΔEBAB littermate pairs, 10–17 weeks old). Each symbol represents an individual mouse; small horizontal lines indicate the mean. No statistically significant differences between WT and EBAB+/− and ΔEBAB were detected (P ≥ 0.05; unpaired two-tailed Student’s t test)
Fig. 2
Fig. 2
The ΔEBAB thymus accumulates high affinity TCR clones. a Flow cytometric analysis of CD4 versus CD8 thymocyte populations. Data are representative of seven independent experiments (Young; n = 7 WT and EBAB+/−–ΔEBAB littermate pairs, 7–17 weeks old) or five independent experiments (Aged; n = 5 WT & EBAB+/−–ΔEBAB littermate pairs, 30–36 weeks old). bd Double negative (DN), double positive (DP), CD4 single positive (SP), and CD8 SP thymocyte proportions of young and aged mice (b), and cell numbers of young (c) and aged (d) mice. Data are pooled from seven independent experiments (Young; n = 7 WT and EBAB+/−–ΔEBAB littermate pairs, 7–17 weeks old) or five independent experiments (Aged; n= 5 WT and EBAB+/-–ΔEBAB littermate pairs, 30–36 weeks old). e Scatter plot (log2 fold change versus –log10 P value) of genes analyzed by RNA-seq (n = 2 WT and EBAB+/−–ΔEBAB littermate pairs, 10–11 weeks old). Genes showing more than twofold changes with P < 0.05 (unpaired two-tailed Student’s t test) are highlighted. f Flow cytometric analysis of TCRβ versus CD69 thymocyte populations. Data are representative of five independent experiments (Young; n = 5 WT and EBAB+/−–ΔEBAB littermate pairs, 9–12 weeks old, Aged; n = 6 WT and EBAB+/− mice and n = 7 ΔEBAB mice from WT and EBAB+/−–ΔEBAB littermate pairs and trios, 30–36 weeks old). g Post-selection (TCRβhighCD69high) thymocyte proportion of young and aged mice. Data are pooled from five independent experiments (Young; n = 5 WT and EBAB+/−–ΔEBAB littermate pairs, 9–12 weeks old, Aged; n = 6 WT and EBAB+/− mice, n = 7 ΔEBAB mice, WT and EBAB+/−–ΔEBAB littermate pair or trio, 30–36 weeks old). h qPCR analysis for Nr4a1 in pre-selection (TCRβlowCD69low) and post-selection thymocytes of WT and ΔEBAB. Data are pooled from five independent experiments (n = 5 sex-matched WT–ΔEBAB pairs, 10–18 weeks old, mean ± s.d.). Edges of the box are the 25th and 75th percentiles, and error bars extend to the maximum and minimum. Each symbol in (b, c, d, g) represents an individual mouse; small horizontal lines indicate the mean. n.s. not significant (P ≥ 0.05); *P < 0.05, **P < 0.01, ***P < 0.001 (unpaired two-tailed Student’s t test)
Fig. 3
Fig. 3
EBAB contributes to depletion of high affinity TCR clones in ex vivo TCR stimulation and the HY tg models. a Annexin V+Propidium Iodide (PI) fraction of total thymocytes stimulated with anti-CD3 and anti-CD28 antibodies (10 µg/ml) for 9 h. The percentage in mock sample (i.e., background) is subtracted. Data are pooled from 11 independent experiments (n = 3 WT–ΔEBAB littermate pairs, n = 3 sex-matched WT–ΔEBAB pairs, n = 1 WT–Bim−/− littermate pair, n = 1 sex-matched WT–Bim−/− pair, n = 3 sex-matched WT–Bim−/−–ΔEBAB trios, 5–20 weeks old). Edges of the box are the 25th and 75th percentiles, and error bars extend to the maximum and minimum. Outliers are defined as the data point that is located outside of q3 + 1.5(q3 − q1) and q1 − 1.5(q3 − q1), in which q1 and q3 are the 25th and 75th percentiles. b CD4 versus CD8 flow cytometric analysis of PIHY-TCR+ thymocytes from female and male HY tg mice. The number in the plot is representative percentage of each gate. cd DP thymocyte proportion (c) and cell numbers (d) of PIHY-TCR+ thymocytes from female and male HY tg mice. e, f CD8 SP thymocyte proportion (e) and cell numbers (f) of PIHY-TCR+ thymocytes from female and male HY tg mice. Data are representative of (b), or pooled from (cf), six independent experiments (n = 1 Bim+/−; HY+ and Bim−/−; HY+ female mice, n = 5 Bim+/−; HY+ and Bim/−; HY+ male mice, n = 3 EBAB+/−; HY+ and ΔEBAB; HY+ female mice, n = 5 EBAB+/−; HY+ and ΔEBAB; HY+ male mice, 6–8 weeks old). Each symbol in (cf) represents an individual mouse; small horizontal lines indicate the means. n.s. not significant (P ≥ 0.05); *P < 0.05, **P < 0.01 (unpaired one-tailed Student’s t test or Mann–Whitney U test for Bim KO data, and unpaired two-tailed Student’s t test for ΔEBAB data)
Fig. 4
Fig. 4
EBAB is essential for depleting high affinity TCR clones in the OT-II tg model. a CD4 versus CD8 flow cytometric analysis of TCR Vβ5+ thymocytes from mice injected with OVA257–264 or OVA323–229 peptide intraperitoneally. The number in the plot is representative percentage of each gate. b CD4 SP thymocyte proportion of TCR Vβ5+ thymocytes from mice treated as in Fig. 4a. c TCRβ versus CD69 flow cytometric analysis of TCR Vβ5+ thymocytes from mice treated as in Fig. 4a. The number in the plot is representative percentage of the gate. d Post-selection (TCRβhighCD69high) thymocyte proportion of TCR Vβ5+ thymocytes from mice treated as in Fig. 4a. Data are representative of (a, c) or pooled from (b, d) 13 independent experiments (n = 5 WT and EBAB+/− mice injected with OVA257–264 peptide, n = 8 WT and EBAB+/−; OT-II+ mice injected with OVA323–339 peptide, n = 6 ΔEBAB; OT-II+ mice injected with OVA257–264 and OVA323–339 peptide, n = 3 Bim+/−; OT-II+ and Bim−/−; OT-II+ mice injected with each peptide, 5–14 weeks old). Each symbol (b, d) represents an individual mouse; small horizontal lines indicate the mean. n.s. not significant (P ≥ 0.05); **P < 0.01, ***P < 0.001 (unpaired one-tailed Student’s t test for Bim KO data, unpaired two-tailed Student’s t test for ΔEBAB data)
Fig. 5
Fig. 5
EBAB regulates Bim expression upon TCR stimulation. ad Gene expression changes for Bim (a), Nr4a1 (b), Bub1 (c), and Bcl2 (d) in total thymocytes stimulated for 3 h with anti-CD3 and anti-CD28 antibodies (10 µg/ml). e, f Gene expression level (e) and relative gene expression to WT (f) for Bim in pre-selection (TCRβlowCD69low) and post-selection (TCRβhighCD69high) thymocytes. g, h Gene expression level (g) and relative gene expression to WT (h) for Bub1 in pre-selection (TCRβlowCD69low) and post-selection (TCRβhighCD69high) thymocytes. Data are pooled from six independent experiments (ad; n = 6 sex-matched WT–ΔEBAB pairs, 9–18 weeks old) or five independent experiments (eh; n = 5 sex-matched WT–ΔEBAB pairs, 10–18 weeks old). Edges of the box are the 25th and 75th percentiles, and error bars extend to the maximum and minimum. Outliers are defined as the data point that is located outside of q3 + 1.5(q3 − q1) and q1 − 1.5(q3 − q1), in which q1 and q3 are the 25th and 75th percentiles. n.s. not significant (P ≥ 0.05); *P < 0.05, **P < 0.01, ***P < 0.001 (unpaired two-tailed Student’s t test)
Fig. 6
Fig. 6
EBAB does not play a major role in maintaining homeostasis of regulatory T cells and peripheral T cells. a, b CD4+Foxp3+ thymic (a) and splenic (b) Treg cell numbers of young and aged mice. Data are pooled from five independent experiments (Young; n = 5 WT and EBAB+/−–ΔEBAB littermate pairs, 9–12 weeks old, Aged; n = 5 WT EBAB+/−–ΔEBAB littermate pairs, 30–36 weeks old). c Flow cytometric analysis of CD4 versus CD8 T cell populations in the spleen. The number in the plot is representative percentage of each gate. Data are representative of five independent experiments (Young; n = 5 WT and EBAB+/−–ΔEBAB littermate pairs, 7–17 weeks old, Aged; n= 5 WT and EBAB+/−–ΔEBAB littermate pairs, 30–36 weeks old). d CD4+ and CD8+ splenic T cell numbers. Data are pooled from five independent experiments (Young; n = 5 WT and EBAB+/−–ΔEBAB littermate pairs, 7–17 weeks old, Aged; n= 5 WT and EBAB+/−–ΔEBAB littermate pairs, 30–36 weeks old). Each symbol in (a, b, d) represents an individual mouse; small horizontal lines indicate the mean. n.s. not significant (P ≥ 0.05) (unpaired two-tailed Student’s t test)
Fig. 7
Fig. 7
EBAB is dispensable for two apoptotic pathways in peripheral T cells. a, b Viability (% Annexin VPI) of activated CD4+ (a) and CD8+ (b) splenic T cells after IL-2 withdrawal. Data are pooled from ten independent experiments (a; n = 5 sex-matched WT–ΔEBAB pairs and n = 5 sex-matched WT–Bim/−–ΔEBAB trios, 5–26 weeks old, mean ± s.d.) or 11 independent experiments (b; n = 5 sex-matched WT–ΔEBAB pairs and n = 5 sex-matched WT–Bim−/−–ΔEBAB trios, 5–26 weeks old, mean ± s.d.). c, d Gene expression level for Bim in activated CD4+ (c) and CD8+ (d) splenic T cells cultured with or without IL-2 for 6 h. Data are pooled from five independent experiments (n = 5 sex-matched WT–Bim/−–ΔEBAB trios, 5–14 weeks old). e, f Expression of Bub1 in activated CD4+ (e) and CD8+ (f) splenic T cells cultured with or without IL-2 for 6 h. Data are pooled from five independent experiments (n = 5 sex-matched WT–Bim−/−–ΔEBAB trios, 5–14 weeks old). g, h Apoptotic cell rate (%Annexin V+) of activated CD4+ (g) and CD8+ (h) splenic T cells restimulated with anti-CD3 antibody (5 µg/ml) for 6 h. Data are pooled from five independent experiments (n = 5 sex-matched WT–Bim−/−–ΔEBAB trios, 5–26 weeks old). Edges of the box are the 25th and 75th percentiles, and error bars extend to the maximum and minimum. Outliers are defined as the data point that is located outside of q3 + 1.5(q3 − q1) and q1 − 1.5(q3 − q1), in which q1 and q3 are the 25th and 75th percentiles (ch). n.s. not significant (P ≥ 0.05); *P < 0.05, **P < 0.01, ***P < 0.001 (unpaired two-tailed Student’s t test)
Fig. 8
Fig. 8
ΔEBAB mice do not show any autoimmune phenotype. a Flow cytometric analysis of CD62L versus CD44 populations in CD4+ or CD8+ splenic T cell. The number in the plot is representative percentage of each gate. For CD4+ T cells, gates indicate activated (CD44highCD62Llow) and naïve (CD44lowCD62Lhigh) populations. For CD8+ T cells, activated effector memory (CD44highCD62Llow), activated central memory (CD44highCD62Lhigh) and naïve (CD44lowCD62Lhigh) populations are gated. Data are representative of four independent experiments (n = 5 for WT and EBAB+/− mice, n = 6 for ΔEBAB mice from WT & EBAB+/−–ΔEBAB littermate pairs and trios, 30–34 weeks old). b, c Activated CD4+ (b) and CD8+ (c) proportions of aged mice. Data are pooled from four independent experiments (n = 5 for WT and EBAB+/− mice, n = 6 for ΔEBAB mice from WT and EBAB+/−–ΔEBAB littermate pairs and trios, 30–34 weeks old). d The mean (±s.e.m.) clinical scores at the days after EAE was induced in WT (control) (n = 10) and ΔEBAB mice (n = 8). The incidence of EAE: control 10/10, ΔEBAB 8/8. No data point showed statistically significant difference between WT and ΔEBAB (i.e., unpaired two-tailed Student’s t test P ≥ 0.05). e Representative pictures for Hematoxylin and Eosin staining for the lung, liver, kidney, and pancreas of two independent experiments (n = 2 WT and EBAB+/−–ΔEBAB littermate pairs, 30–31 weeks old). The scale bars represent 100 μm. Each symbol in (b, c) represents an individual mouse; small horizontal lines indicate the mean. n.s. not significant (P ≥ 0.05) (unpaired two-tailed Student’s t test)
Fig. 9
Fig. 9
Graphical summary. EBAB plays a role in inducing TCR signal-dependent apoptosis to eliminate high affinity TCR clones in the thymus while dispensable for Bim-dependent peripheral T cell tolerance

References

    1. Xing Y, Hogquist KA. T-cell tolerance: central and peripheral. Cold Spring Harb. Perspect. Biol. 2012;4:a006957. doi: 10.1101/cshperspect.a006957. - DOI - PMC - PubMed
    1. Klein L, Kyewski B, Allen PM, Hogquist KA. Positive and negative selection of the T cell repertoire: what thymocytes see (and don’t see) Nat. Rev. Immunol. 2014;14:377–391. doi: 10.1038/nri3667. - DOI - PMC - PubMed
    1. Hogquist KA, Jameson SC. The self-obsession of T cells: how TCR signaling thresholds affect fate ‘decisions’ and effector function. Nat. Immunol. 2014;15:815–823. doi: 10.1038/ni.2938. - DOI - PMC - PubMed
    1. Richards DM, Kyewski B, Feuerer M. Re-examining the nature and function of self-reactive T cells. Trends Immunol. 2016;37:114–125. doi: 10.1016/j.it.2015.12.005. - DOI - PMC - PubMed
    1. Wirnsberger G, Hinterberger M, Klein L. Regulatory T-cell differentiation versus clonal deletion of autoreactive thymocytes. Immunol. Cell Biol. 2011;89:45–53. doi: 10.1038/icb.2010.123. - DOI - PubMed

Publication types

MeSH terms

Substances