. 2019 Jun 13;10(1):2583.
doi: 10.1038/s41467-019-10713-z.

Atomic-resolution imaging of surface and core melting in individual size-selected Au nanoclusters on carbon

Affiliations

Atomic-resolution imaging of surface and core melting in individual size-selected Au nanoclusters on carbon

D M Foster et al. Nat Commun. .

Abstract

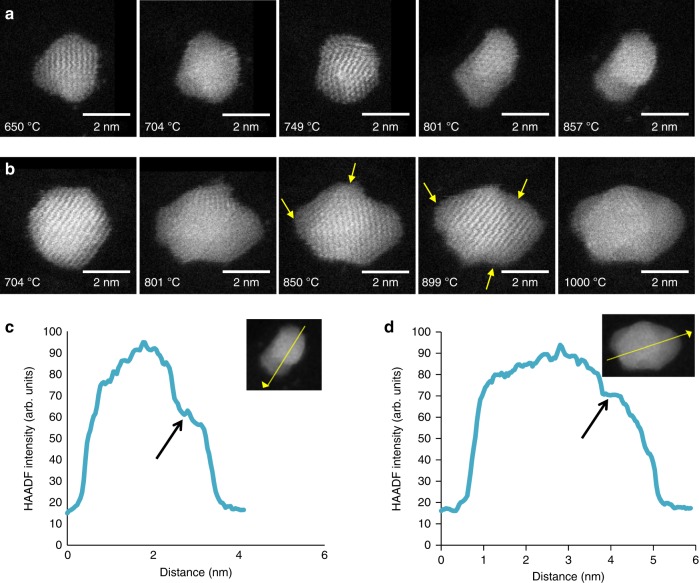
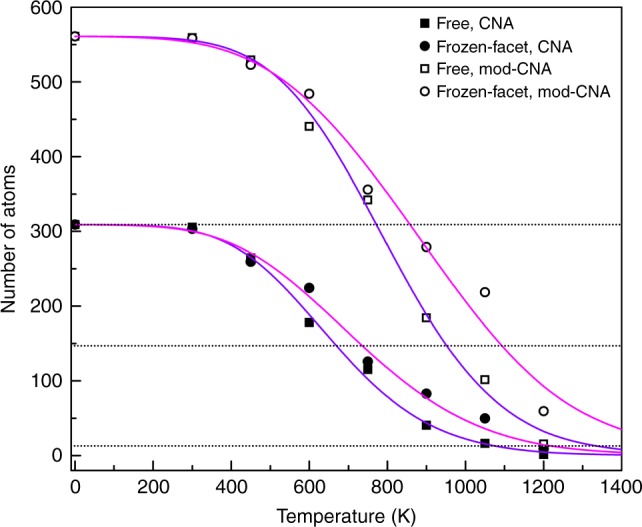
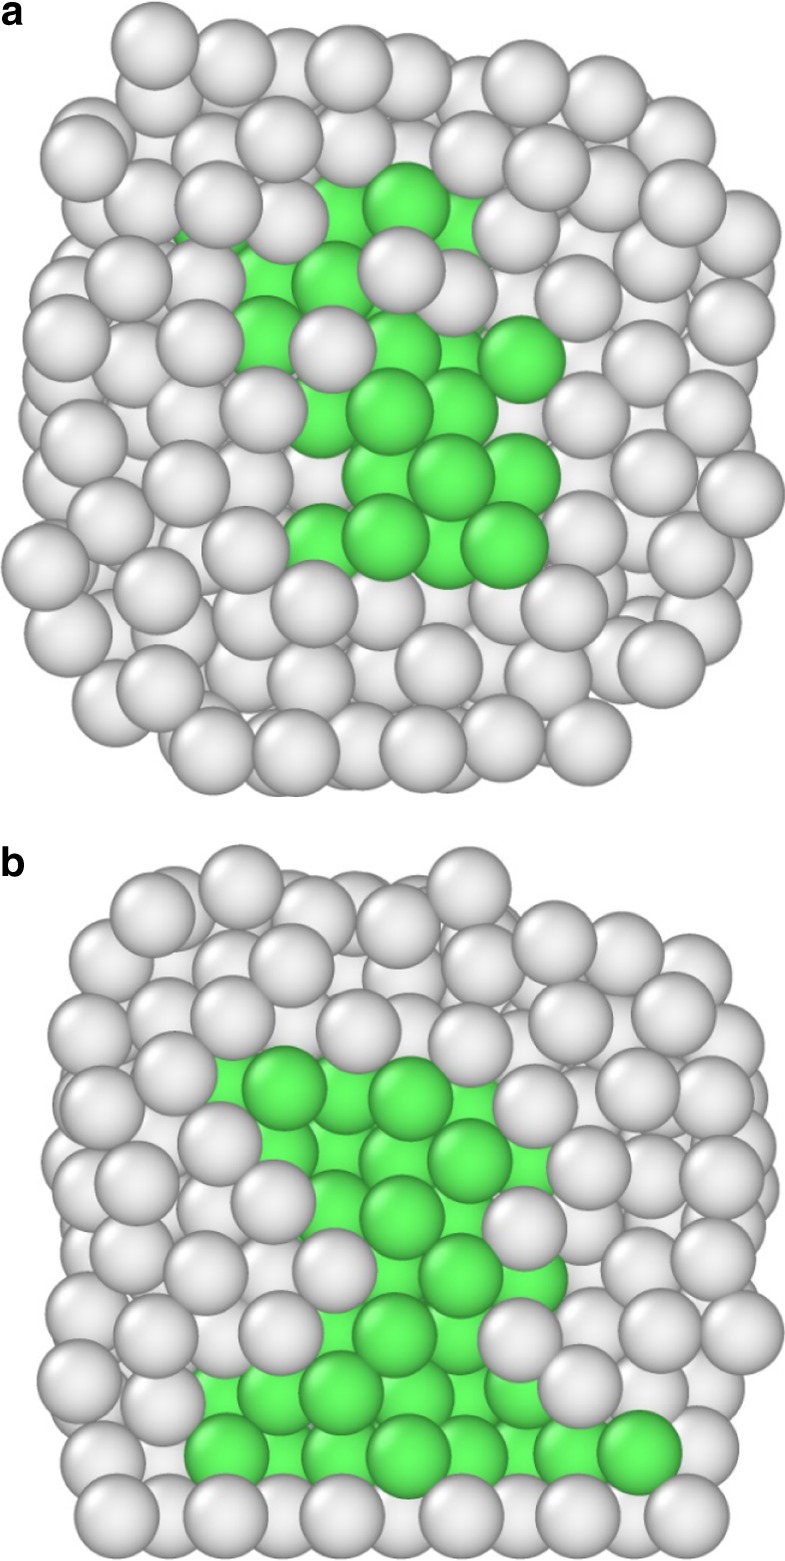
Although the changes in melting behaviour on the nanoscale have long attracted the interest of researchers, the mechanism by which nanoparticles melt remains an open problem. We report the direct observation, at atomic resolution, of surface melting in individual size-selected Au clusters (2-5 nm diameter) supported on carbon films, using an in situ heating stage in the aberration corrected scanning transmission electron microscope. At elevated temperatures the Au nanoparticles are found to form a solid core-liquid shell structure. The cluster surface melting temperatures, show evidence of size-dependent melting point suppression. The cluster core melting temperatures are significantly greater than predicted by existing models of free clusters. To explore the effect of the interaction between the clusters and the carbon substrate, we employ a very large-scale ab initio simulation approach to investigate the influence of the support. Theoretical results for surface and core melting points are in good agreement with experiment.


Conflict of interest statement

The authors declare no competing interests.

Figures

Fig. 1
Fig. 1
Shape changes in Au nanoclusters at high temperatures. HAADF STEM images of a an individual Au561 particle at high temperature (550–857 °C) and b an individual Au2530 particle (556–1000 °C)
Fig. 2
Fig. 2
Experimental, single particle measurements of melting point suppression in Au nanoparticles. Scatter points represent the experimental data: circles show surface melting temperatures and squares show core-melting temperatures. The cluster sizes (number of atoms) are indicated on the plot and the corresponding core and surface melting temperatures have the same colour. The solid green line is Pawlow’s model from ref. , the solid red line is the liquid shell model from ref. and the blue region is the liquid nucleation and growth model melting sector from refs. , . The error bars on the melting temperatures are systematic errors arising from the temperature window, the temperature stability of the MEMS heating chip and the 5% heating chip calibration error
Fig. 3
Fig. 3
Power spectrum FFT images of various regions of a Au561 nanocluster. The nanocluster at a 600 °C and b 657 °C
Fig. 4
Fig. 4
The formation of a liquid shell in Au nanoclusters at high temperatures. a HAADF STEM images of an Au561 particle at high temperatures (650–857 °C). b HAADF STEM images of an Au1110 particle at high temperatures (704–1000 °C). Amorphous regions at the edges of the particle are highlighted by yellow arrows. c A line profile plot of the HAADF intensity across the particle in (a) at 857 °C and d a line profile plot of the HAADF intensity across the particle in (b) at 1000 °C. Black arrows on the HAADF intensity plots illustrate amorphous regions. Yellow arrows on the inset HAADF images indicate the direction and location of the line profile
Fig. 5
Fig. 5
Theoretical melting point suppression in cuboctahedral Au561 nanoclusters. Scatter points represent statistical averages for the number of crystalline atoms obtained by the CNA (solid points) and modified CNA algorithms (hollow points) as a function of temperature for two families of simulations: nanoclusters all of whose atoms are free to move (squares), and nanoclusters having atoms of one (100) facet fixed in place during the simulations (circles). The curves are sigmoidal fits to the data. Horizontal dotted lines denote the 309-, 147 and 13-atom limits
Fig. 6
Fig. 6
Cross-sections of Au561 nanoclusters at elevated temperatures. a A free and b a frozen-facet nanocluster at 627 °C. Green spheres denote atoms that are recognized as fcc, while grey spheres are atoms found to be non-crystalline. The bottom layer in (b) is the frozen layer. At this temperature the core is approximately double in size in (b) compared with (a) (85 atoms and 43 atoms, respectively) and displaced towards the frozen facet

References

    1. Corma A, Garcia H. Supported gold nanoparticles as catalysts for organic reactions. Chem. Soc. Rev. 2008;37:2096–2126. doi: 10.1039/b707314n. - DOI - PubMed
    1. Schmidt M, Kusche R, von Issendorff B, Haberland H. Irregular variations in the melting point of size-selected atomic clusters. Nature. 1998;393:238–240. doi: 10.1038/30415. - DOI
    1. Pawlow P. The dependency of the melting point on the surface energy of a solid body. Z. Phys. Chem. 1909;65:545–548.
    1. Takagi M. Electron-diffraction study of liquid-solid transition of thin metal films. J. Phys. Soc. Jpn. 1954;9:359–363. doi: 10.1143/JPSJ.9.359. - DOI
    1. Shvartsburg A, Jarrold M. Solid clusters above the bulk melting point. Phys. Rev. Lett. 2000;85:2530–2532. doi: 10.1103/PhysRevLett.85.2530. - DOI - PubMed

Publication types