. 2019 Jun 13;10(1):2595.
doi: 10.1038/s41467-019-10600-7.

Emergence of plasmid stability under non-selective conditions maintains antibiotic resistance

Affiliations

Emergence of plasmid stability under non-selective conditions maintains antibiotic resistance

Tanita Wein et al. Nat Commun. .

Abstract

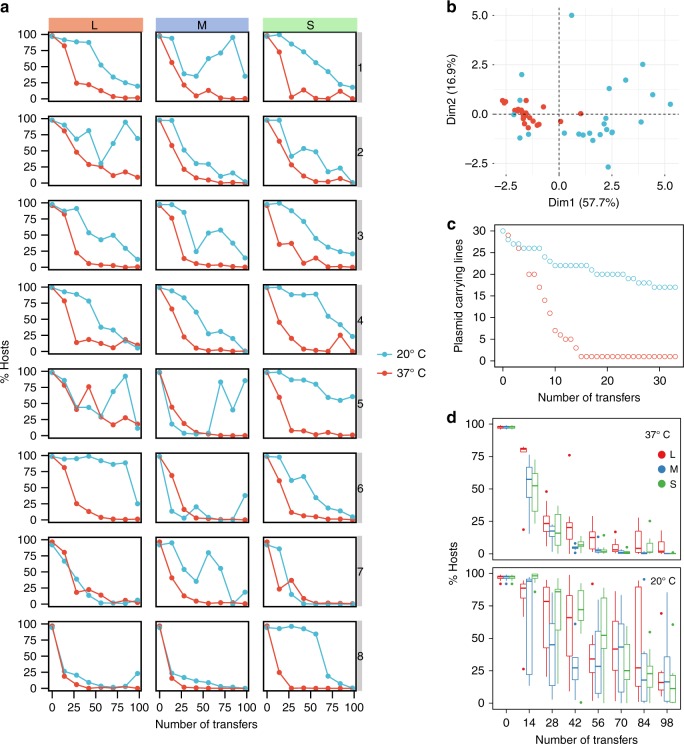
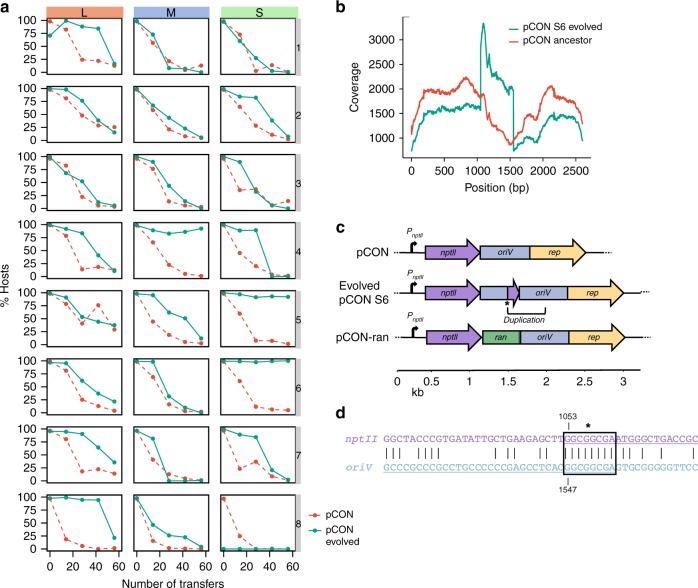
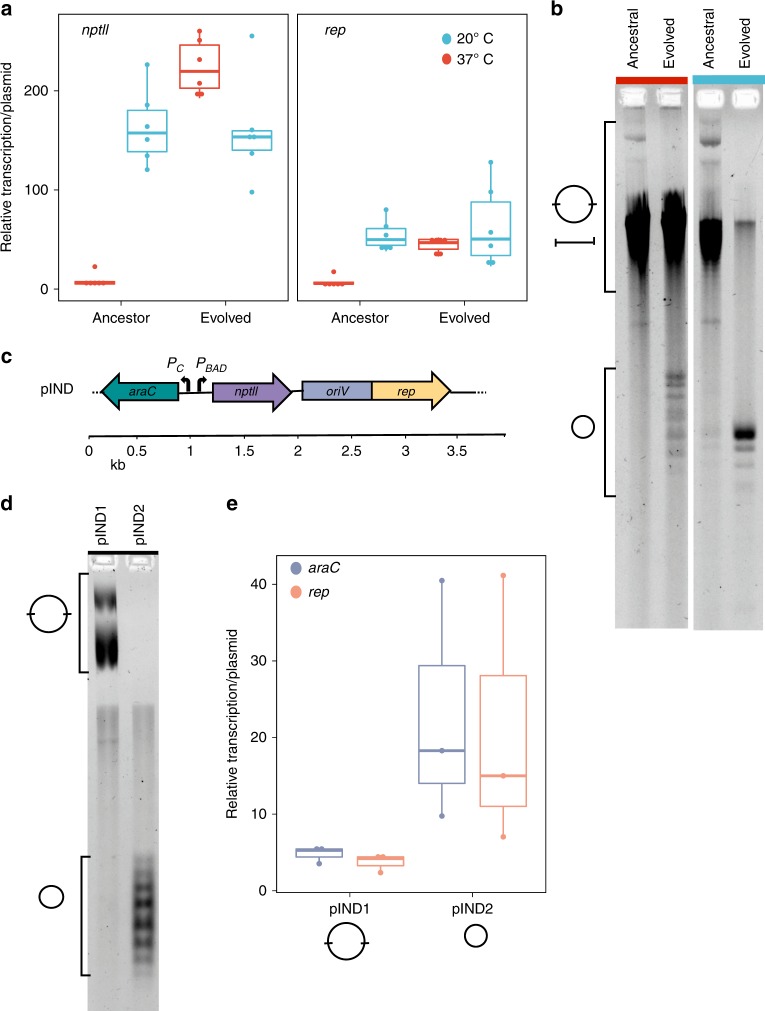
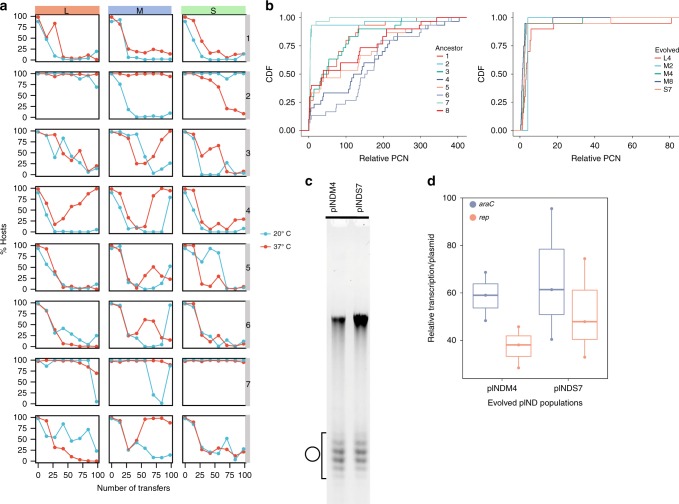
Plasmid acquisition is an important mechanism of rapid adaptation and niche expansion in prokaryotes. Positive selection for plasmid-coded functions is a major driver of plasmid evolution, while plasmids that do not confer a selective advantage are considered costly and expected to go extinct. Yet, plasmids are ubiquitous in nature, and their persistence remains an evolutionary paradox. Here, we demonstrate that non-mobile plasmids persist over evolutionary timescales without selection for the plasmid function. Evolving a minimal plasmid encoding for antibiotics resistance in Escherichia coli, we discover that plasmid stability emerges in the absence of antibiotics and that plasmid loss is determined by transcription-replication conflicts. We further find that environmental conditions modulate these conflicts and plasmid persistence. Silencing the transcription of the resistance gene results in stable plasmids that become fixed in the population. Evolution of plasmid stability under non-selective conditions provides an evolutionary explanation for the ubiquity of plasmids in nature.


Conflict of interest statement

The authors declare no competing interests.

Figures

Fig. 1
Fig. 1
Evolution of pCON plasmid under non-selective conditions. a pCON persistence is shown as the proportion of hosts during the evolution experiment at 20 °C (blue) and 37 °C (red). The columns correspond to the three population bottleneck sizes (L, M, and S). The experiment was conducted for 98 transfers, which correspond to approximately 600 generations in L populations, 800 generations in M populations, and 1000 generations in S populations. To account for differential growth dynamics, the 37 °C cultures were transferred every 12 h while the 20 °C cultures were transferred every 24 h. The eight replicate lines are presented in vertical order (i.e., populations in each row have a common ancestral population). b Principal component analysis (PCA) of the pCON persistence over time comparing the host dynamics among the temperature regimes. c pCON persistence in the single colony transfer experiment at 20 °C (blue) and 37 °C (red) over a time of 33 transfers corresponding to about 800 generations. d A comparison of variability among pooled replicated lines (for PCA see Supplementary Fig. 3). The evolved lines are pooled according to population bottleneck size. Top: lines evolved at 37 °C. Bottom: lines evolved at 20 °C. The center value of the boxplots represents the median, the boxes denote the interquartile range, and the whiskers represent minimum and maximum values. Source data are provided as a Source Data file
Fig. 2
Fig. 2
Follow-up evolution experiment of evolved pCON hosts at 37 °C. a Plasmid persistence under non-selective conditions after selection for evolved plasmid-carrying populations (green) compared against pCON persistence during the first experiment (Fig. 1a) at 37 °C (red, dashed lines). The experiment was conducted for 56 transfers corresponding to about 340 generations in L populations, 450 generations in M populations, and 560 generations in S populations. b Sequencing coverage distribution of ancestral and evolved pCON variants from population S6. The presented coverage was divided by the mean coverage. c Genomic map of pCON plasmids. The pCON variant S6 encountered a segmental duplication downstream the nptII gene including 125 bp of nptII and 372 bp of the oriV. The fusion site is indicated by a star symbol. In pCON-ran a random DNA segment of 500 bp was placed between nptII and the oriV. d Nucleotide sequence of the fusion site of nptII and the oriV. The black box indicates a microhomology region (8 bp) within which the illegitimate fusion potentially occurred. Extended homologies are shown up and downstream of the fusion site. Source data are provided as a Source Data file
Fig. 3
Fig. 3
pCON transcription, replication and DNA topology. a Relative transcription of plasmid genes (nptII and rep) in ancestral and evolved plasmids from both temperatures was calculated per plasmid (i.e., dividing by the PCN) (Supplementary Fig. 6, n = 6). The evolved plasmids at 37 °C comprise the stably inherited pCON variant from population S6. b Separation of pCON plasmid preparations by one-dimensional agarose gel electrophoresis in the presence of chloroquine (4 µg/ml; for original gel see Supplementary Fig. 7). Chloroquine was used to resolve different topological forms of supercoiled plasmids and compare their relative motility to each other. The isolated plasmids correspond to the plasmids presented in (a). Symbols indicate supercoiled plasmid topoisomers of multimers (large circle) and monomers (small circle) (see Supplementary Fig. 8a for further details). We note that the low PCN of ancestral pCON plasmids at 37 °C resulted in lower plasmid yields and increased co-eluted chromosomal DNA (linear fragments, Supplementary Fig. 9a,c). c Genetic map of the plasmid pIND. d Plasmid topology of pIND plasmids (multimers and monomers, Supplementary Fig. 8b, for original see Supplementary Fig. 10) from two ancestral host populations at 37 °C (analyzed as in (b)). e Relative transcription per plasmid of pIND-encoded genes araC and rep in the two different pIND replicates pIND1 and pIND2 at 37 °C (n = 3). a, e The center value of the boxplots represents the median, the boxes denote the interquartile range, and the whiskers represent minimum and maximum values. Source data are provided as a Source Data file
Fig. 4
Fig. 4
Evolution of pIND under non-selective conditions. Note that the expression of the plasmid encoded nptII gene was not induced during the evolution experiment. a pIND persistence is shown as the proportion of hosts during the evolution experiment at 20 °C (blue) and at 37 °C (red). The columns correspond to the three population bottleneck sizes (L, M, and S). The experiment was conducted for 98 transfers, which correspond to 600 generations in L populations, 800 generations in M populations, and about 1000 generations in S populations. Eight replicate lines are presented in vertical order (i.e., populations in each row have a common ancestral population). Replicates pIND1 and pIND2 correspond to the replicates presented in Fig. 3. b Cumulative distribution function of relative plasmid copy number (PCN) distribution in pIND ancestral populations (left) and evolved stable populations (right). Replicates correspond to the replicates in the evolution experiment in (a) (n = 30 or n = 20 for each population). c Evolved stable pIND plasmids from populations pINDM4 and pINDS7 (37 °C) analyzed by one-dimensional chloroquine gel electrophoresis (as shown in Fig. 3b, c). Symbol denotes the supercoiled monomer distribution of pIND (Supplementary Figs. 8b and 9b). d Relative transcription per plasmid of pIND from evolved populations pINDM4 and pINDS7 (37 °C, n = 3). The center value of the boxplots represents the median, the boxes denote the interquartile range, and the whiskers represent minimum and maximum values. Source data are provided as a Source Data file
Fig. 5
Fig. 5
Phylogeny of pBBR1 Rep protein. A search for homologs of pBBR1 revealed several plasmids having a homologous Rep protein (≥65% identical amino acids). Phylogenetic relations between the Rep homologs are depicted by the tree topology with blue circles whose size is proportional to the bootstrap support in each node. Plasmid size and isolation location are indicated next to the host taxonomic name

Similar articles

Cited by

References

    1. San Millan A. Evolution of plasmid-mediated antibiotic resistance in the clinical context. Trends Microbiol. 2018;26:978–985. doi: 10.1016/j.tim.2018.06.007. - DOI - PubMed
    1. Gullberg E, Albrecht LM, Karlsson C, Sandegren L, Andersson DI. Selection of a multidrug resistance plasmid by sublethal levels of antibiotics and heavy metals. mBio. 2014;5:e01918-14. doi: 10.1128/mBio.01918-14. - DOI - PMC - PubMed
    1. Rozwandowicz M, et al. Plasmids carrying antimicrobial resistance genes in Enterobacteriaceae. J. Antimicrob. Chemother. 2018;73:1121–1137. doi: 10.1093/jac/dkx488. - DOI - PubMed
    1. Bruto M, et al. Vibrio crassostreae, a benign oyster colonizer turned into a pathogen after plasmid acquisition. ISME J. 2017;11:1043–1052. doi: 10.1038/ismej.2016.162. - DOI - PMC - PubMed
    1. Brinkmann H, Göker M, Koblížek M, Wagner-Döbler I, Petersen J. Horizontal operon transfer, plasmids, and the evolution of photosynthesis in Rhodobacteraceae. ISME J. 2018;12:1994–2010. doi: 10.1038/s41396-018-0150-9. - DOI - PMC - PubMed

Publication types

MeSH terms

Substances