

Near-infrared spectroscopy as a tool for in vivo analysis of human muscles
- PMID: 31197189
- PMCID: PMC6565698
- DOI: 10.1038/s41598-019-44896-8
Near-infrared spectroscopy as a tool for in vivo analysis of human muscles
Abstract
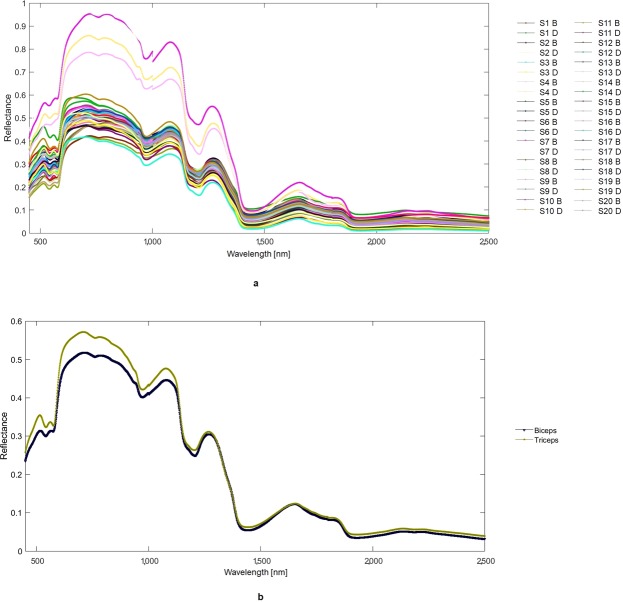
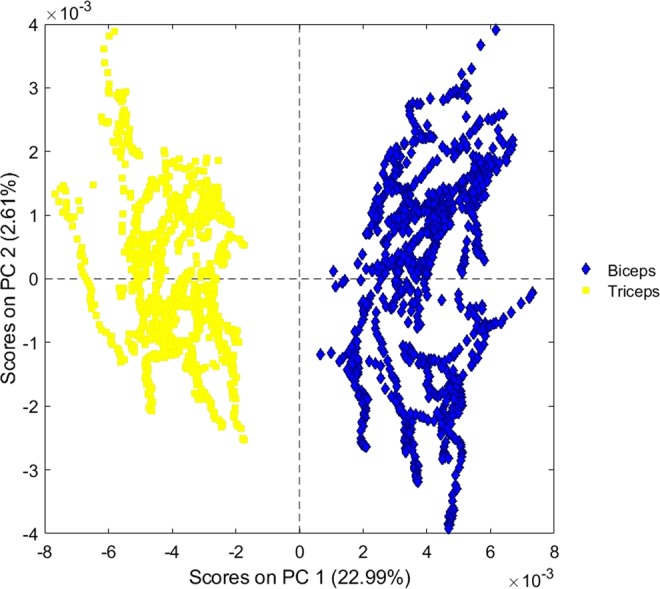
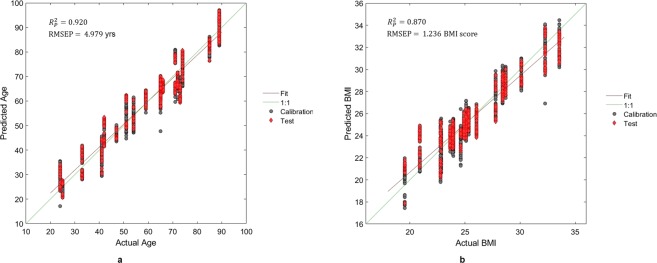
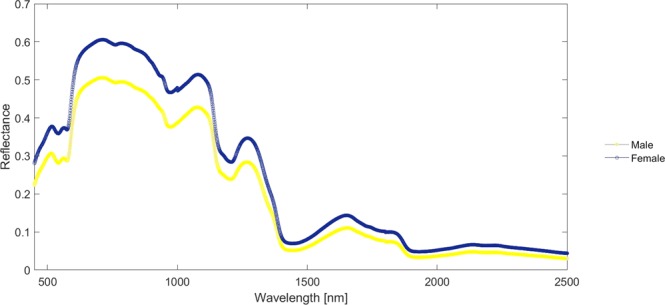
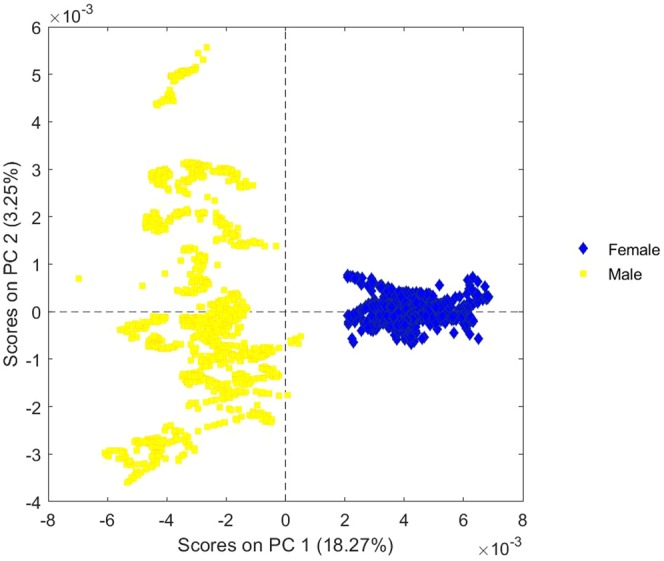
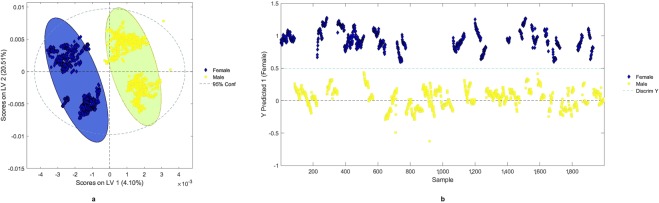
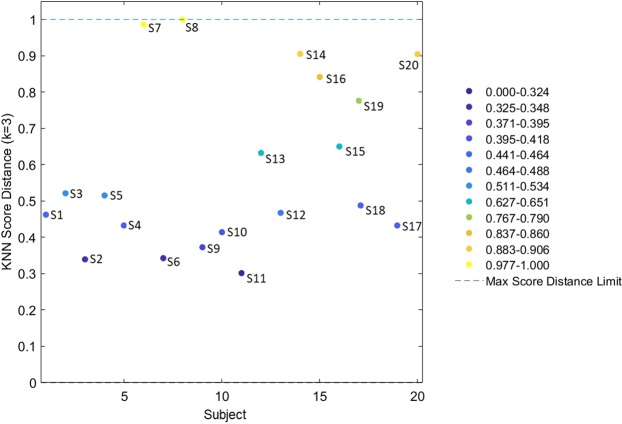
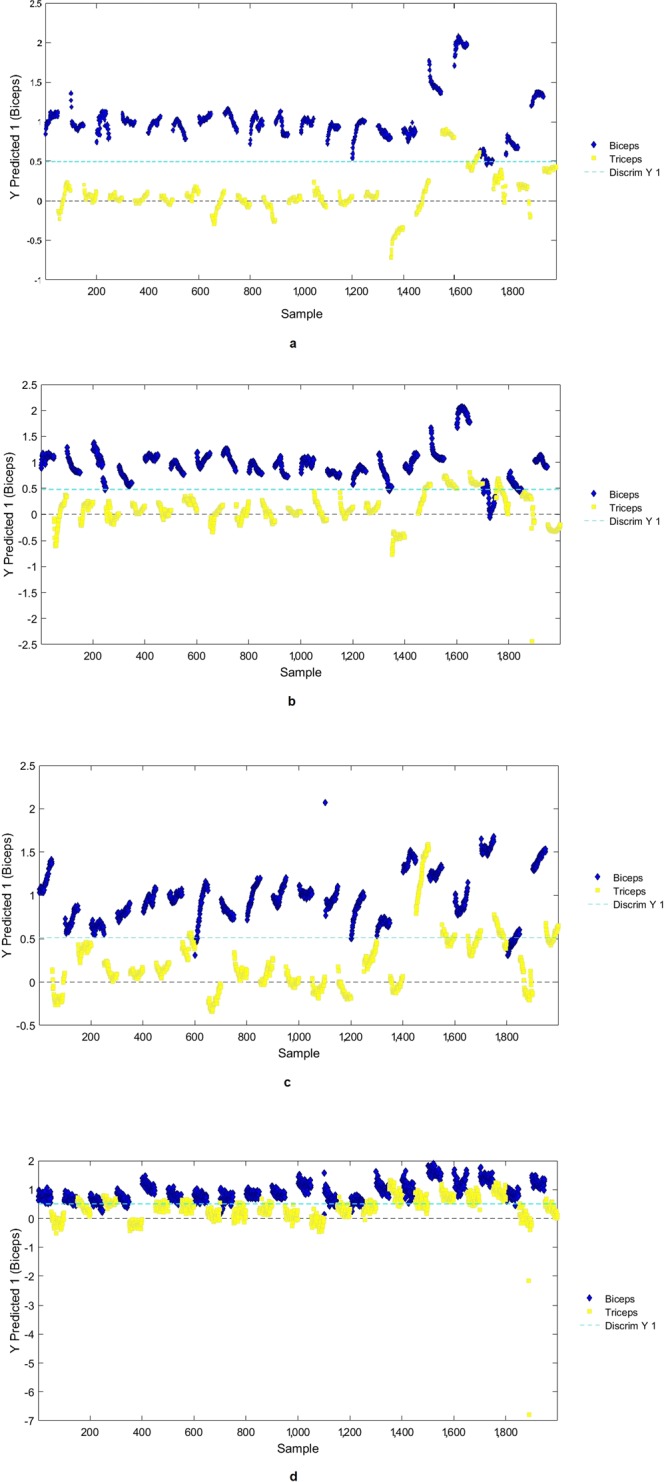
Recent advances in materials and fabrication techniques provided portable, performant, sensing optical spectrometers readily operated by user-friendly cabled or wireless systems. Such systems allow rapid, non-invasive, and not destructive quantitative analysis of human tissues. This proof-of-principle investigation tested whether infrared spectroscopy techniques, currently utilized in a variety of areas, could be applied in living humans to categorize muscles. Using an ASD FieldSpec® 4 Standard-Res Spectroradiometer with a spectral sampling capability of 1.4 nm at 350-1000 nm and 1.1 nm at 1001-2500 nm, we acquired reflectance spectra in visible short-wave infra-red regions (350-2500 nm) from the upper limb muscles (flexors and extensors) of 20 healthy subjects (age 25-89 years, 9 women). Spectra off-line analysis included preliminary preprocessing, Principal Component Analysis, and Partial Least-Squares Discriminant Analysis. Near-infrared (NIR) spectroscopy proved valuable for noninvasive assessment of tissue optical properties in vivo. In addition to the non-invasive detection of tissue oxygenation, NIR spectroscopy provided the spectral signatures (ie, "fingerprints") of upper limb flexors and extensors, which represent specific, accurate, and reproducible measures of the overall biological status of these muscles. Thus, non-invasive NIR spectroscopy enables more thorough evaluation of the muscular system and optimal monitoring of the effectiveness of therapeutic or rehabilitative interventions.
Conflict of interest statement
The authors declare no competing interests.
Figures
Similar articles
-
In vivo non-invasive near-infrared spectroscopy distinguishes normal, post-stroke, and botulinum toxin treated human muscles.Sci Rep. 2021 Sep 3;11(1):17631. doi: 10.1038/s41598-021-96547-6. Sci Rep. 2021. PMID: 34480037 Free PMC article.
-
Near-Infrared Transflectance Spectroscopy Discriminates Solutions Containing Two Commercial Formulations of Botulinum Toxin Type A Diluted at Recommended Volumes for Clinical Reconstitution.Biosensors (Basel). 2022 Apr 6;12(4):216. doi: 10.3390/bios12040216. Biosensors (Basel). 2022. PMID: 35448275 Free PMC article.
-
A dataset of visible - short wave infrared reflectance spectra collected in-vivo on the dorsal and ventral aspect of arms.Data Brief. 2020 Nov 2;33:106480. doi: 10.1016/j.dib.2020.106480. eCollection 2020 Dec. Data Brief. 2020. PMID: 33251301 Free PMC article.
-
Near-infrared spectroscopy and hyperspectral imaging: non-destructive analysis of biological materials.Chem Soc Rev. 2014 Dec 21;43(24):8200-14. doi: 10.1039/c4cs00062e. Epub 2014 Aug 26. Chem Soc Rev. 2014. PMID: 25156745 Review.
-
Near-infrared spectroscopy for medical applications: Current status and future perspectives.Clin Chim Acta. 2016 Apr 1;455:181-8. doi: 10.1016/j.cca.2016.02.009. Epub 2016 Feb 12. Clin Chim Acta. 2016. PMID: 26877058 Review.
Cited by
-
Particle Swarm Optimization and Multiple Stacked Generalizations to Detect Nitrogen and Organic-Matter in Organic-Fertilizer Using Vis-NIR.Sensors (Basel). 2021 Jul 17;21(14):4882. doi: 10.3390/s21144882. Sensors (Basel). 2021. PMID: 34300620 Free PMC article.
-
Quality Differences in Frozen Mackerel According to Thawing Method: Potential Classification via Hyperspectral Imaging.Foods. 2024 Dec 11;13(24):4005. doi: 10.3390/foods13244005. Foods. 2024. PMID: 39766948 Free PMC article.
-
Monitoring the Bacterial Response to Antibiotic and Time Growth Using Near-infrared Spectroscopy Combined with Machine Learning.Food Anal Methods. 2021;14(7):1394-1401. doi: 10.1007/s12161-021-01994-6. Epub 2021 Feb 19. Food Anal Methods. 2021. PMID: 33643516 Free PMC article.
-
Review: Emerging Eye-Based Diagnostic Technologies for Traumatic Brain Injury.IEEE Rev Biomed Eng. 2023;16:530-559. doi: 10.1109/RBME.2022.3161352. Epub 2023 Jan 5. IEEE Rev Biomed Eng. 2023. PMID: 35320105 Free PMC article. Review.
-
Using cross-correlation analysis of multi-channel near infrared spectroscopy to assess the hemodynamic response to cupping therapy.Biomed Opt Express. 2023 Aug 3;14(9):4455-4467. doi: 10.1364/BOE.493897. eCollection 2023 Sep 1. Biomed Opt Express. 2023. PMID: 37791272 Free PMC article.
References
-
- Millikan GA. The oximeter, an instrument for measuring continuously the oxygen saturation of arterial blood in man. Review of scientific Instruments. 1942;13:434. doi: 10.1063/1.1769941. - DOI
-
- Delpy DT, Cope M. Quantification in tissue near-infrared spectroscopy. Philos. Trans. R. Soc. Lond. B Biol.Sci. 1997;352:649–659. doi: 10.1098/rstb.1997.0046. - DOI
MeSH terms
LinkOut - more resources
Full Text Sources
Miscellaneous
