. 2019 Jun 13;9(1):8588.
doi: 10.1038/s41598-019-45050-0.

Assessment of Pharmacology, Safety, and Metabolic activity of Capsaicin Feeding in Mice

Affiliations

Assessment of Pharmacology, Safety, and Metabolic activity of Capsaicin Feeding in Mice

Padmamalini Baskaran et al. Sci Rep. .

Abstract

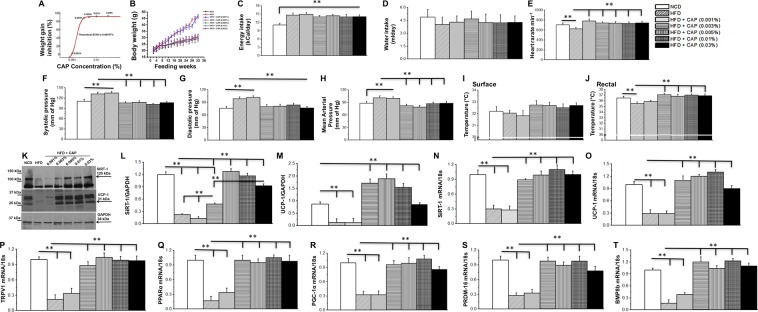
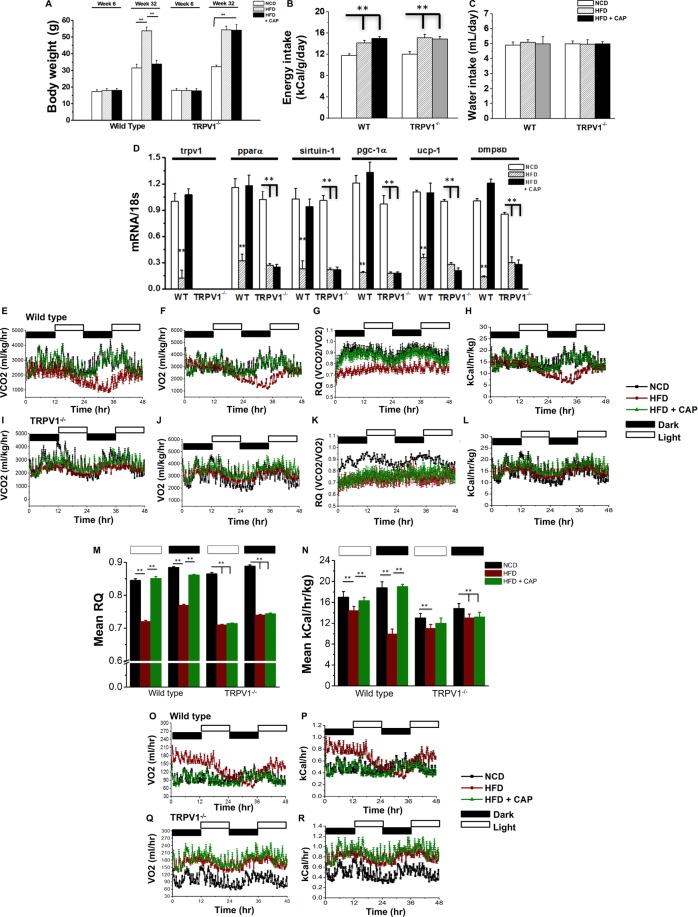
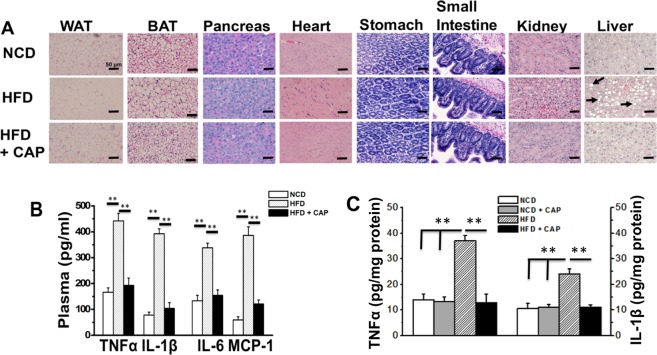
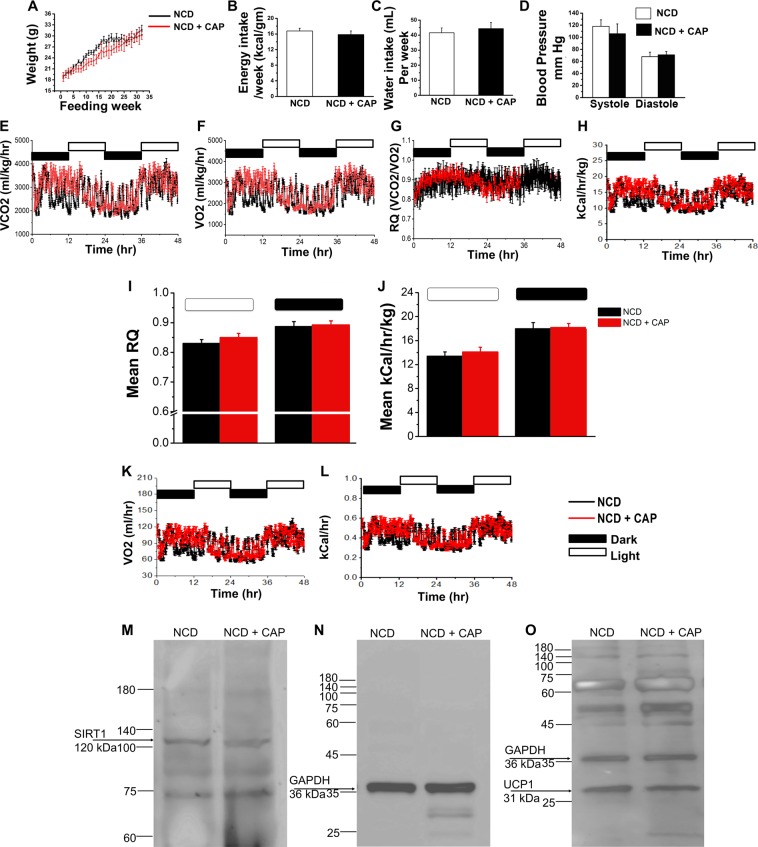
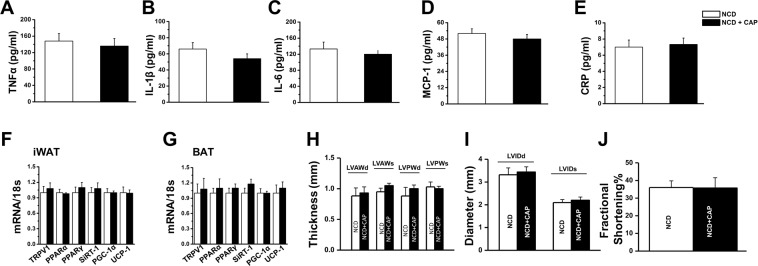
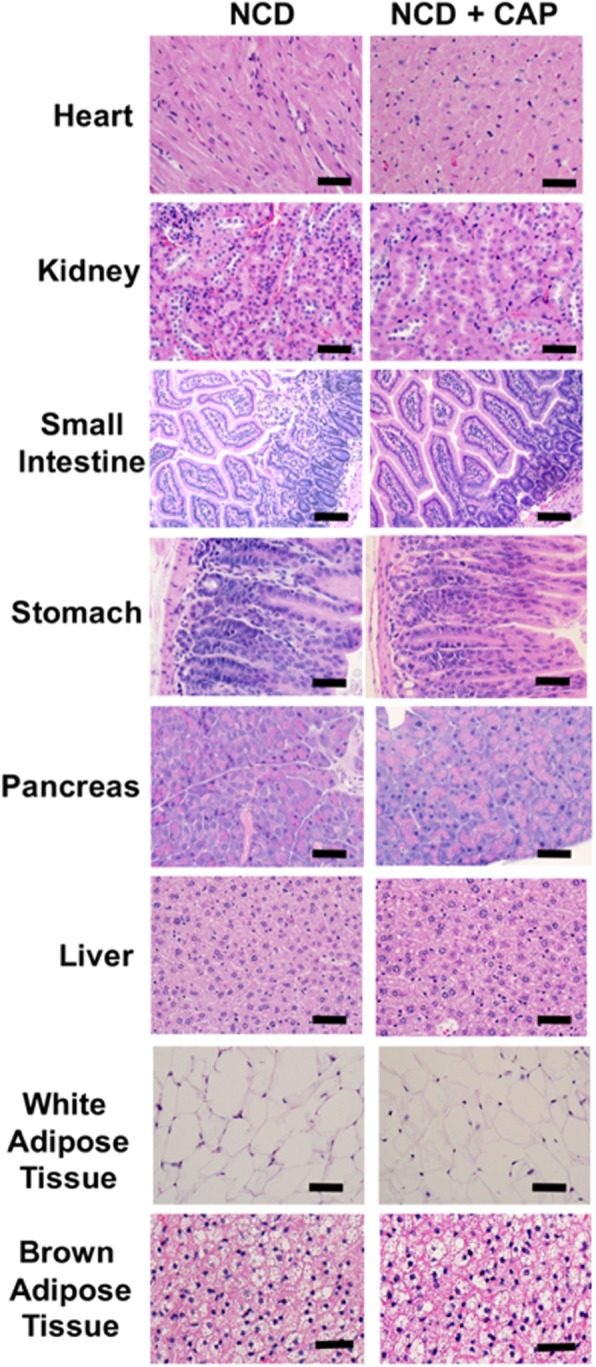
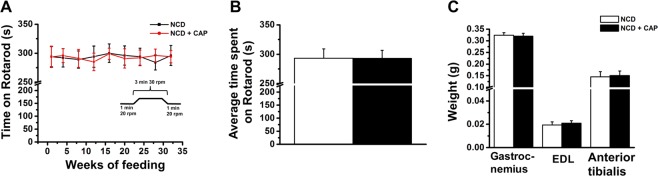
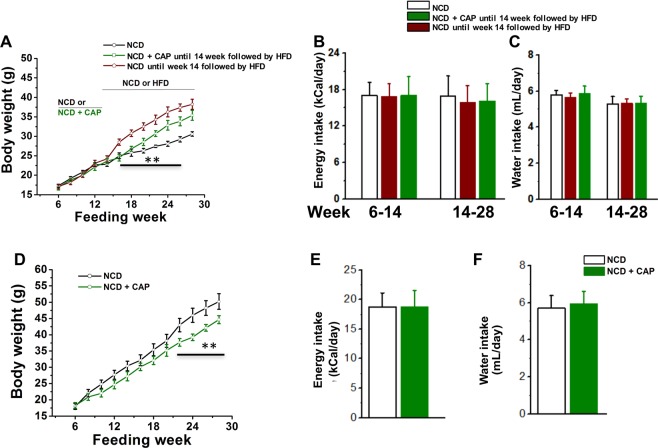
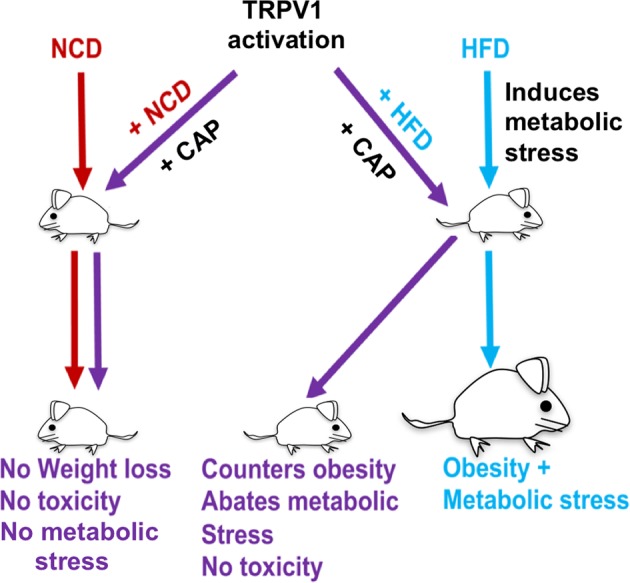
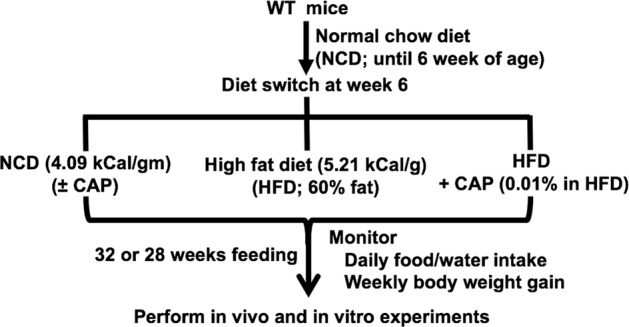
Capsaicin (CAP) activates transient receptor potential vanilloid subfamily 1 (TRPV1) to counter high-fat diet (HFD)-induced obesity. Several studies suggest that CAP induces the browning of white adipocytes in vitro or inguinal white adipose tissue (iWAT) in vivo. However, there is a lack of data on the dose-response for CAP to inhibit HFD-induced obesity. Therefore, we first performed experiments to correlate the effect of various doses of CAP to prevent HFD-induced weight gain in wild-type (WT) mice. Next, we performed a subchronic safety study in WT mice fed a normal chow diet (NCD ± CAP, 0.01% in NCD) or HFD ± CAP (0.01% in HFD) for eight months. We analyzed the expression of adipogenic and thermogenic genes and proteins in the iWAT from these mice, conducted histological studies of vital organs, measured the inflammatory cytokines in plasma and iWAT, and evaluated liver and kidney functions. The dose-response study showed that CAP, at doses above 0.001% in HFD, countered HFD-induced obesity in mice. However, no difference in the anti-obesity effect of CAP was observed at doses above 0.003% in HFD. Also, CAP, above 0.001%, enhanced the expression of sirtuin-1 and thermogenic uncoupling protein 1 (UCP-1) in the iWAT. Safety analyses suggest that CAP did not cause inflammation. However, HFD elevated plasma alanine aminotransferase and creatinine, caused iWAT hypertrophy and hepatic steatosis, and CAP reversed these. Our data suggest that CAP antagonizes HFD-induced metabolic stress and inflammation, while it does not cause any systemic toxicities and is well tolerated by mice.


Conflict of interest statement

The authors declare no competing interests.

Figures

Figure 1
Figure 1
Dose response for CAP-induced suppression of HFD-mediated weight gain. (A) Effect of various concentration of CAP on HFD-induced weight gain in male WT mice. (B) Average weight gain in NCD or HFD (±CAP)-fed WT mice. (C,D) Average energy and water intake in WT mice-fed HFD (±CAP). Energy/water intake were measured in kCal/day and mL/day, respectively, and averaged for the entire duration of the study. Mean ± S.E.M of heat rate (E) systolic and diastolic blood pressure (F,G) mean arterial pressure (H) and surface and rectal body temperature (I,J) in HFD (±CAP)-fed mice (n = 8). (K) Western blot shows the expression of SiRT-1 and UCP-1 in the iWAT of NCD or HFD (±CAP, various concentrations) in WT mice, which received either NCD or HFD (±CAP) for 32 weeks. (L,M) The band intensity ratio for SiRT-1 and UCP-1 to GAPDH (loading control) ±S.E.M is given for n = 3 independent experiments. Mean mRNA levels ±S.E.M of SiRT-1 (N) UCP-1 (O) TRPV1 (P) PPARα (Q) PGC-1α (R) PRDM-16 (S) and BMP8b (T) in the inguinal WAT of WT mice-fed HFD (±CAP, various concentrations; n = 8/condition and experiments were performed in triplicates). **Represent statistical significance for P < 0.01 between either NCD and HFD-fed groups or HFD and HFD + CAP-fed groups.
Figure 2
Figure 2
CAP counters HFD-induced obesity in female WT mice. (A) Body weight gain at week 6 and week 32 in NCD or HFD (±CAP)-fed WT and TRPV1−/− mice. (B,C) Average food and water intake, respectively, in these mice. Food/water intake were measured in kCal/day and mL/day and averaged for the entire duration of the study. (D) Relative expression of adipogenic and thermogenic genes in the inguinal WAT of these mice at 32 weeks of feeding the respective diet. (n = 8 mice per condition and experiments were performed in triplicates). (E) through (L). Representative traces of VCO2, VO2, RER (respiratory quotient, ratio between VCO2 and VO2) 32 weeks of feeding NCD or HFD (± CAP) in the light and dark cycle. (M,N) Mean RER and energy expenditure ±S.E.M. for n = 4 per condition. The VO2 and energy expenditure for the wild type (O,P) and TRPV1−/− (Q,R) mice without body weights. **Represent statistical significance for P < 0.01 between either NCD and HFD-fed groups or HFD and HFD + CAP-fed groups.
Figure 3
Figure 3
Histology sections of tissues of HFD (±CAP)-fed WT mice. (A) Histological architecture in paraffin sections of tissues from NCD or HFD (±0.01% CAP)-fed male WT mice (n = 8 per condition). Scale bar represents 50 μm. (B) Mean plasma levels (pg/ml) ±S.E.M. of TNFα, IL-1β, IL-6 and MCP-1 in WT mice (n = 4 experiments). (C) Cytokine levels in inguinal WAT of WT mice (n = 4 experiments). **Represent statistical significance for P < 0.01 between either NCD and HFD-fed groups or HFD and HFD + CAP-fed groups.
Figure 4
Figure 4
Effect of CAP on body weight and metabolic parameters in NCD-fed WT mice. (A) Time course of weight gain in NCD (±CAP)-fed mice. (B,C) Mean energy and water intake/day ±S.E.M. (D) Mean blood pressure ±S.E.M. in NCD (±CAP)-fed WT mice. (E) through (H). Representative traces of VCO2, VO2, RER (respiratory quotient, ratio between VCO2 and VO2) 32 weeks of feeding NCD (±CAP) in the light and dark cycle. (I,J) Mean RER and energy expenditure ±S.E.M. for n = 4 per condition. The VO2 and energy expenditure for the wild type (K,L). Representative western blot showing the expression of SiRT-1 (M), GAPDH (O; loading control), and UCP-1 (O) in the inguinal WAT of NCD (±CAP)-fed mice.
Figure 5
Figure 5
Effect of CAP on plasma inflammatory cytokines and echo cardiac parameters in NCD-fed WT mice. Plasma concentrations of TNFα (A) IL-1β (B) IL-6 (C) MCP-1 (D) and CRP (E) in NCD (±CAP)-fed WT mice (n = 8). Mean mRNA levels ±S.E.M of TRPV1, PPARα, PPARγ, SiRT-1, PGC-1α and UCP-1 in the inguinal WAT (iWAT; F) and BAT (G) of WT mice-fed NCD (±CAP) for 32 weeks (n = 8). (H) Mean left ventricular anterior and posterior wall thickness ±S.E.M. during diastole and systole. (I) Mean left ventricular internal diameter ±S.E.M. during diastole and systole. (J) Mean Fractional shortening % ±S.E.M. in NCD (±CAP)-fed mice (n = 8).
Figure 6
Figure 6
CAP does not result in microscopic lesions following subchronic dosing. Histological architecture in paraffin sections of tissues from NCD (±0.01% CAP)-fed male WT mice. Differences between the two groups were not found (n = 8). Scale bar represents 50 μm.
Figure 7
Figure 7
CAP does not affect neuromuscular coordination and performance in WT mice. (A) Time spent on a rotarod by WT mice fed NCD (±CAP) for 32 weeks. (B) The average time spent on rotarod for the entire duration of the study (32 weeks) by WT mice-fed NCD (±CAP). (C) The mean weight (±S.E.M.) for gastrocnemius, extensor digitorum longus (EDL) and anterior tibialis skeletal muscles in WT mice fed NCD (±CAP) for 32 weeks (n = 8 per condition).
Figure 8
Figure 8
CAP prevents weight gain in a dynamic and genetic model of obesity. (A) Body weight in WT mice that received NCD (black and wine) or NCD + CAP (olive) for 14 weeks and then switched to a NCD (black) or HFD (wine) after week 14. (B,C) Average daily energy and water intake ±S.E.M. in these mice. (D) Body weight in NCD (±CAP)-fed Ob/Ob mice. (E,F) Average daily energy and water intake in NCD (±CAP)-fed Ob/Ob mice. ** represents statistical significance for P < 0.01 between either NCD and HFD or HFD and HFD + CAP fed groups in A and between NCD and NCD + CAP groups in C for n = 4 mice under each condition. The black line indicates the significance between the body weight of the groups that received HFD following NCD or NCD + CAP.
Figure 9
Figure 9
TRPV1 activation prevents HFD-induced metabolic stress and does not alter physiological functions in the absence of metabolic stress. Chronic feeding of CAP does not affect any physiological parameters but significantly inhibits metabolic pathologies. HFD induces a metabolic stress that promotes obesity, hyperlipidemia, hypertension and hepatic steatosis. CAP counters this and enhances the expression of thermogenic genes/proteins.
Figure 10
Figure 10
Methodology describing the study plan.

Similar articles

Cited by

References

    1. Burness CB, McCormack PL. Capsaicin 8% Patch: A Review in Peripheral Neuropathic Pain. Drugs. 2016;76:123–134. doi: 10.1007/s40265-015-0520-9. - DOI - PubMed
    1. Allegri M, et al. A pharmacological treatment algorithm for localized neuropathic pain. Curr Med Res Opin. 2016;32:377–384. doi: 10.1185/03007995.2015.1129321. - DOI - PubMed
    1. Hoper J, Helfert S, Heskamp ML, Maihofner CG, Baron R. High concentration capsaicin for treatment of peripheral neuropathic pain: effect on somatosensory symptoms and identification of treatment responders. Curr Med Res Opin. 2014;30:565–574. doi: 10.1185/03007995.2013.869491. - DOI - PubMed
    1. Takahashi N, et al. Neuronal TRPV1 activation regulates alveolar bone resorption by suppressing osteoclastogenesis via CGRP. Sci Rep. 2016;6:29294. doi: 10.1038/srep29294. - DOI - PMC - PubMed
    1. Chen KS, et al. Capsaicin protects endothelial cells and macrophage against oxidized low-density lipoprotein-induced injury by direct antioxidant action. Chem Biol Interact. 2015;228:35–45. doi: 10.1016/j.cbi.2015.01.007. - DOI - PubMed

Publication types