. 2020 Jan;34(1):100-114.
doi: 10.1038/s41375-019-0507-8. Epub 2019 Jun 13.

Targeting IRAK4 disrupts inflammatory pathways and delays tumor development in chronic lymphocytic leukemia

Affiliations

Targeting IRAK4 disrupts inflammatory pathways and delays tumor development in chronic lymphocytic leukemia

Neus Giménez et al. Leukemia. 2020 Jan.

Abstract

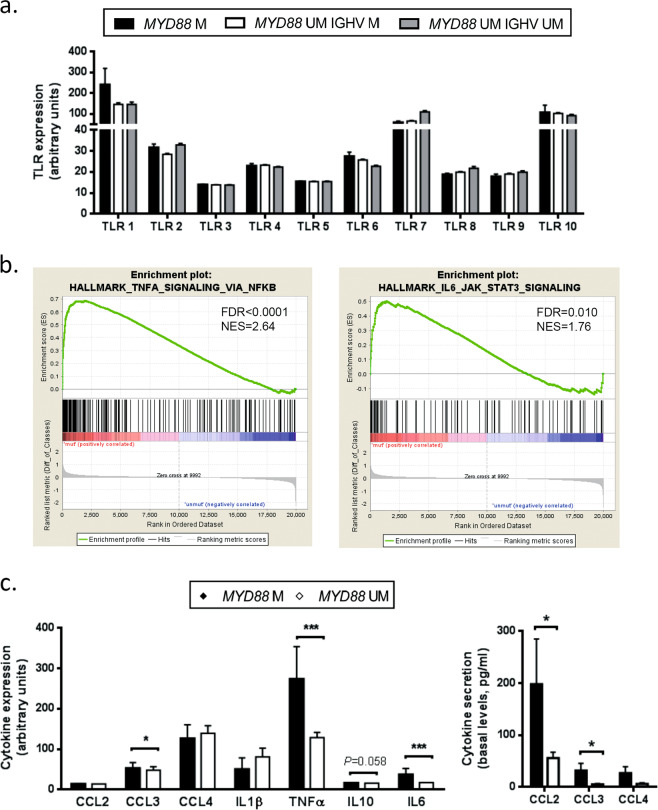
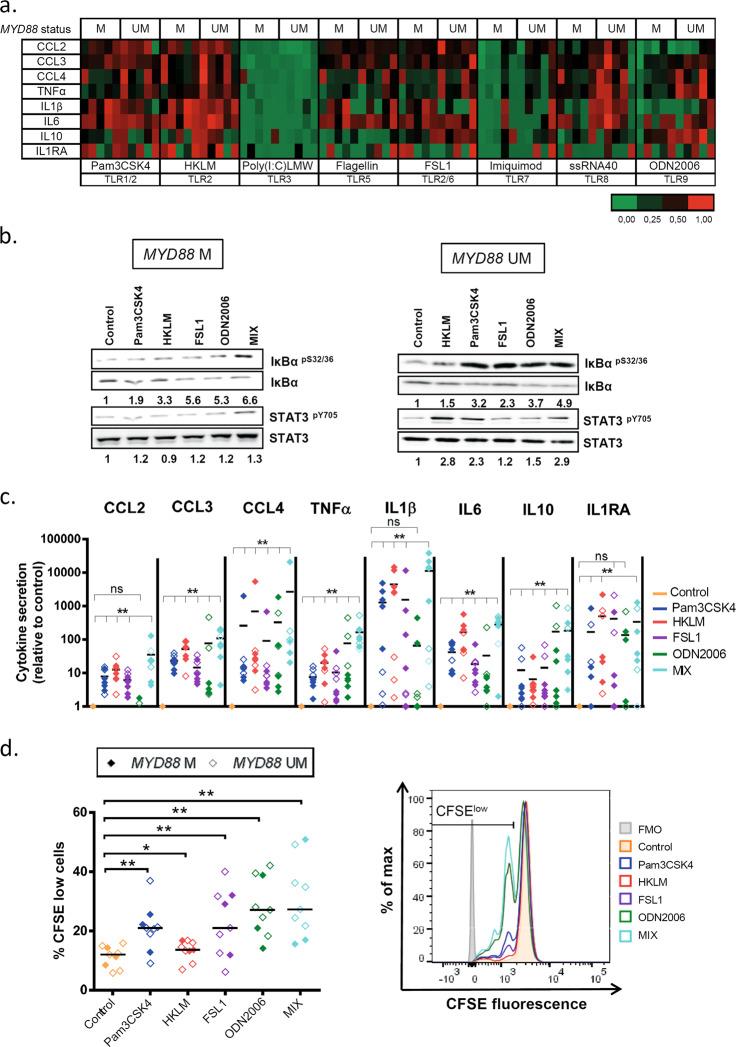
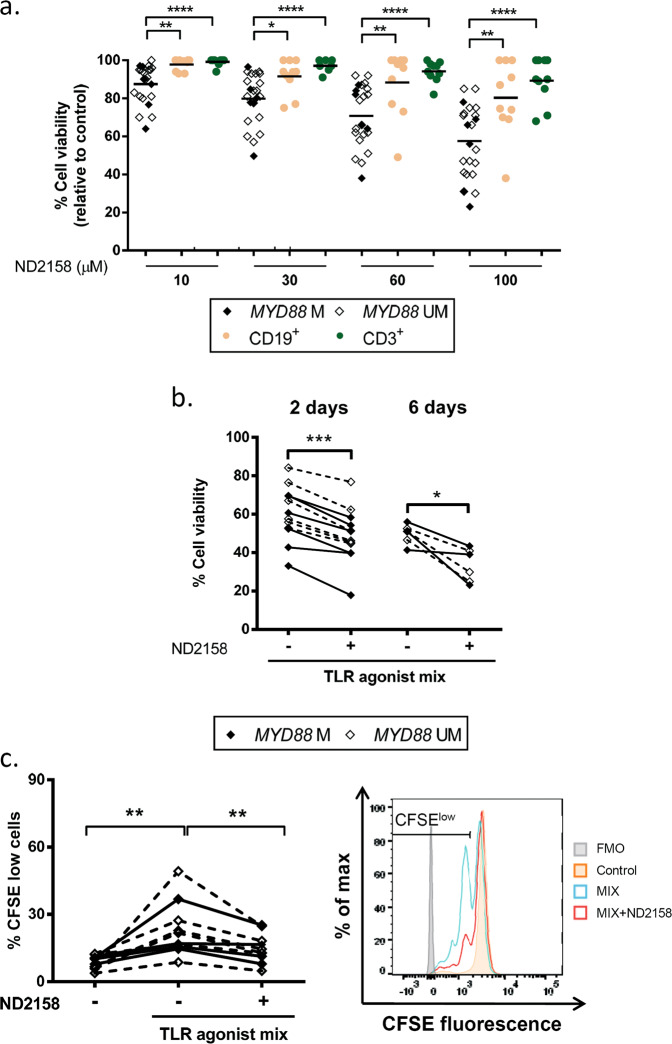
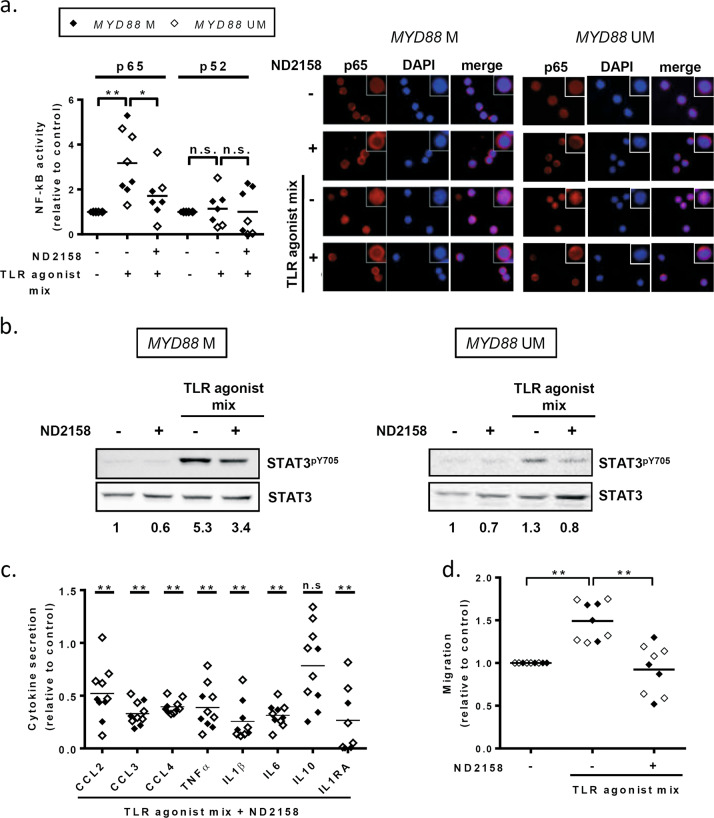
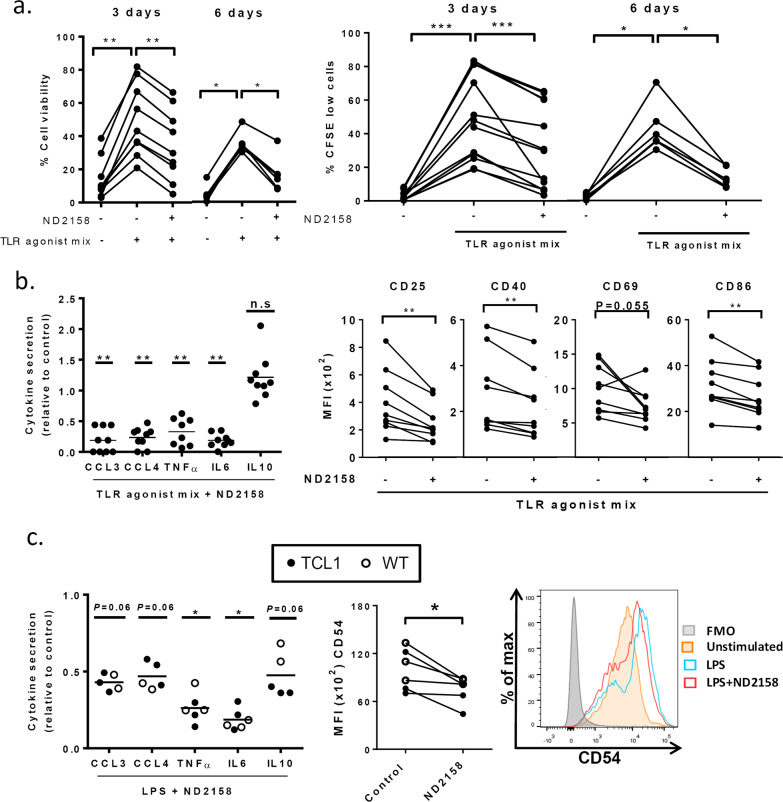
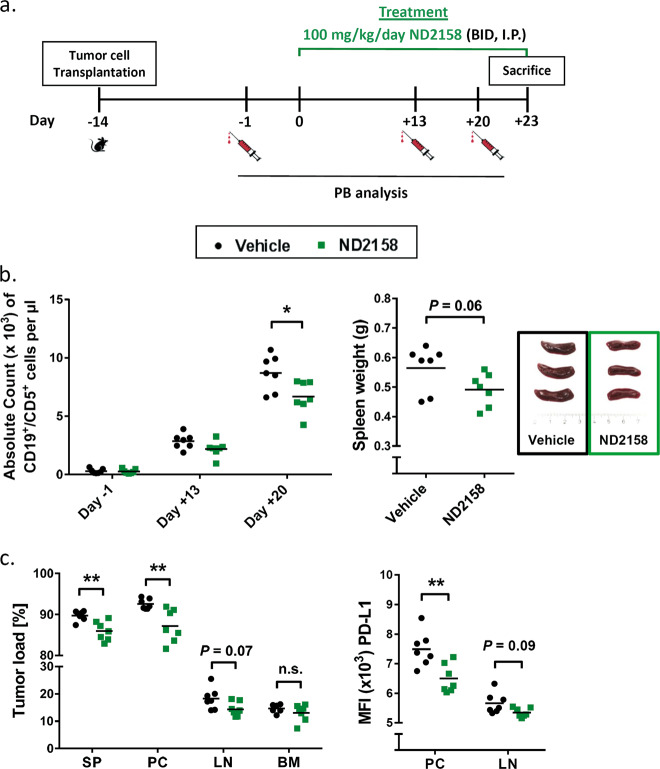
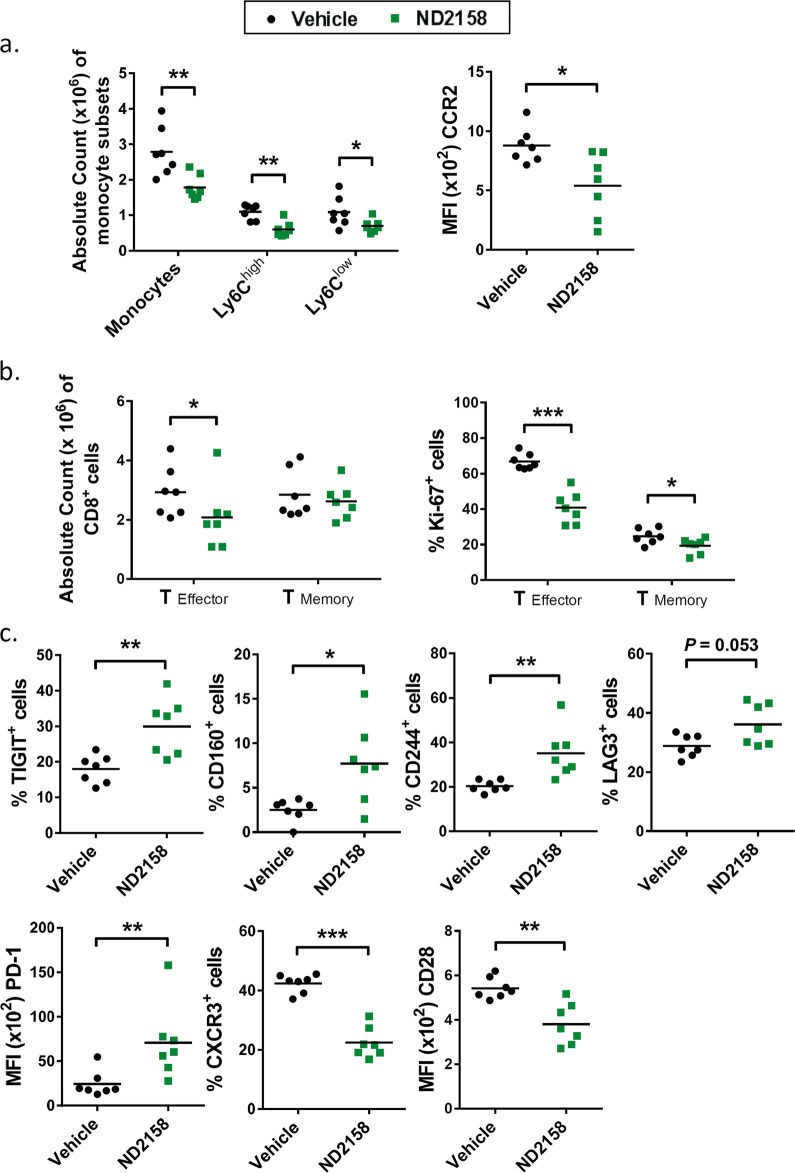
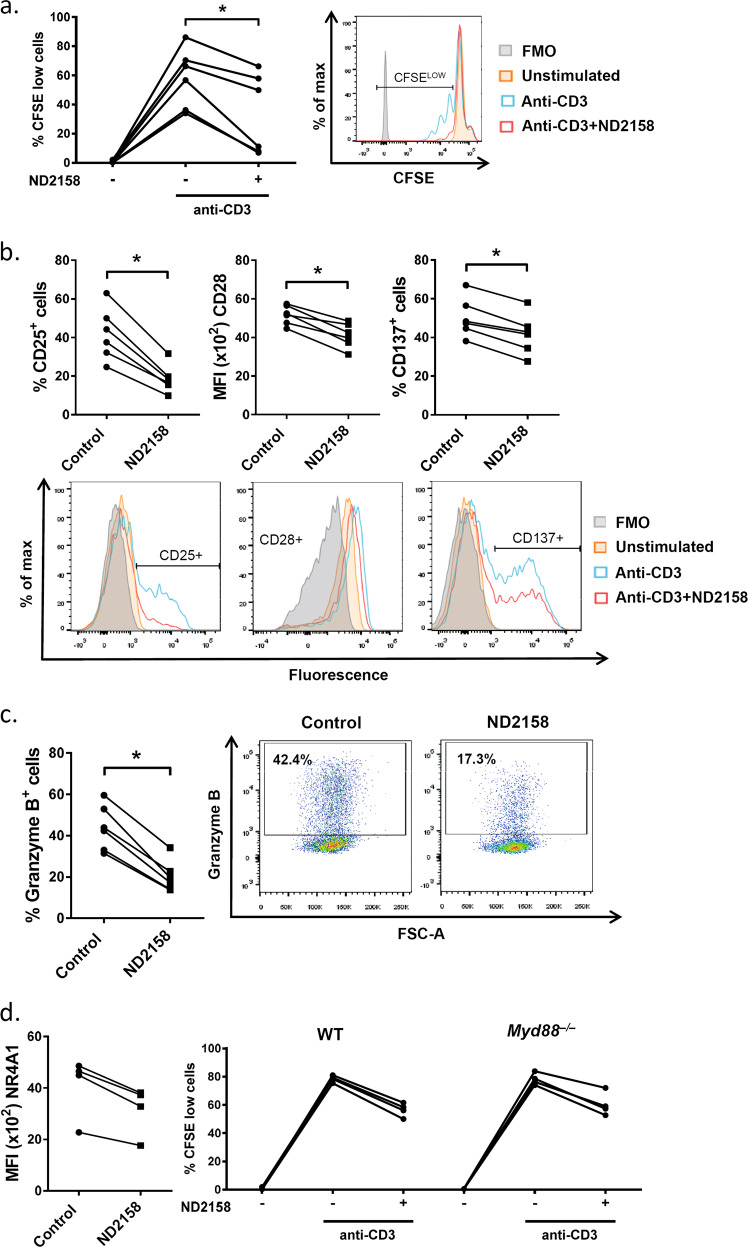
Interleukin-1 receptor-associated kinase 4 (IRAK4) plays a critical role in Toll-like receptor (TLR) signal transduction and innate immune responses. Recruitment and subsequent activation of IRAK4 upon TLR stimulation is mediated by the myeloid differentiation primary response 88 (MYD88) adaptor protein. Around 3% of chronic lymphocytic leukemia (CLL) patients have activating mutations of MYD88, a driver mutation in this disease. Here, we studied the effects of TLR activation and the pharmacological inhibition of IRAK4 with ND2158, an IRAK4 competitive inhibitor, as a therapeutic approach in CLL. Our in vitro studies demonstrated that ND2158 preferentially killed CLL cells in a dose-dependent manner. We further observed a decrease in NF-κB and STAT3 signaling, cytokine secretion, proliferation and migration of primary CLL cells from MYD88-mutated and -unmutated cases. In the Eµ-TCL1 adoptive transfer mouse model of CLL, ND2158 delayed tumor progression and modulated the activity of myeloid and T cells. Our findings show the importance of TLR signaling in CLL development and suggest IRAK4 as a therapeutic target for this disease.


Conflict of interest statement

The authors declare that they have no conflict of interest.

Figures

Fig. 1
Fig. 1
MYD88-mutated CLL cases harbor an inflammatory phenotype. a TLR gene expression profile in CLL cells comparing MYD88-mutated (n = 18 IGHV-mutated) and MYD88-unmutated cases (n = 249 IGHV-mutated and n = 143 IGHV-unmutated). b Gene set enrichment analysis comparing MYD88-mutated (n = 18) versus MYD88-unmutated (n = 249) CLL cases (all IGHV-mutated). c Left panel: Cytokine transcript levels of MYD88-mutated (n = 18) and MYD88-unmutated CLL cases (n = 249 IGHV-mutated CLL samples) analyzed by gene expression profile. Right panel: Cytokine secretion of CLL cells from MYD88-mutated (n = 6) and MYD88-unmutated (n = 9) cases (all IGHV-mutated) was analyzed after 48 h of culture by flow cytometry using Luminex® Bead Panel. Bars represent the mean ± SEM of all samples analyzed. Wilcoxon signed-rank test was used for statistical analysis. *P < 0.05, ***P < 0.001. Gene sets with false discovery rate (FDR) q value < 0.05 and a normalized enrichment score (NES) ≥ 1.5 were considered to be significantly enriched in the mutated group. M mutated, UM unmutated
Fig. 2
Fig. 2
TLR stimulation increases cytokine secretion, NF-κB and STAT3 signaling and proliferation of CLL cells. CLL cells were cultured with single TLR agonists or the TLR agonist mix (Pam3CSK4, HKLM, FSL1 and ODN2006). a Heatmap representing cytokine secretion in CLL supernatants after 48 h of TLR stimulation of MYD88-mutated and MYD88-unmutated cases (n = 5 each) analyzed by flow cytometry Luminex® Bead Panel. The level of secretion of each cytokine is represented relative to each control. b Western blot analysis of IκBαpS32/36 and STAT3pY705 phosphorylation and total levels of IκBα and STAT3 in CLL cell extracts after 3 h of single or TLR agonist mix stimulation. Analysis of α-tubulin was used as loading control. A representative MYD88-mutated (#07) and MYD88-unmutated (#25) CLL case are shown. Ratios of phosphorylated and total protein levels were calculated and provided numbers are as fold changes relative to the untreated control sample. c Cytokine secretion after 48 h of TLR stimulation was assessed in cell culture supernatants of MYD88-unmutated (n = 3) and MYD88-mutated (n = 5) CLL cases by flow cytometry Luminex® Bead Panel. Data are presented as fold change relative to unstimulated control. Wilcoxon signed-rank test was used for statistical analysis. d Left panel: Percentage of proliferating CD19+ CLL cells after single or TLR agonist mix stimulation for 6 days measured by CFSE dilution (n = 3 MYD88-mutated; n = 6 MYD88-unmutated). Right panel: Flow cytometry histogram of a representative MYD88-unmutated CLL case (#51) shows proliferating cells (gated on viable CD19+ cells) after 6 days of TLR and IL15 stimulation. A decrease in CFSE signal is indicative for cells that have divided. Wilcoxon matched-paired signed-rank test was used for statistical analysis. Horizontal bars represent population means. n.s. not significant, P ≥ 0.05, *P < 0.05, **P < 0.01. M mutated, UM unmutated, FMO fluorescence-minus-one
Fig. 3
Fig. 3
ND2158 exerts preferential cytotoxicity for CLL cells. a Viability was analyzed by flow cytometry after 48 h of incubation of cells in culture at ND2158 concentrations from 10 to 100 µM in MYD88-mutated IGHV-mutated (n = 6), MYD88-unmutated IGHV-mutated (n = 16) CLL samples, and in CD19+ B cells and CD3+ T cells from healthy donors (n = 10). Percentage of viable cells was measured by Annexin-V and normalized to untreated control. b Viability of ND2158-treated CLL cells was analyzed after TLR stimulation for 2- (n = 12) and 6 days (n = 6). c Left panel: Percentage of proliferating CD19+ CLL cells after TLR stimulation and ND2158 treatment for 6 days measured by CFSE dilution (n = 5 MYD88-mutated; n = 7 MYD88-unmutated). Right panel: Flow cytometry histogram of a representative MYD88-unmutated CLL case (#51) shows proliferating cells (gated on viable CD19+ cells) after 6 days of TLR and IL15 stimulation and ND2158 treatment. A decrease in CFSE signal is indicative for cells that have divided. Wilcoxon signed-rank test was used for statistical analysis. Horizontal bars represent population means. *P < 0.05, **P < 0.01, ***P < 0.001, ****P < 0.0001. M mutated, UM unmutated
Fig. 4
Fig. 4
Impact of ND2158 on CLL cell signaling, cytokine release and migration. CLL cells were stimulated in vitro with TLR agonist mix for 30 min, before 10 µM ND2158 was added to the culture. a Left panel: Binding of p65 or p52 to NF-κB consensus sequence was analyzed using nuclear extracts from CLL cells of MYD88-mutated (n = 4) and MYD88-unmutated (n = 4) samples via a DNA-binding ELISA-based assay 3 h after treatment. Values are represented relative to untreated samples. Right panel: p65 translocation to the nucleus was analyzed by immunofluorescence microscopy in a representative MYD88-mutated (#7) and MYD88-unmutated (#19) CLL case 3 h after treatment. p65 was stained with anti-NF-κB p65 antibody (clone D14E12) for 30 min, and incubated with an Alexa546-conjugated secondary antibody (red), and DAPI (blue) was used to stain the nuclei. b Western blot analysis for STAT3pY705 of CLL cell extracts of a representative MYD88-mutated (#1) and MYD88-unmutated CLL case (#19) 3 h after treatment. Ratios of phosphorylated and total protein levels were calculated and provided numbers are fold changes relative to the untreated control sample. c Cytokine secretion in supernatants from CLL cells (n = 4 MYD88-mutated; n = 6 MYD88-unmutated) exposed to TLR agonist mix prior treatment with ND2158 for 48 h was analyzed by a multiplexed sandwich immunoassay based on flow cytometry using Luminex® Bead Panel. Values are presented relative to untreated control. Asterisks indicate statistical significance level relative to control. d Migration of TLR-stimulated CLL cells treated with ND2158 for 3 h (n = 4 MYD88-mutated; n = 5 MYD88-unmutated) towards CXCL12 was analyzed by transwell assays. Values are presented as the ratio of migrating cells and total viable cells, relative to the untreated control. Wilcoxon matched-pairs signed-rank test was used for statistical analysis. Horizontal bars represent population means. n.s. not significant; P ≥ 0.05, *P < 0.05, **P < 0.01. M mutated, UM unmutated
Fig. 5
Fig. 5
Impact of ND2158 on -TCL1 CLL cells and monocytes from mice. Cells were stimulated with TLR agonist mix (B cells) or LPS (monocytes) for 30 min before 10 µM ND2158 treatment. a Left panel: Total splenocytes of 1-year-old leukemic TCL1 mice were treated as described above, and viability of CD19+CD5+ CLL cells was analyzed after 3 days (n = 9) and 6 days (n = 6) by flow cytometry using fixable viability dye. Right panel: Percentage of proliferating CD19+CD5+ CLL cells was measured by CFSE dilution after 3 and 6 days (n = 6). b MACS-sorted B cells from spleens of 1-year-old leukemic TCL1 mice (n = 9) were cultured for 6 h. Left panel: Cytokine secretion data acquired as above are shown relative to untreated control. Cytokine secretion was analyzed by flow cytometry using Luminex® Bead Panel. Right panel: CD25, CD40, CD69 and CD86 expression on CD19+CD5+ CLL cells was analyzed by flow cytometry. c MACS-sorted monocytes from 1-year-old wild-type (WT; n = 3) and TCL1 mice (n = 3) were cultured for 6 h. Left panel: Cytokine secretion data acquired as above are shown relative to untreated control. Asterisks indicate statistical significance level relative to control. Horizontal bars represent population means. Right panel: Median fluorescence intensity (MFI) of CD54 on murine monocytes was analyzed. Wilcoxon matched-pairs signed-rank test was used for statistical analysis. n.s. not significant; P ≥ 0.05, *P < 0.05, **P < 0.01, ***< 0.001
Fig. 6
Fig. 6
ND2158 delays CLL progression in the TCL1 adoptive transfer mouse model. a Treatment schedule of ND2158 in TCL1 AT model. BID twice a day, i.p. intraperitoneally. b Left panel: Absolute tumor cell count (CD19+CD5+) in peripheral blood (PB) over time as analyzed by flow cytometry. Right panel: Spleen weight of vehicle- (n = 7) and ND2158-treated (n = 7) mice. Representative examples of spleens are shown. c Left panel: Tumor load (CD19+CD5+ cells out of CD45+ cells) in spleen (SP), peritoneal cavity (PC), lymph nodes (LN), and bone marrow (BM) as acquired by flow cytometry. Right panel: Median fluorescence intensity (MFI) of PD-L1 in CLL cells from PC and LN. Horizontal bars represent population means. Mann−Whitney test was used for statistical analysis. *P < 0.05, **P < 0.01
Fig. 7
Fig. 7
ND2158 impacts on the tumor microenvironment in the TCL1 adoptive transfer model. a Left panel: Absolute counts of monocytes in the spleen (SP) of vehicle- (n = 7) and ND2158-treated (n = 7) mice. Right panel: CCR2 protein expression (MFI) on Ly6C+ monocytes in the spleen acquired by flow cytometry. b Left panel: Absolute numbers of CD8+ effector and memory T cells in the spleen acquired by flow cytometry. Right panel: Percentage of Ki-67+CD8+ effector and memory T cells in the spleen of vehicle- and ND2158-treated mice analyzed by flow cytometry. c Protein expression analysis of inhibitory receptors and activation markers on CD8+ effector T cells by flow cytometry. Data are shown as percentage of TIGIT+, CD160+, CD244+, LAG3+, and CXCR3+ CD8+ effector T cells for bimodal populations or as MFI of costimulatory receptor CD28 as unimodal population. MFI of PD-1 was analyzed for PD-1+CD8+ effector T cells. Horizontal bars represent population means. Mann−Whitney test was used for statistical analysis. *P < 0.05, **P < 0.01, ***P < 0.001. MFI median fluorescence intensity, FMO fluorescence-minus-one
Fig. 8
Fig. 8
ND2158 impairs proliferation and function of CD8+ T cells in vitro. Cells were stimulated with an anti-CD3 antibody for 30 min followed by treatment with 10 µM ND2158. a Left panel: Human PBMCs from healthy donors (n = 6) were stained with CFSE and percentage of proliferating cells was measured in viable CD8+ T cells after 3 days by flow cytometry. Right panel: A representative histogram of the CFSE signal is shown. b Protein expression of CD25, CD28 and CD137 was analyzed after 24 h of treatment in viable CD8+ T cells by flow cytometry. Quantification of data is shown in the upper row; corresponding representative histograms are shown in the bottom row. Data are shown as percentage of CD25+ or CD137+ CD8+ T cells for bimodal populations, or as MFI of CD28 on CD8+ T cells as unimodal population. c Percentage of granzyme B+ viable CD8+ T cells was analyzed after 24 h of treatment by flow cytometry. Quantification of data is shown on the left; corresponding representative dot plots are shown on the right. Wilcoxon matched-pairs signed-rank test was used for statistical analysis. d Left panel: GFP expression was analyzed by flow cytometry in splenocytes from Nr4a1GFP transgenic mice (n = 4) in viable CD8+ T cells 3 h after treatment with ND2158. Right panel: Splenocytes from wild-type (WT) C57BL/6 (n = 4) and Myd88–/– mice (n = 4) were stained with CFSE and percentage of proliferating cells was analyzed in viable CD8+ T cells after 48 h as described above. *P < 0.05

Similar articles

Cited by

References

    1. Ruprecht CR, Lanzavecchia A. Toll-like receptor stimulation as a third signal required for activation of human naive B cells. Eur J Immunol. 2006;36:810–6. - PubMed
    1. Rawlings DJ, Schwartz MA, Jackson SW, Meyer-Bahlburg A. Integration of B cell responses through Toll-like receptors and antigen receptors. Nat Rev Immunol. 2012;12:282–94. - PMC - PubMed
    1. Pradere JP, Dapito DH, Schwabe RF. The Yin and Yang of Toll-like receptors in cancer. Oncogene. 2014;33:3485–95. - PMC - PubMed
    1. Huang L, Xu H, Peng G. TLR-mediated metabolic reprogramming in the tumor microenvironment: potential novel strategies for cancer immunotherapy. Cell Mol Immunol. 2018;15:428–37. - PMC - PubMed
    1. Ntoufa S, Vilia MG, Stamatopoulos K, Ghia P, Muzio M. Toll-like receptors signaling: a complex network for NF-κB activation in B-cell lymphoid malignancies. Semin Cancer Biol. 2016;39:15–25. - PubMed

Publication types

MeSH terms

Substances