. 2019 Jul;79(2):595-630.
doi: 10.1007/s00285-019-01371-2. Epub 2019 Jun 13.

Mathematical modelling of contact dermatitis from nickel and chromium

Affiliations

Mathematical modelling of contact dermatitis from nickel and chromium

J P Ward et al. J Math Biol. 2019 Jul.

Abstract

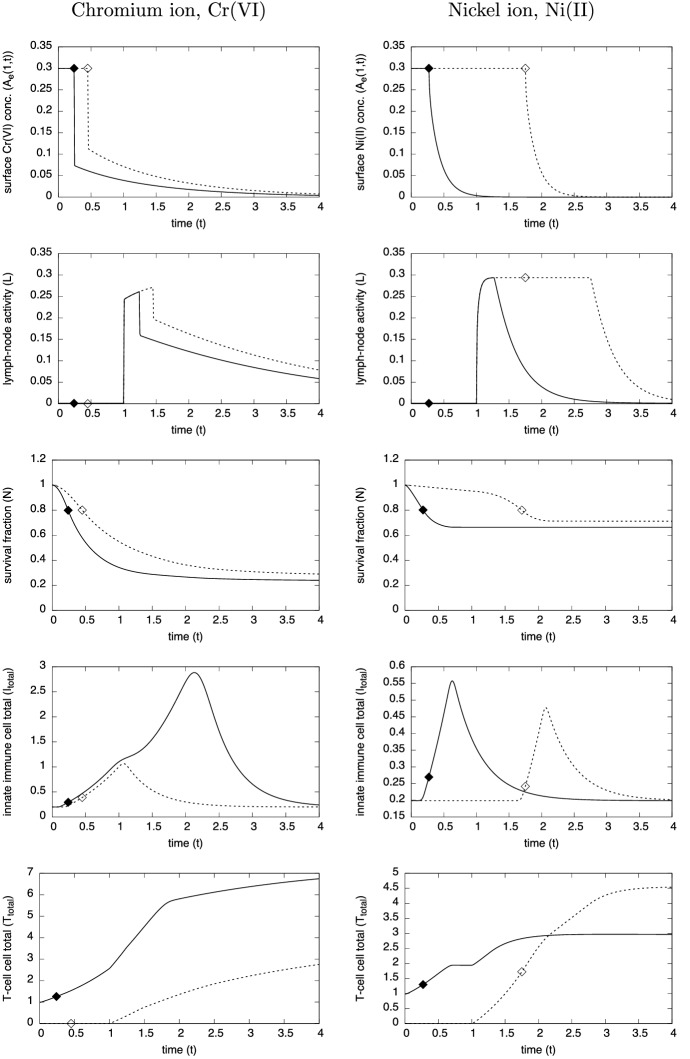
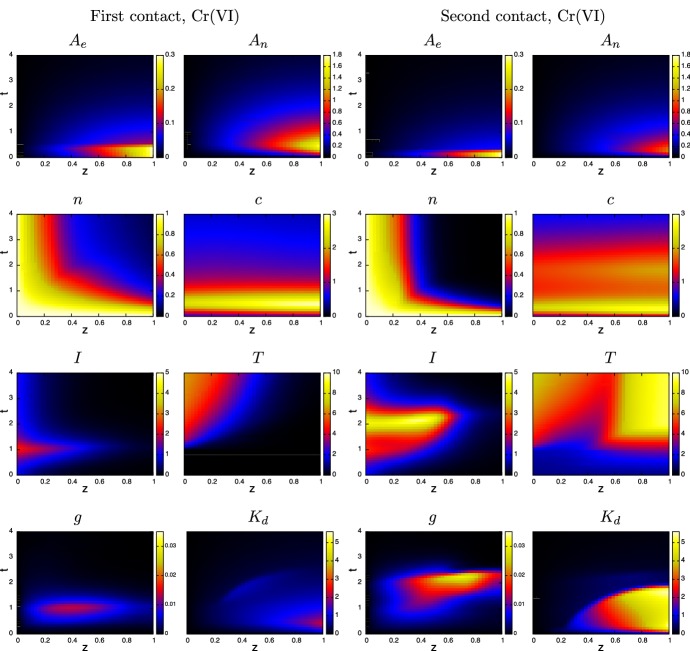
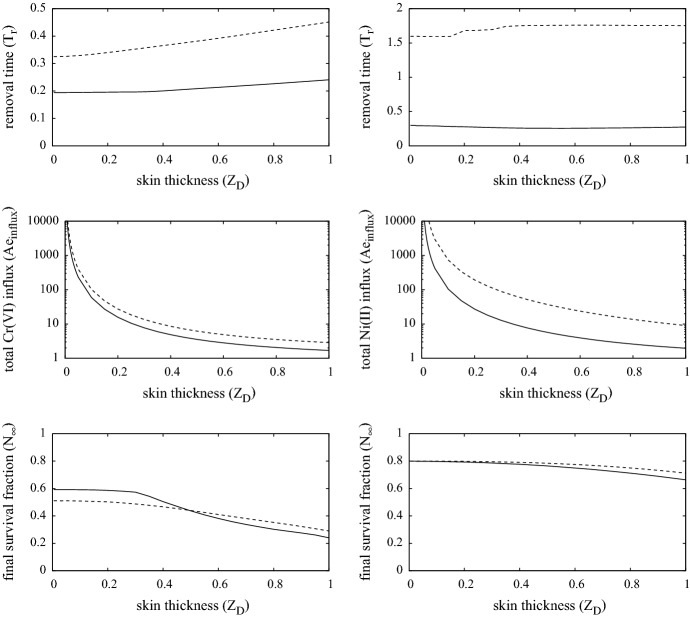
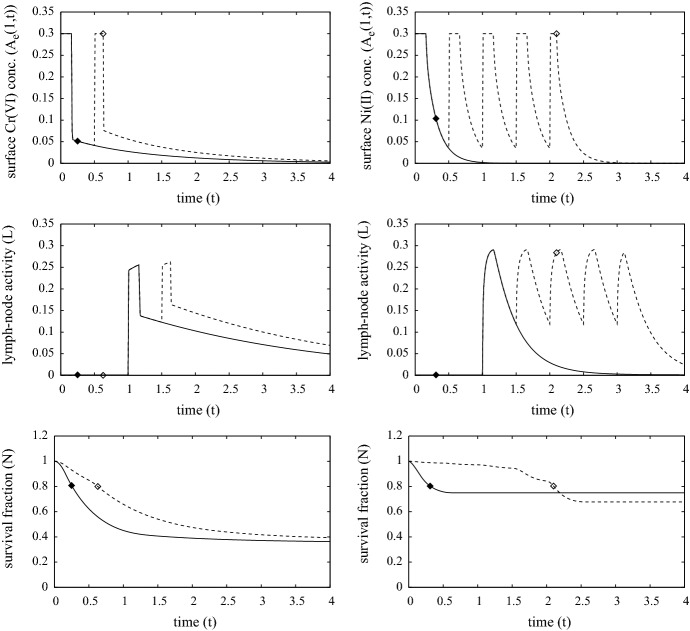
Dermal exposure to metal allergens can lead to irritant and allergic contact dermatitis (ACD). In this paper we present a mathematical model of the absorption of metal ions, hexavalent chromium and nickel, into the viable epidermis and compare the localised irritant and T-lymphocyte (T-cell) mediated immune responses. The model accounts for the spatial-temporal variation of skin health, extra and intracellular allergen concentrations, innate immune cells, T-cells, cytokine signalling and lymph node activity up to about 6 days after contact with these metals; repair processes associated with withdrawal of exposure to both metals is not considered in the current model, being assumed secondary during the initial phases of exposure. Simulations of the resulting system of PDEs are studied in one-dimension, i.e. across skin depth, and three-dimensional scenarios with the aim of comparing the responses to the two ions in the cases of first contact (no T-cells initially present) and second contact (T-cells initially present). The results show that on continuous contact, chromium ions elicit stronger skin inflammation, but for nickel, subsequent re-exposure stimulates stronger responses due to an accumulation of cytotoxic T-cell mediated responses which characterise ACD. Furthermore, the surface area of contact to these metals has little effect on the speed of response, whilst sensitivity is predicted to increase with the thickness of skin. The modelling approach is generic and should be applicable to describe contact dermatitis from a wide range of allergens.

Keywords: Contact dermatitis; Immune response; Mathematical model; Metal ions; Numerical solution.


Figures

Fig. 1
Fig. 1
Schematic of the irritated skin region (proportions not to scale). The metal ion diffuses through the stratum corneum (which may be partly eroded) into the epidermis and dermis (indicated in grey), the latter region contains the vasculature which acts as a source for newly recruited immune cells and as a sink for cytokines and metal ions. The model domain is the grey region
Fig. 2
Fig. 2
Schematic of the irritant and allergenic process as described by the model for the first contact case. The figures show the skin region in the vicinity of the metal ion carrier (MIC), with contours depicting metal ion gradients. On initial contact there is a background level of innate cells, Langerhans cells and cytokines (shown as “bullet”s). Over the first 2 days, innate immune cells respond to chemokine signals and migrate into the infected skin region, whilst primed Langerhans cells migrate to the lymph nodes carrying ion asssociated antigens (shown as “star”s). Within the lymph nodes, the antigen is presented to naive T-cells, activating them to be programmed T-cells. These proliferate and are then released into the system from around Day 2 eventually migrating to the exposed skin region. On removal of the MIC, the skin returns to the pretreated state with a low level of activated immune cell activity. This represents the initial conditions for the second contract case, for which the ‘Day 2+’ scenario is expected to arise notably sooner. Note skin cell death is not shown in the figure
Fig. 3
Fig. 3
Plots of the evolution of surface ion concentrations (top), lymph node activity, survival fraction, total innate immune cell and T-cell densities (bottom) from initial contact of chromium (left) and nickel (right), through MIC removal (when N=0.8, indicated by the white diamond and black diamond) to t=4. First and second contacts are indicated by the dashed (with white diamond) and solid (with black diamond) curves, respectively. Parameters are as listed in Table 4
Fig. 4
Fig. 4
Evolution of the spatial distribution of the model variables over time t=0 to 4 (equivalent to 0–8 days) from contact with chromium (VI) in the 1-D case. The plots in the first two columns are for first-contact and those in the next two are second contact. The colour bars are the same for each of the corresponding variables. Parameters are as listed in Table 4 (color figure online)
Fig. 5
Fig. 5
Evolution of the spatial distribution of the model variables over time t=0 to 4 (equivalent to 0–8 days) from contact with chromium (VI) in the 1-D case. The plots in the first two columns are for first-contact and those in the next two are second contact. The colour bars are the same for each of the corresponding variables. Parameters are as listed in Table 4 (color figure online)
Fig. 6
Fig. 6
Evolution of the spatial distribution over r of N,AeT,IT and TT [from formulae (27) and (28)] over time t=0 to 4 (equivalent to 0–8 days) from contact with a disk of unit radius of chromium(VI) (left two columns) and nickel(II) in the standard case, simulated in 2D assuming radial symmetry. The colour bars are the same for each of the corresponding variables. Parameters are as listed in Table 4 (color figure online)
Fig. 7
Fig. 7
Plots of lymph node activity from contact with a MIC disk of unit radius containing chromium (left) and nickel (right), which was removed when when minr{N(r,t)}=0.8. First and second contacts are indicated by the dashed and solid curves, respectively, whereby the time points for MIC removal are indicated by white diamond (first exposure) and black diamond (second exposure). Parameters are as listed in Table 4
Fig. 8
Fig. 8
Plots showing the removal time, total ion influx and survival fraction at t=4 (steady-state more-or-less reached) against contact surface area following exposure of chromium (left) and nickel (right), with MIC removal occurring when min{N(x,t)}=0.8. The dashed and solid curves are solutions of the 1-D model for first and second exposures, respectively, and the “times” and “plus” are the respective solutions of the 3-D model using cylindrical symmetry with contact radius of 0.1,0.2,0.4,0.6,,2.4 units (1 unit being about 1 cm). Parameters are as listed in Table 4
Fig. 9
Fig. 9
Plots showing the removal time, total Ae infiltration mass and survival fraction as function of external chromium (left) and nickel (right) concentration. The dashed and solid curves are for first and second contact cases. Parameters are as listed in Table 4
Fig. 10
Fig. 10
Plots showing the removal time, total Ae infiltration mass and survival fraction as a function of the scaled skin thickness ZD (ZD=1 is about 2 mm) in response to chromium (left) and nickel (right) ions. The dashed and solid curves are for first and second contact cases. Parameters are as listed in Table 4
Fig. 11
Fig. 11
Plots showing the removal time, lymph-node activity and survival fraction against time following repeated exposure of chromium (left) and nickel (right), where dashed and solid curves are first and second exposures, respectively; the time points for permanent MIC removal are indicated by white diamond (first exposure) and black diamond (second exposure). The plots show 8 h exposure (t=0.167) followed by 16 h non-exposure until N=0.8 when contact ceases. Parameters are as listed in Table 4
Fig. 12
Fig. 12
Plots showing the lymph-node activity and survival fraction against time following first-contact exposure of chromium (top) and nickel (bottom), in which a distributive time delay is assumed as defined by Eq. (30). Dotted curves are for σ=0 (i.e. that used in all other simulations), the dashed and solid curves are for σ=0.1 (2.4 h) and σ=0.2 (4.8 h), respectively. The time point at which the MIC is removed are indicated by a white diamond. Parameters are as listed in Table 4

References

    1. Brach M, deVos S, Gruss H, Herrmann F. Prolongation of survival of human polymorphonuclear neutrophils by granulocyte-macrophage colony stimulating factor is caused by inhibition of programmed cell death. Blood. 1992;80(11):2920–2924. - PubMed
    1. Budinger L, Hertl M. Immunologic mechanisms in hypersensitivity reactions to metal ions: an overview. Allergy. 2000;55:108–115. doi: 10.1034/j.1398-9995.2000.00107.x. - DOI - PubMed
    1. Callard R, George A, Stark J. Cytokines, chaos, and complexity. Immunity. 1999;11:507–513. doi: 10.1016/S1074-7613(00)80125-9. - DOI - PubMed
    1. Cherry N, Meyer J, Adisesh A, Brooke R, Owen-Smith V, Swales C, Beck M. Surveillance of occupational skin disease: EPIDERM and OPRA. Brit J Derm. 2000;142(6):1128–1134. doi: 10.1046/j.1365-2133.2000.03537.x. - DOI - PubMed
    1. Curtis A, Morton J, Balafa C, MacNeil S, Gawkrodger D, Warrem N, Evans G. The effects of nickel and chromium on human keratinocytes: differences in viability, cell associated metal and IL-1alpha release. Toxicol In Vitro. 2007;21(5):809–819. doi: 10.1016/j.tiv.2007.01.026. - DOI - PubMed

Publication types

LinkOut - more resources