

Regional and Racial Inequality in Infectious Disease Mortality in U.S. Cities, 1900-1948
- PMID: 31197611
- PMCID: PMC7258300
- DOI: 10.1007/s13524-019-00789-z
Regional and Racial Inequality in Infectious Disease Mortality in U.S. Cities, 1900-1948
Abstract
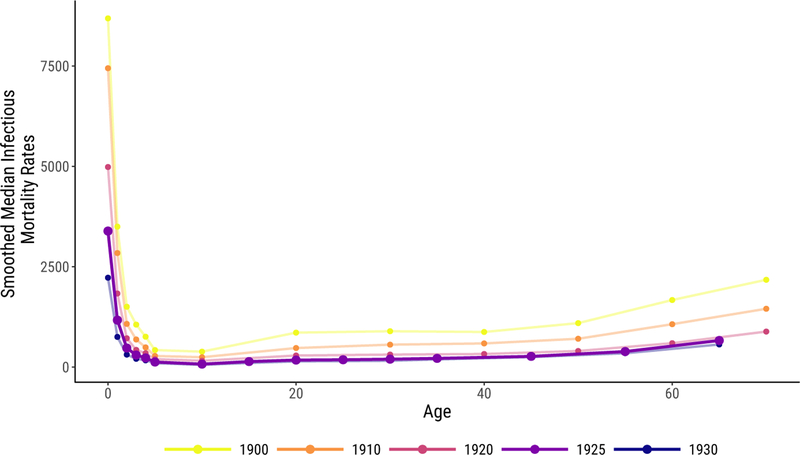
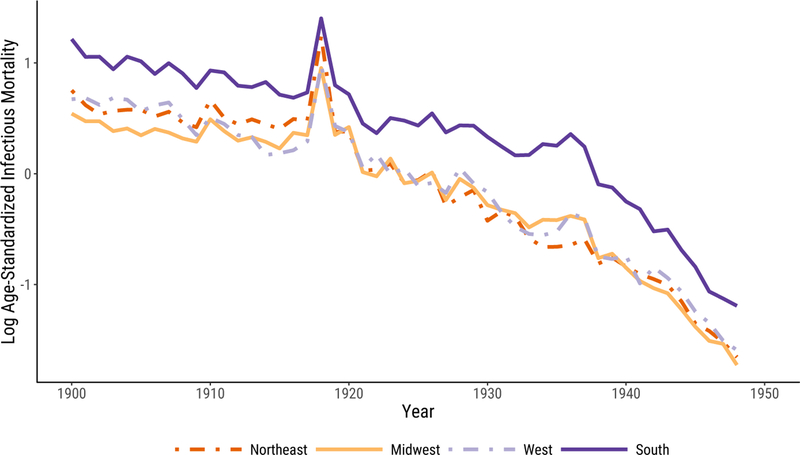
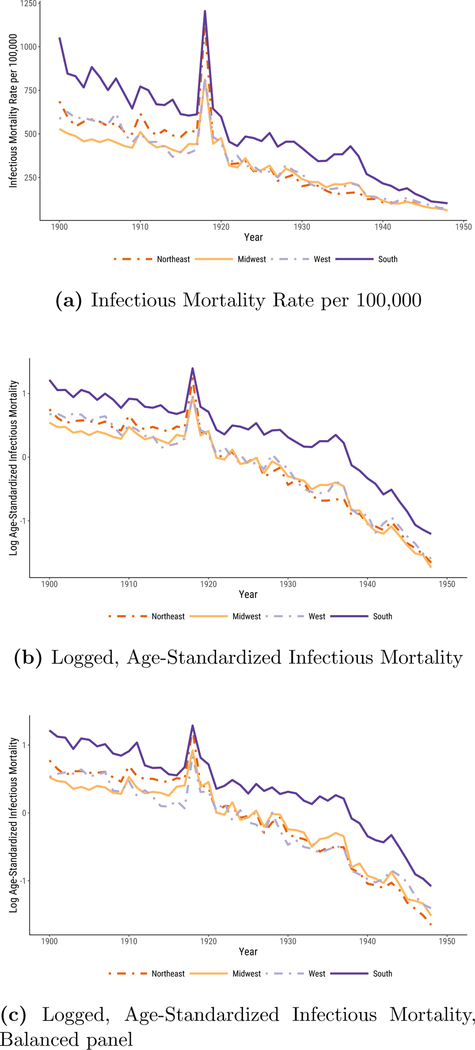
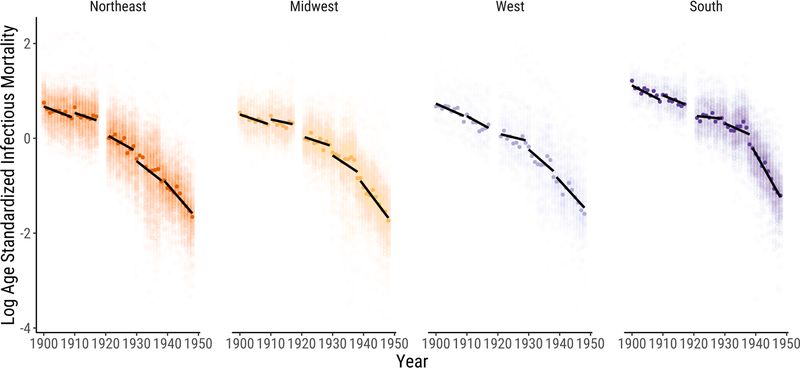
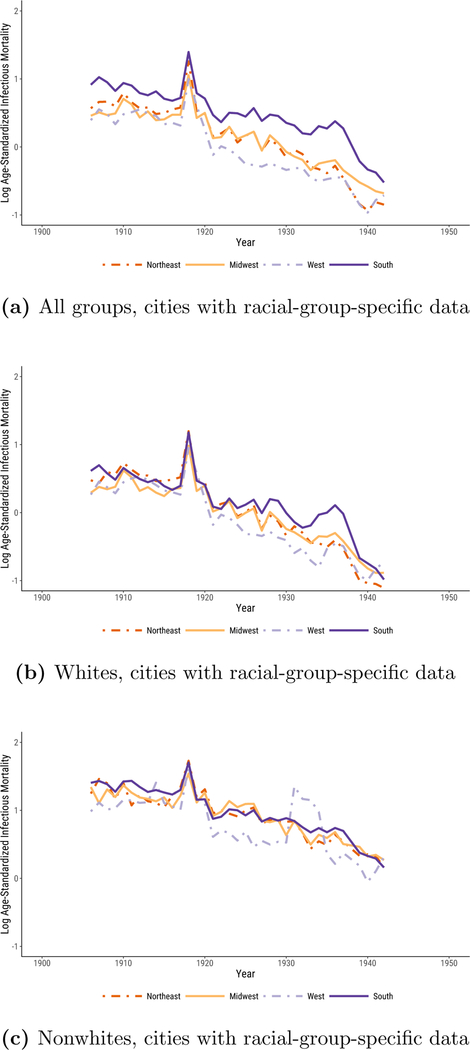
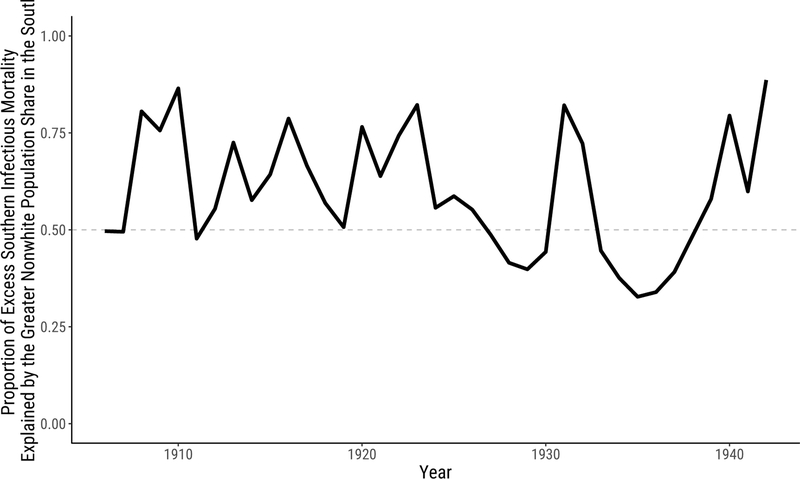
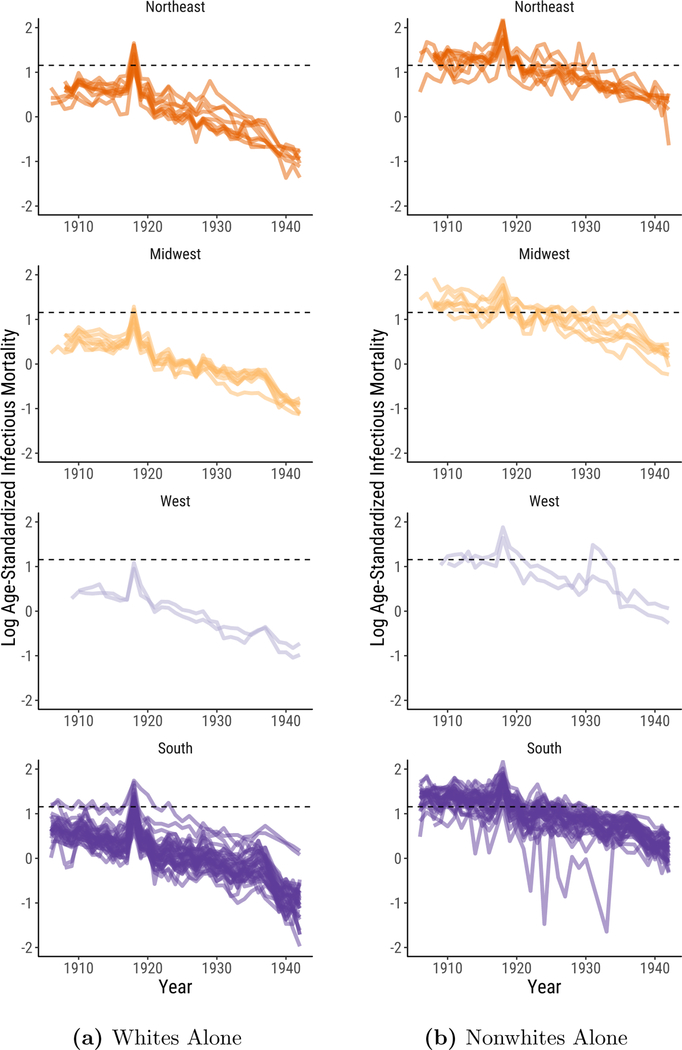
In the first half of the twentieth century, the rate of death from infectious disease in the United States fell precipitously. Although this decline is well-known and well-documented, there is surprisingly little evidence about whether it took place uniformly across the regions of the United States. We use data on infectious disease deaths from all reporting U.S. cities to describe regional patterns in the decline of urban infectious mortality from 1900 to 1948. We report three main results. First, urban infectious mortality was higher in the South in every year from 1900 to 1948. Second, infectious mortality declined later in southern cities than in cities in the other regions. Third, comparatively high infectious mortality in southern cities was driven primarily by extremely high infectious mortality among African Americans. From 1906 to 1920, African Americans in cities experienced a rate of death from infectious disease that was greater than what urban whites experienced during the 1918 flu pandemic.
Keywords: Economic history; Epidemiological transition; Inequality; Infectious disease; Mortality.
Figures
Similar articles
-
Declining Mortality Inequality within Cities during the Health Transition.Am Econ Rev. 2015 May;105(5):564-9. doi: 10.1257/aer.p20151070. Am Econ Rev. 2015. PMID: 29543414
-
Does adult height predict later mortality?: Comparative evidence from the Early Indicators samples in the United States.Econ Hum Biol. 2019 Aug;34:274-285. doi: 10.1016/j.ehb.2019.05.004. Epub 2019 Jun 8. Econ Hum Biol. 2019. PMID: 31231014 Free PMC article.
-
Racial and ethnic disparities in infant mortality rates--60 largest U.S. cities, 1995-1998.MMWR Morb Mortal Wkly Rep. 2002 Apr 19;51(15):329-32, 343. MMWR Morb Mortal Wkly Rep. 2002. PMID: 11990238
-
Race and 1918 Influenza Pandemic in the United States: A Review of the Literature.Int J Environ Res Public Health. 2019 Jul 12;16(14):2487. doi: 10.3390/ijerph16142487. Int J Environ Res Public Health. 2019. PMID: 31336864 Free PMC article. Review.
-
Urban and rural differences in cardiovascular disease in blacks.Cardiovasc Clin. 1991;21(3):17-28. Cardiovasc Clin. 1991. PMID: 2044102 Review. No abstract available.
Cited by
-
US racial inequality may be as deadly as COVID-19.Proc Natl Acad Sci U S A. 2020 Sep 8;117(36):21854-21856. doi: 10.1073/pnas.2014750117. Epub 2020 Aug 24. Proc Natl Acad Sci U S A. 2020. PMID: 32839337 Free PMC article.
-
Evidence that Vitamin D Supplementation Could Reduce Risk of Influenza and COVID-19 Infections and Deaths.Nutrients. 2020 Apr 2;12(4):988. doi: 10.3390/nu12040988. Nutrients. 2020. PMID: 32252338 Free PMC article. Review.
-
Crowd Salience Heightens Tolerance to Healthy Facial Features.Adapt Human Behav Physiol. 2021;7(4):432-446. doi: 10.1007/s40750-021-00176-2. Epub 2021 Sep 21. Adapt Human Behav Physiol. 2021. PMID: 34567952 Free PMC article.
-
Racial Disparities in Mortality During the 1918 Influenza Pandemic in United States Cities.Demography. 2022 Oct 1;59(5):1953-1979. doi: 10.1215/00703370-10235825. Demography. 2022. PMID: 36124998 Free PMC article.
-
Operationalizing racialized exposures in historical research on anti-Asian racism and health: a comparison of two methods.Front Public Health. 2023 Jul 6;11:983434. doi: 10.3389/fpubh.2023.983434. eCollection 2023. Front Public Health. 2023. PMID: 37483944 Free PMC article.
References
-
- Acevedo-Garcia Dolores. 2000. “Residential Segregation and the Epidemiology of Infectious Diseases.” Social Science & Medicine 51:1143–1161. - PubMed
-
- Anderson D. Mark Kerwin Kofi Charles, Olivares Claudio Las Heras, and Rees Daniel. 2017. “Was The First Public Health Campaign Successful? The Tuberculosis Movement and Its Effect on Mortality.” National Bureau of Economic Research Working Paper 23219:1–66.
-
- Anderson D. Mark Kerwin Kofi Charles, and Rees Daniel. 2018. “Public Health Efforts and the Decline in Urban Mortality.” National Bureau of Economic Research Working Paper 25027:1–60.
-
- Anderson Robert N. 2011. “Coding and Classifying Causes of Death: Trends and International Differences” In International Handbook of Adult Mortality, edited by Rogers Richard G. and Crimmins Eileen M., pp. 467–489. Dordrecht: Springer.
