Estimating County-Level Mortality Rates Using Highly Censored Data From CDC WONDER
- PMID: 31198162
- PMCID: PMC6583819
- DOI: 10.5888/pcd16.180441
Estimating County-Level Mortality Rates Using Highly Censored Data From CDC WONDER
Abstract
Introduction: CDC WONDER is a system developed to promote information-driven decision making and provide access to detailed public health information to the general public. Although CDC WONDER contains a wealth of data, any counts fewer than 10 are suppressed for confidentiality reasons, resulting in left-censored data. The objective of this analysis was to describe methods for the analysis of highly censored data.
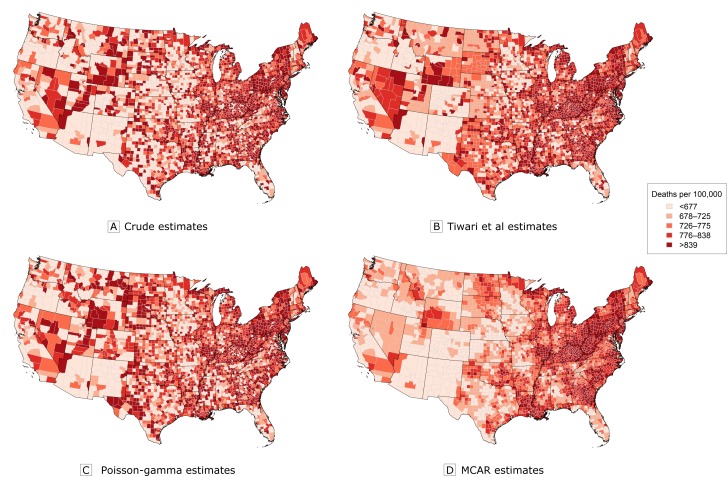
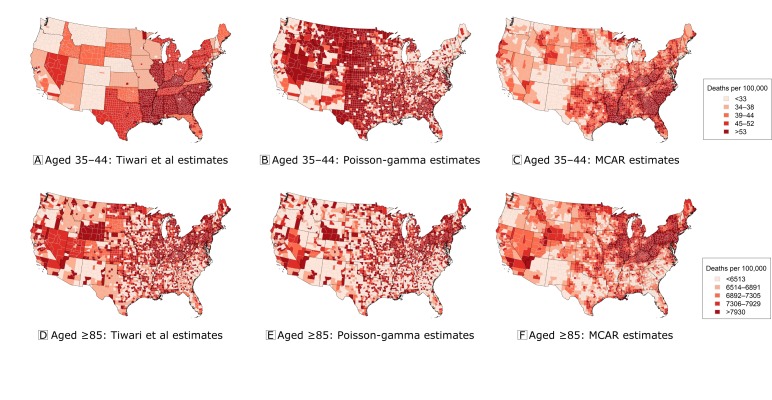
Methods: A substitution approach was compared with 1) a simple, nonspatial Bayesian model that smooths rates toward their statewide averages and 2) a more complex Bayesian model that accounts for spatial and between-age sources of dependence. Age group-specific county-level data on heart disease mortality were used for the comparisons.
Results: Although the substitution and nonspatial approach provided age-standardized rate estimates that were more highly correlated with the true rate estimates, the estimates from the spatial Bayesian model provided a superior compromise between goodness-of-fit and model complexity, as measured by the deviance information criterion. In addition, the spatial Bayesian model provided rate estimates with greater precision than the nonspatial approach; in contrast, the substitution approach did not provide estimates of uncertainty.
Conclusion: Because of the ability to account for multiple sources of dependence and the flexibility to include covariate information, the use of spatial Bayesian models should be considered when analyzing highly censored data from CDC WONDER.
Figures
Similar articles
-
CDC WONDER: a comprehensive on-line public health information system of the Centers for Disease Control and Prevention.Am J Public Health. 1993 Sep;83(9):1289-94. doi: 10.2105/ajph.83.9.1289. Am J Public Health. 1993. PMID: 8395776 Free PMC article.
-
Part 2. Development of Enhanced Statistical Methods for Assessing Health Effects Associated with an Unknown Number of Major Sources of Multiple Air Pollutants.Res Rep Health Eff Inst. 2015 Jun;(183 Pt 1-2):51-113. Res Rep Health Eff Inst. 2015. PMID: 26333239
-
Comparing Cardiovascular Mortality Estimates From Global Burden of Disease and From the Centers for Disease Control and Prevention Wide-Ranging Online Data for Epidemiological Research.Circ Cardiovasc Qual Outcomes. 2025 May;18(5):e011459. doi: 10.1161/CIRCOUTCOMES.124.011459. Epub 2025 Apr 4. Circ Cardiovasc Qual Outcomes. 2025. PMID: 40184153
-
Bayesian ranking of sites for engineering safety improvements: decision parameter, treatability concept, statistical criterion, and spatial dependence.Accid Anal Prev. 2005 Jul;37(4):699-720. doi: 10.1016/j.aap.2005.03.012. Epub 2005 Apr 12. Accid Anal Prev. 2005. PMID: 15949462 Review.
-
Bayesian point event modeling in spatial and environmental epidemiology.Stat Methods Med Res. 2012 Oct;21(5):509-29. doi: 10.1177/0962280212446328. Stat Methods Med Res. 2012. PMID: 23035034 Review.
Cited by
-
Population Health, Place, and Space: Spatial Perspectives in Chronic Disease Research and Practice.Prev Chronic Dis. 2019 Sep 5;16:E123. doi: 10.5888/pcd16.190237. Prev Chronic Dis. 2019. PMID: 31489834 Free PMC article. No abstract available.
-
An introduction to bayesian spatial smoothing methods for disease mapping: modeling county firearm suicide mortality rates.Am J Epidemiol. 2024 Jul 8;193(7):1002-1009. doi: 10.1093/aje/kwae005. Am J Epidemiol. 2024. PMID: 38375682 Free PMC article.
-
Reliable event rates for disease mapping.J Off Stat. 2024 Jun;40(2):333-347. doi: 10.1177/0282423x241244917. Epub 2024 May 22. J Off Stat. 2024. PMID: 39364189 Free PMC article.
-
Seminar: Scalable Preprocessing Tools for Exposomic Data Analysis.Environ Health Perspect. 2023 Dec;131(12):124201. doi: 10.1289/EHP12901. Epub 2023 Dec 18. Environ Health Perspect. 2023. PMID: 38109119 Free PMC article.
-
Explainable artificial intelligence (XAI) for exploring spatial variability of lung and bronchus cancer (LBC) mortality rates in the contiguous USA.Sci Rep. 2021 Dec 16;11(1):24090. doi: 10.1038/s41598-021-03198-8. Sci Rep. 2021. PMID: 34916529 Free PMC article.
References
-
- Centers for Disease Control and Prevention. CDC WONDER, 2017. http://wonder.cdc.gov. Accessed March 17, 2017.
-
- Centers for Disease Control and Prevention. CDC/ATSDR policy on releasing and sharing data. Manual; guide CDC-02. 2003. http://www.cdc.gov/maso/Policy/ReleasingData.pdf. Accessed June 30, 2015.
MeSH terms
LinkOut - more resources
Full Text Sources