. 2019 Jun 7:10:25.
doi: 10.1186/s13229-019-0278-0. eCollection 2019.

CYFIP1 overexpression increases fear response in mice but does not affect social or repetitive behavioral phenotypes

Affiliations

CYFIP1 overexpression increases fear response in mice but does not affect social or repetitive behavioral phenotypes

Catherine Fricano-Kugler et al. Mol Autism. .

Abstract

Background: CYFIP1, a protein that interacts with FMRP and regulates protein synthesis and actin dynamics, is overexpressed in Dup15q syndrome as well as autism spectrum disorder (ASD). While CYFIP1 heterozygosity has been rigorously studied due to its loss in 15q11.2 deletion, Prader-Willi and Angelman syndrome, the effects of CYFIP1 overexpression, as is observed in patients with CYFIP1 duplication, are less well understood.

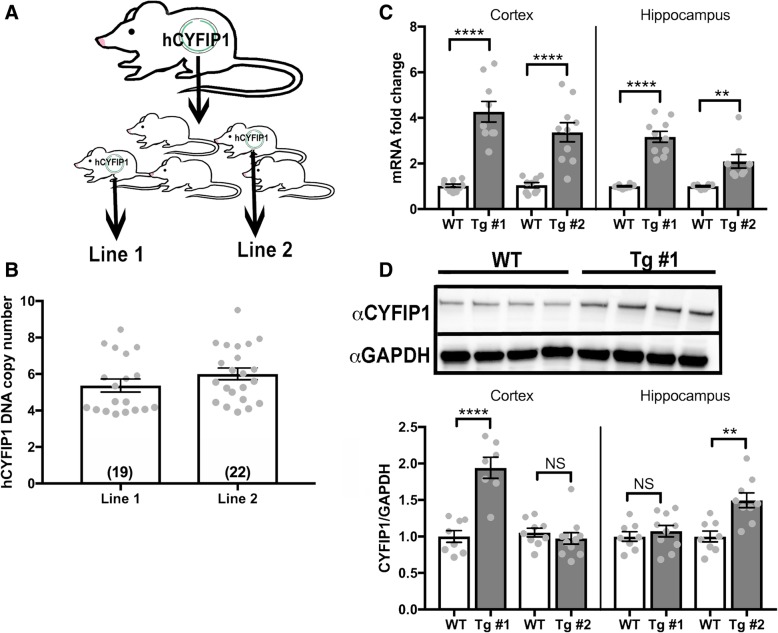
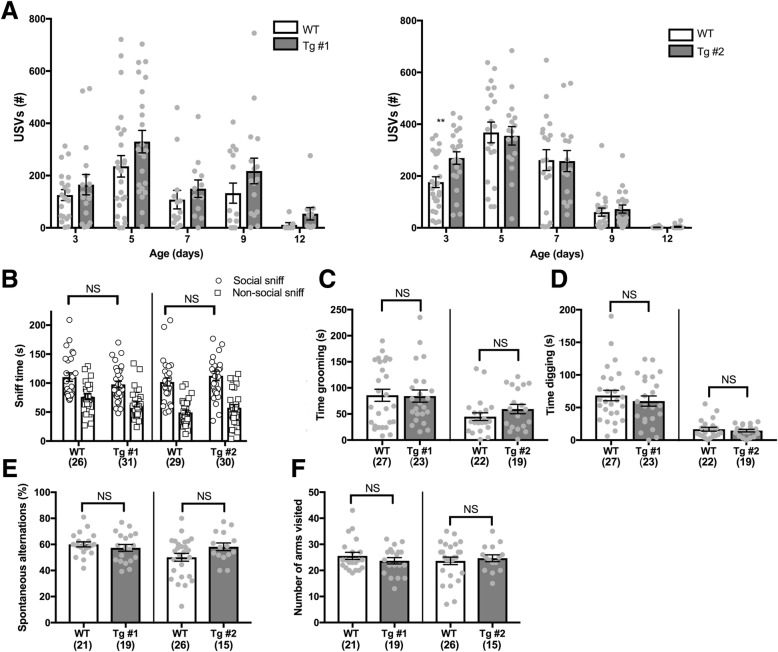
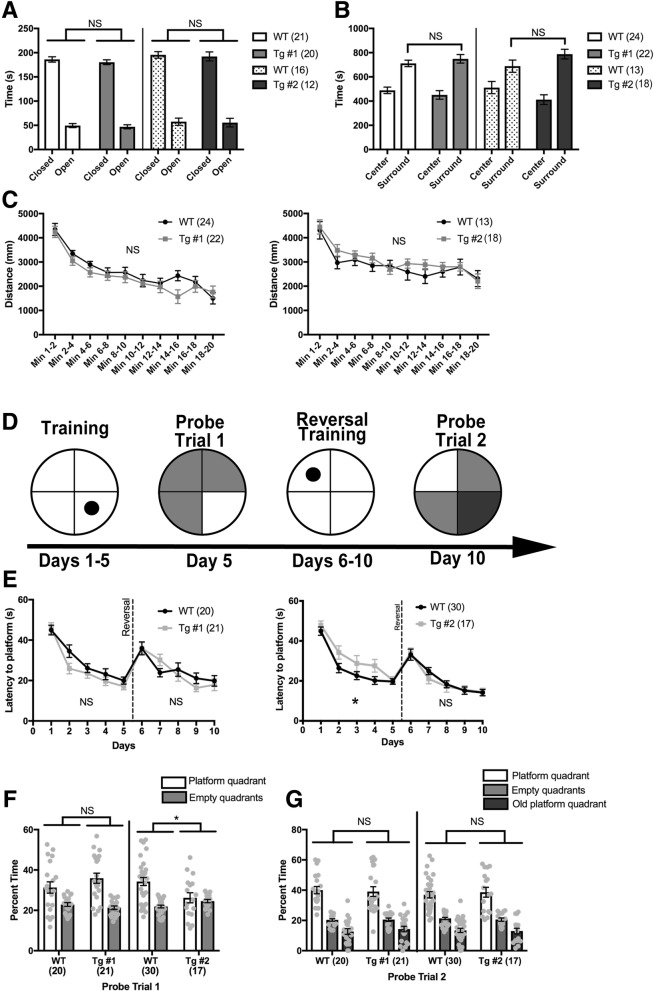
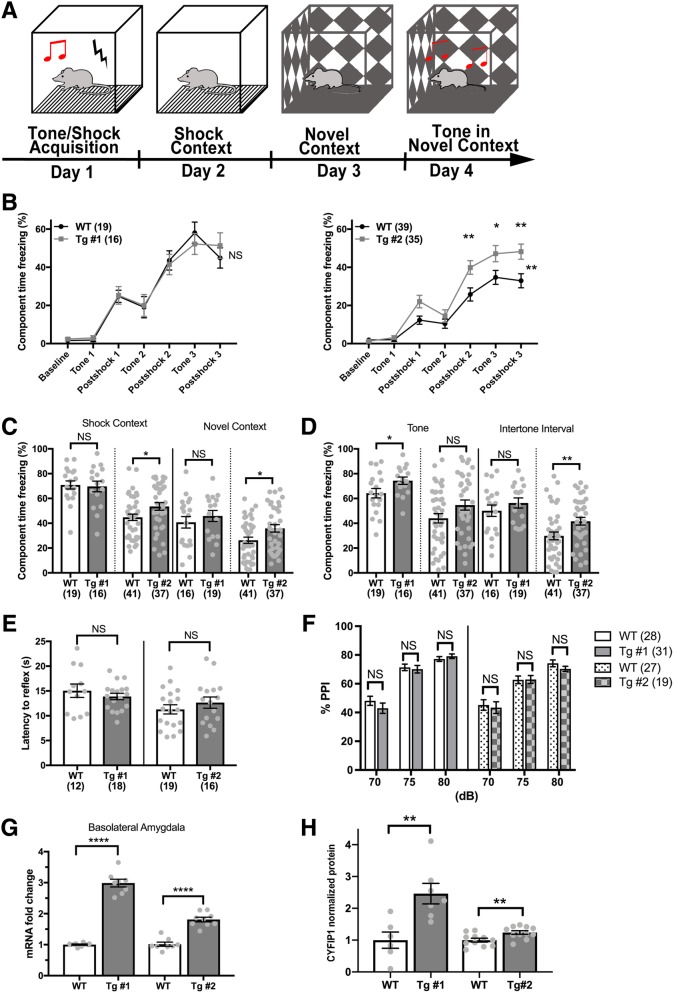
Methods: We developed and validated a mouse model of human CYFIP1 overexpression (CYFIP1 OE) using qPCR and western blot analysis. We performed a large battery of behavior testing on these mice, including ultrasonic vocalizations, three-chamber social assay, home-cage behavior, Y-maze, elevated plus maze, open field test, Morris water maze, fear conditioning, prepulse inhibition, and the hot plate assay. We also performed RNA sequencing and analysis on the basolateral amygdala.

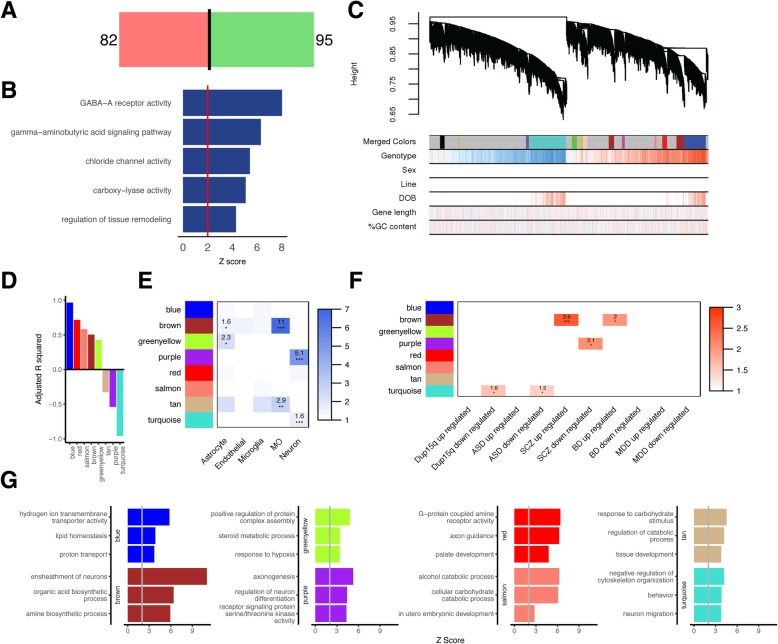
Results: Extensive behavioral testing in CYFIP1 OE mice reveals no changes in the core behaviors related to ASD: social interactions and repetitive behaviors. However, we did observe mild learning deficits and an exaggerated fear response. Using RNA sequencing of the basolateral amygdala, a region associated with fear response, we observed changes in pathways related to cytoskeletal regulation, oligodendrocytes, and myelination. We also identified GABA-A subunit composition changes in basolateral amygdala neurons, which are essential components of the neural fear conditioning circuit.

Conclusion: Overall, this research identifies the behavioral and molecular consequences of CYFIP1 overexpression and how they contribute to the variable phenotype seen in Dup15q syndrome and in ASD patients with excess CYFIP1.

Keywords: Autism spectrum disorder (ASD); CYFIP1; Dup15q; Fear conditioning; Mouse behavior; Neurodevelopmental disorders; RNA sequencing.


Conflict of interest statement

Competing interestsThe authors declare that they have no competing interests.

Figures

Fig. 1
Fig. 1
Creation and molecular characterization of human CYFIP1-overexpressing mice. a CYFIP1-overexpressing mice were created via pronuclear injection of a BAC containing the coding sequence for the human CYFIP1 gene. Two progeny with the highest cDNA copy number were selected to breed with wild-type C57BL6/N mice in order to establish transgenic lines 1 and 2. b hCYFIP1 copy number was confirmed using a Taqman copy number qPCR assay (Line 1 = 5.4 ± 0.34, Line 2 = 6.0 ± 0.32). c CYFIP1 mRNA expression was assessed in the cortex and hippocampus of p60 transgenic mice using qPCR. There was a significant increase in CYFIP1 mRNA expression in transgenic mice compared to their wild-type littermates (Line 1 cortex: WT = 1.03 ± 0.07, Tg #1 = 4.27 ± 0.45. Line 2 cortex: WT = 1.05 ± 0.11, Tg #2 = 3.37 ± 0.42. Line 1 hippocampus: WT = 1.00 ± 0.03, Tg #1 = 3.17 ± 0.24. Line 2 hippocampus: WT = 1.00 ± 0.03, Tg #2 = 2.10 ± 0.30). d CYFIP1 protein expression varied by region and line in p60 mice as shown by western blot analysis. The representative blot shows cortical CYFIP1 protein expression from four Line 1 WT and 4 Tg #1 animal. Line 1 had a significant increase in CYFIP1 protein expression in the cortex, but there was no detectable overexpression in the hippocampus. Line 2 showed significant CYFIP1 overexpression in the cortex but not in the hippocampus (Line 1 cortex: WT = 1.00 ± 0.80, Tg #1 = 1.94 ± 0.15. Line 2 cortex: WT = 1.05 ± 0.06, Tg #2 = 0.97 ± 0.08. Line 1 hippocampus: WT = 1 ± 0.07, Tg #1 = 1.07 ± 0.08. Line 2 hippocampus: WT = 1.00 ± 0.08, Tg #2 = 1.50 ± 0.10). P values were calculated using Student’s t test. NS, not significant. **p < 0.01. **** p < 0.0001. See Table S1 for n’s
Fig. 2
Fig. 2
CYFIP1-overexpressing mice have no deficits in social communication or repetitive behaviors. a Ultrasonic vocalizations (USVs) provoked by pup/dam separation were assessed in pups at postnatal days 3, 5, 7, 9, and 12 for 5 min at each time point. There was a significant increase in the number of vocalizations at day 3 in Tg line #2 compared to their WT littermates (WT = 176.6 ± 20.8, Tg #2 = 269.3 ± 24.2). b CYFIP1 mice were tested for social deficits using the three-chamber social test. Both WT and Tg mice spent more time interacting with another mouse when given the choice between a stimulus mouse and an empty cup (social sniff: Line 1: WT = 110.4 ± 7.4, Tg #1 = 97.719 ± 5.5. Non-social sniff: Line 1 WT: 76.2 ± 5.1, Tg #1 = 63.2 ± 4.3. Social Sniff: Line 2: WT = 101.8 ± 6.9, Tg #2112.6 ± 8.3. Non-social sniff, WT = 49.3 ± 4.0, Tg #2, 57.4 ± 5.6). c, d Repetitive behaviors were assessed by scoring time spent grooming (c) and digging (d) over a 10-min period. No excessive grooming or digging was noted in CYFIP1 Tg mice (Grooming: Line 1: WT = 85.85 ± 11.48, Tg #1 = 84.35 ± 11.65. Line 2: WT = 44.85 ± 7.294, Tg #2 = 59.51 ± 8.97. Digging: Line 1: WT = 68.41 ± 7.997, Tg #1: 59.96 ± 7.846. Line 2: WT = 16.78 ± 2.991, Tg # 2 = 14.63 ± 2.003). e, f Mice were placed in a Y-maze and allowed to freely explore the arms for 8 min. e There was no significant difference in spontaneous alternations in either line (Line 1: WT = 60.05 ± 1.889, Tg #1, 57.36 ± 2.595. Line 2: WT = 50.12 ± 3.03, Tg #2, 58.22 ± 2.919). f There was no difference in the number of arms visited (Line 1: WT = 25.57 ± 1.362, Tg #1: 23.68 ± 1.224, Line 2: WT = 23.65 ± 1.435, Tg #2: 24.67 ± 1.315. NS, not significant. *p < 0.05. **p < 0.01. ***p < 0.001. ****p < 0.0001. See Table S3 for n’s and exact statistical tests
Fig. 3
Fig. 3
CYFIP1-overexpressing mice show no anxiety, hyperactivity, or intellectual disability. a Anxiety was assessed in the elevated plus maze by calculating time spent in the open arms of the maze compared to the closed arms. Tg mice the same amounts of time in the open and closed arms as their WT littermates (Line 1: WT closed arm = 186.103 ± 5.485. WT open arm = 49.5 ± 4.101. Tg #1 closed arm = 180.326 ± 4.937, Tg #1 open arm = 47.011 ± 4.224. Line 2: WT closed arm = 195.417 ± 6.695. WT open arm = 57.506 ± 7.440. Tg #2 closed arm = 192.243 ± 9.277. Tg #2 open arm = 55.541 ± 8.862. b Anxiety was also assessed using the open field test. There was no increase in time spent near the edges of the field (surround) in the Tg mice compared to their WT littermates, demonstrating no increased anxiety mice (Line 1: WT center = 488.575 ± 26.44, surround = 711.425 ± 26.44. Tg #1 center = 450.895 ± 35.195, surround = 749.105 ± 35.195. Line 2: WT center = 51.344 ± 50.432, surround = 688.656 ± 50.432. Tg #2 center: = 411.978 ± 40.114, surround = 788.022 ± 40.114). c Hyperactivity was assessed using the open field test by measuring the distance traveled over 20 min. There was no difference in the distance traveled over time between the Tg and WT mice, indicating no hyperactivity. d Learning and spatial memory was assessed using the Morris water maze. Mice were trained on the location of the platform for 5 days. After training on day 5, mice were subject to a probe test where the platform was removed and time spent in each quadrant was measured. Next, the platform was moved to the opposite quadrant, and mice were trained for 5 additional days with a probe test at the end of day 10. e The average latency to platform discovery was recorded for each training day. Tg #2 mice showed a significant delay in learning the location of the platform on day 2 and 4 (left). This was not observed in Tg #1 mice (right). Neither Tg line showed reversal learning deficits. f Tg #2 but not Tg #1 mice spent significantly less time searching in the platform quadrant than their WT littermates during the first probe trial (Line 1: WT platform quadrant = 31.33 ± 2.78, empty quadrant = 22.89 ± 0.93. Tg #1 platform quadrant = 35.95 ± 2.50, empty quadrant = 21.35 ± 0.83. Line 2: WT platform quadrant = 34.28 ± 2.02, empty quadrant = 21.91 ± 0.67. Tg #2 platform quadrant = 26.23 ± 2.49, empty quadrant = 24.59 ± 0.83). g Tg mice performed just as well as controls during the probe trial and spent more time in the platform quadrant than the other quadrants (Line 1: WT platform quadrant = 40.00 ± 2.40, WT empty quadrant = 20.29 ± 0.82, WT old platform quadrant = 12.70 ± 1.86. Tg #1 platform quadrant = 39.08 ± 3.25, Tg #1 empty quadrant = 20.47 ± 1.11, Tg #1 old platform quadrant = 14.32 ± 1.85. Line 2: WT platform quadrant = 36.97 ± 2.09, WT empty quadrant = 21.27 ± 0.71, WT old platform quadrant = 13.41 ± 1.40. Tg #2 platform quadrant = 38.63 ± 3.25, Tg #2 empty quadrant = 20.56 ± 1.10, Tg #2 old platform quadrant = 13.00 ± 1.84). NS. not significant. *p < 0.05. See Table S3 for n’s
Fig. 4
Fig. 4
CYFIP1-overexpressing mice show increased fear in contextual and cued fear conditioning but do not demonstrate sensory processing deficits. a Schematic of fear conditioning protocol. Learning and memory of aversive stimuli was assessed using trace and contextual fear conditioning. b On day 1, freezing was recorded as mice were conditioned to a tone using a series of 3, 80-dB tones followed by 0.5-mA shocks. While all mice acquired the tone/shock association, there was a significant increase in freezing in the Tg #2 mice compared to their WT littermates during this acquisition phase. This increase in freezing was not observed in Tg #1 mice. c Tg #2 mice demonstrated an increase in freezing in the shock context which persisted when they were introduced to a novel context. There was no increase in freezing observed in the Tg #1 mice in the shock or novel contexts (Shock context: Line 1 WT = 70.91 ± 3.242, Tg #1, 69.69 ± 4.291. Line 2 WT = 44.78 ± 2.596, Tg #2, 53.54 ± 3.098. Novel context: Line 1 WT = 40.76 ± 4.613, Tg #1 = 45.89 ± 4.431. Line 2 WT, 26.27 ± 2.497, Tg #2, 35.87 ± 2.976). d Tg #1 mice showed a significant increase in freezing in response to the tone, and Tg #2 mice showed a significant increase in freezing in the intertone interval (Tone: Line 1 WT = 64.28 ± 3.793, Tg #1 = 74.37 ± 2.962. Line 2 WT = 44.04 ± 3.759, Tg #2, 54.68 ± 4.09. Intertone interval: Line 1 WT = 50.12 ± 4.585, Tg #1 = 56.38 ± 4.076. Line 2 WT = 29.84 ± 3.128, Tg #2, 41.67 ± 3.121). e The thermal pain reflex of Tg mice was assessed using the hot plate assay. The latency to paw withdrawal was similar in Tg and WT littermates (Line 1 WT = 15.05 ± 1.35, Tg #1 = 13.88 ± 0.65. Line 2 WT = 11.29 ± 0.92, Tg # 2 = 12.65 ± 1.13). f Sensory gating was assessed using the PPI test. Tg mice showed no differences in PPI at 70, 75, and 80 dBs compared to WT (70 dB: Line 1 WT = 48.11 ± 3.18, Tg #1 = 42.93 ± 3.57. Line 2 WT = 45.21 ± 3.63, Tg #2 = 43.40 ± 4.09. 75 dB: Line 1 WT = 71.37 ± 2.22, Tg #1 = 70.10 ± 2.65. Line 2 WT = 62.69 ± 2.66, Tg #2 = 62.97 ± 2.74. 80 dB: Line 1 WT = 77.20 ± 1.68, Tg #1 = 79.14. Line 2 WT = 74.19 ± 2.37, Tg #2 = 70.28 ± 1.83). CYFIP1 (g) mRNA and h protein levels in the basolateral amygdala were significantly increased in both Tg lines. NS, not significant. *p < 0.05. **p < 0.01. ***p < 0.001. ****p < 0.0001. See Additional file 3: Table S3 n’s
Fig. 5
Fig. 5
RNA sequencing of the BLA identifies molecular pathways underlying fear conditioning response, neuronal structure, and function. a Analysis of RNA sequencing from the BLA identified 177 differentially expressed genes (82 downregulated and 95 upregulated) when comparing CYFIP1 OE mice to their WT litter mates. b A list of the top 5 significant GO-terms derived from analysis of DE genes and their Z-scores. c Dendrogram produced from WGCNA analysis of the BLA transcriptome resulting in 13 modules. d R-squared values and directionality for the 8 modules significantly associated with genotype (fdr < 0.1), blue (R2 = 0.97), red (R2 = 0.72), salmon (R2 = 0.58), brown (R2 = 0.50), green-yellow (R2 = 0.43), tan (R2 = − 0.33), purple (R2 = − 0.54), and turquoise (R2 = − 0.96). e Cell type enrichment analysis for the significantly expressed modules. The numbers represent the odds ratio. f Enrichment of genes in each module associated with Dup15q, ASD, schizophrenia (SCZ), bipolar disorder (BD), and major depressive disorder (MDD). The numbers represent odds ratio. g A list of the top 3 significant GO-terms for each module and their Z-scores. *FDR < 0.05, **FDR < 0.01, ***FDR < 0.005

Similar articles

Cited by

References

    1. Vorstman JA, et al. Identification of novel autism candidate regions through analysis of reported cytogenetic abnormalities associated with autism. Mol Psychiatry. 2006;11(1):1, 18–1, 28. - PubMed
    1. Finucane BM, et al. In: 15q duplication syndrome and related disorders. Adam MP, et al., editors. Seattle: GeneReviews®; 2016.
    1. Pujana MA, et al. Human chromosome 15q11-q14 regions of rearrangements contain clusters of LCR15 duplicons. Eur J Hum Genet. 2002;10(1):26–35. doi: 10.1038/sj.ejhg.5200760. - DOI - PubMed
    1. Locke DP, et al. BAC microarray analysis of 15q11-q13 rearrangements and the impact of segmental duplications. J Med Genet. 2004;41(3):175–182. doi: 10.1136/jmg.2003.013813. - DOI - PMC - PubMed
    1. Battaglia A, Parrini B, Tancredi R. The behavioral phenotype of the idic (15) syndrome. Am J Med Genet C Semin Med Genet. 2010;154C(4):448–455. doi: 10.1002/ajmg.c.30281. - DOI - PubMed

Publication types

MeSH terms

Substances