

Plastome phylogenomics and characterization of rare genomic changes as taxonomic markers in plastome groups 1 and 2 Poeae (Pooideae; Poaceae)
- PMID: 31198631
- PMCID: PMC6553444
- DOI: 10.7717/peerj.6959
Plastome phylogenomics and characterization of rare genomic changes as taxonomic markers in plastome groups 1 and 2 Poeae (Pooideae; Poaceae)
Abstract
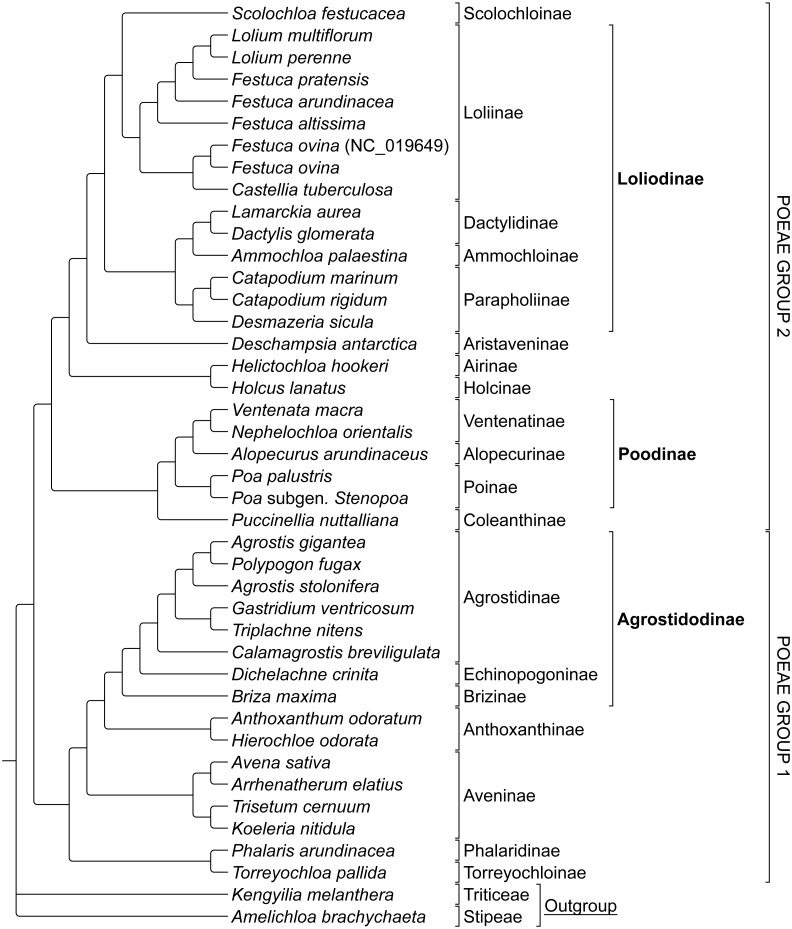
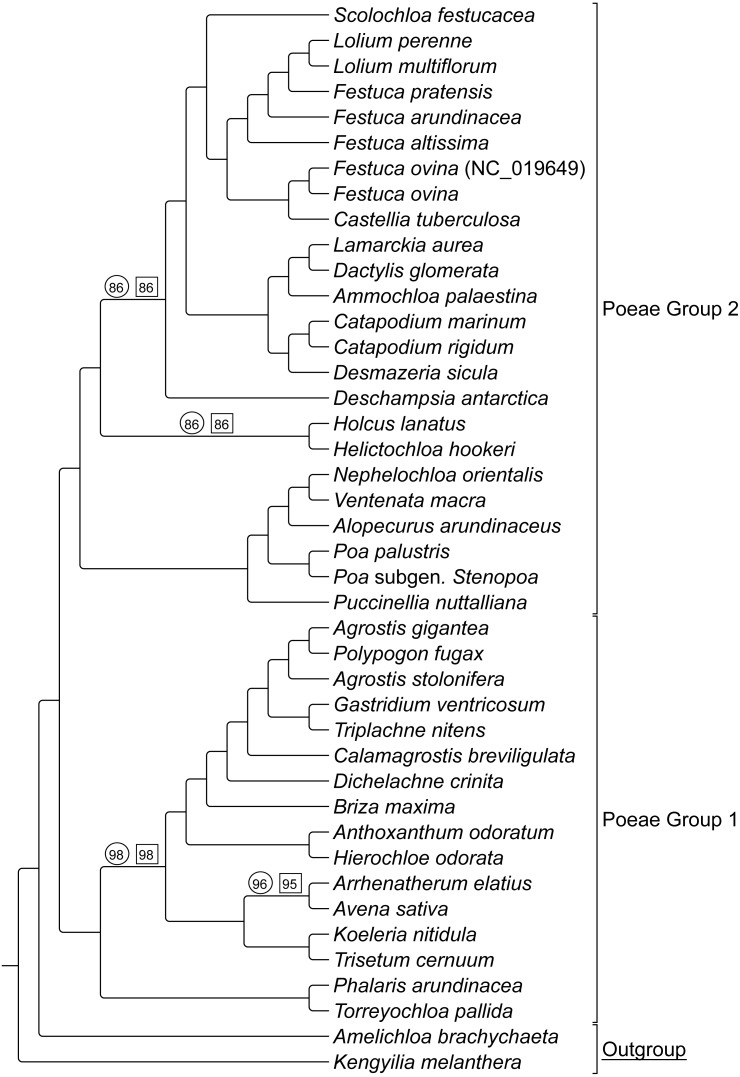
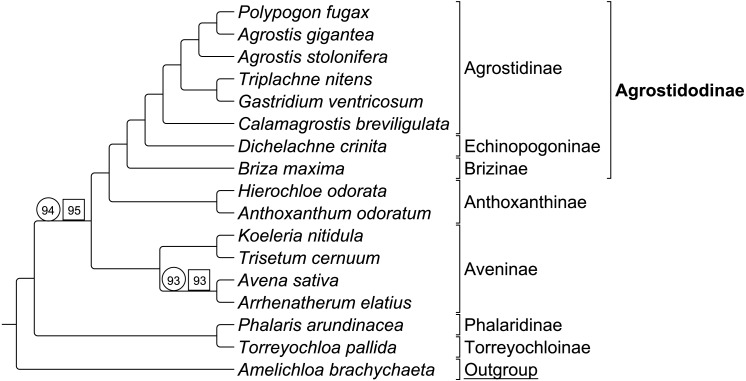
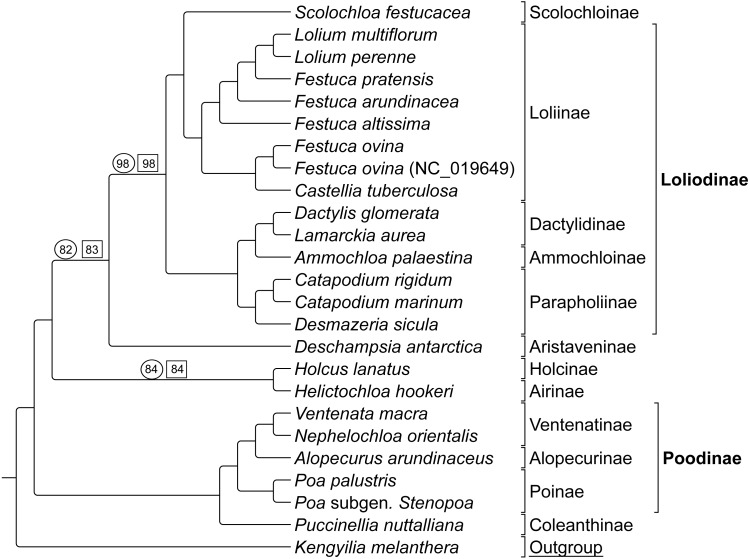
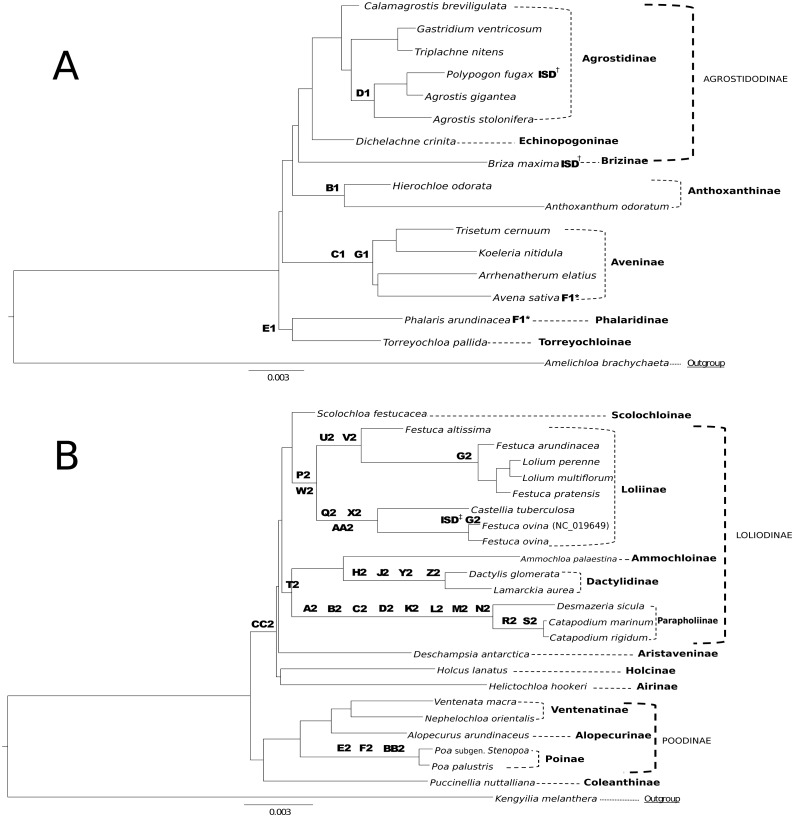
A phylogenomic analysis of 42 complete plastid genomes (plastomes), including 16 that were newly sequenced, was conducted. Plastomes were sampled from 19 subtribes of Pooideae, to investigate relationships within and between Chloroplast Group 1 (Aveneae) and Group 2 (Poeae) species. Two data partitions: complete plastomes, and a combined plastome and rare genomic change (RGC) data matrix, were analyzed. Overall, 156 non-ambiguous RGC were identified, of which homology was inferred for 38 RGC. Among the 38 RGC identified, six were synapomorphic among the Group 1 subtribes: Aveninae, Agrostidinae, and Anthoxanthinae, (Phalaridinae + Torreyochloinae), and 27 were synapomorphic among the Group 2 subtribes: Loliinae, (Ammochloinae + Parapholiinae + Dactylidinae), Parapholiinae, Dactylidinae, Poinae, and Coleanthinae. Four RGC were determined to be homoplasious in Groups 1 and 2. Two other RGC originated through intrastrand deletion events. The remaining RGC events likely originated through recombination given their size and lack of sequence evidence for other types of mutations. This study also determined that relationships between taxa, even those only weakly supported in previous studies, could be inferred with strong support when utilizing complete plastomes.
Keywords: Chloroplast; Intrastrand deletion; Phylogenomics; Poeae; Rare genomic changes; Taxonomic markers.
Conflict of interest statement
The authors declare there are no competing interests.
Figures
Similar articles
-
Molecular phylogenetics of cool-season grasses in the subtribes Agrostidinae, Anthoxanthinae, Aveninae, Brizinae, Calothecinae, Koeleriinae and Phalaridinae (Poaceae, Pooideae, Poeae, Poeae chloroplast group 1).PhytoKeys. 2017 Oct 9;(87):1-139. doi: 10.3897/phytokeys.87.12774. eCollection 2017. PhytoKeys. 2017. PMID: 29114171 Free PMC article.
-
Plastid phylogenomics of the cool-season grass subfamily: clarification of relationships among early-diverging tribes.AoB Plants. 2015 May 4;7:plv046. doi: 10.1093/aobpla/plv046. AoB Plants. 2015. PMID: 25940204 Free PMC article.
-
Phylogeny of the tribe Aveneae (Pooideae, Poaceae) inferred from plastid trnT-F and nuclear ITS sequences.Am J Bot. 2007 Sep;94(9):1554-69. doi: 10.3732/ajb.94.9.1554. Am J Bot. 2007. PMID: 21636521
-
Phylogeny of the festucoid grasses of subtribe Loliinae and allies (Poeae, Pooideae) inferred from ITS and trnL-F sequences.Mol Phylogenet Evol. 2004 May;31(2):517-41. doi: 10.1016/j.ympev.2003.08.025. Mol Phylogenet Evol. 2004. PMID: 15062792
-
A 313 plastome phylogenomic analysis of Pooideae: Exploring relationships among the largest subfamily of grasses.Mol Phylogenet Evol. 2021 Jun;159:107110. doi: 10.1016/j.ympev.2021.107110. Epub 2021 Feb 17. Mol Phylogenet Evol. 2021. PMID: 33609709
Cited by
-
Characterization of the complete chloroplast genome of Alopecurus pratensis L. (Poaceae).Mitochondrial DNA B Resour. 2021 Jul 14;6(8):2379-2380. doi: 10.1080/23802359.2021.1935346. eCollection 2021. Mitochondrial DNA B Resour. 2021. PMID: 34345701 Free PMC article.
-
Complete pan-plastome sequences enable high resolution phylogenetic classification of sugar beet and closely related crop wild relatives.BMC Genomics. 2022 Feb 10;23(1):113. doi: 10.1186/s12864-022-08336-8. BMC Genomics. 2022. PMID: 35139817 Free PMC article.
-
Comparative Plastomes and Phylogenetic Analysis of Cleistogenes and Closely Related Genera (Poaceae).Front Plant Sci. 2021 Mar 25;12:638597. doi: 10.3389/fpls.2021.638597. eCollection 2021. Front Plant Sci. 2021. PMID: 33841465 Free PMC article.
-
Long-reads reveal that Rhododendron delavayi plastid genome contains extensive repeat sequences, and recombination exists among plastid genomes of photosynthetic Ericaceae.PeerJ. 2020 Apr 22;8:e9048. doi: 10.7717/peerj.9048. eCollection 2020. PeerJ. 2020. PMID: 32351791 Free PMC article.
-
Unprecedented Intraindividual Structural Heteroplasmy in Eleocharis (Cyperaceae, Poales) Plastomes.Genome Biol Evol. 2020 May 1;12(5):641-655. doi: 10.1093/gbe/evaa076. Genome Biol Evol. 2020. PMID: 32282915 Free PMC article.
References
-
- Akaike H. A new look at the statistical model identification. IEEE Transactions on Automatic Control. 1974;19(6):716–723. doi: 10.1109/TAC.1974.1100705. - DOI
-
- Bankevich A, Nurk S, Antipov D, Gurevich AA, Dvorkin M, Kulikov AS, Lesin VM, Nikolenko SI, Pham S, Prjibelski AD, Pyshkin AV. SPAdes: a new genome assembly algorithm and its applications to single-cell sequencing. Journal of Computational Biology. 2012;19.5:455–477. doi: 10.1089/cmb.2012.0021. - DOI - PMC - PubMed
-
- Bouchenak-Khelladi Y, Verboom G, Hodkinson TR, Salamin N, Francois O, Ni Chonghaile G, Savolainen V. The origins and diversification of C4 grasses and savanna-adapted ungulates. Global Change Biology. 2009;15(10):2397–2417. doi: 10.1111/j.1365-2486.2009.01860.x. - DOI
LinkOut - more resources
Full Text Sources
