

Transcriptomic study of the mechanism of anoikis resistance in head and neck squamous carcinoma
- PMID: 31198634
- PMCID: PMC6535219
- DOI: 10.7717/peerj.6978
Transcriptomic study of the mechanism of anoikis resistance in head and neck squamous carcinoma
Abstract
Background: Normal epithelial cells rapidly undergo apoptosis as soon as they lose contact with the extracellular matrix (ECM), which is termed as anoikis. However, cancer cells tend to develop a resistance mechanism to anoikis. This acquired ability is termed as anoikis resistance. Cancer cells, with anoikis resistance, can spread to distant tissues or organs via the peripheral circulatory system and cause cancer metastasis. Thus, inhibition of anoikis resistance blocks the metastatic ability of cancer cells.
Methods: Anoikis-resistant CAL27 (CAL27AR) cells were induced from CAL27 cells using the suspension culture approach. Transcriptome analysis was performed using RNA-Seq to study the differentially expressed genes (DEGs) between the CAL27ARcells and the parental CAL27 cells. Gene function annotation and Gene Ontology (GO) enrichment analysis were performed using DAVID database. Signaling pathways involved in DEGs were analyzed using Gene Set Enrichment Analysis (GSEA) software. Analysis results were confirmed by reverse transcription PCR (RT-PCR), western blotting, and gene correlation analysis based on the TCGA database.
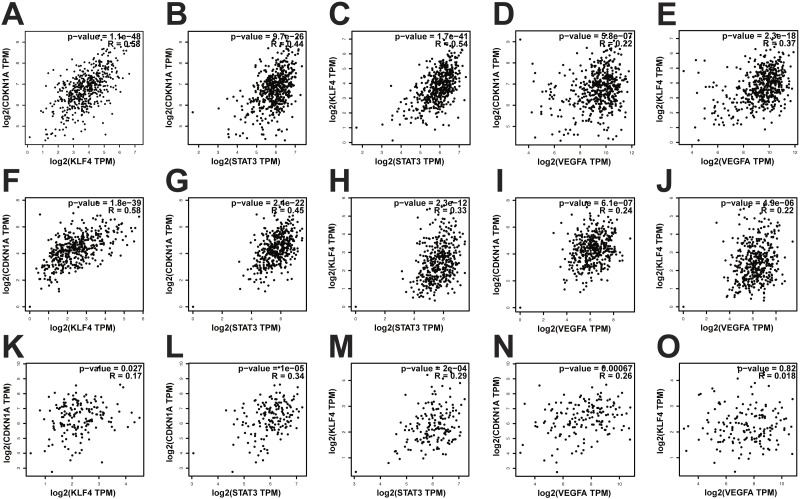
Results: GO enrichment analysis indicated that the biological process (BP) of the DEGs was associated with epidermal development, DNA replication, and G1/S transition of the mitotic cell cycle. The analysis of cellular component (CC) showed that the most significant up-regulated genes were related to extracellular exosome. KEGG Pathway analysis revealed that 23 signaling pathways were activated (p-value ≤ 0.05, FDR q-value ≤ 0.05) and 22 signaling pathways were suppressed (p-value ≤ 0.05, FDR q-value ≤ 0.05). The results from the GSEA indicated that in contrast to the inhibition of EGFR signaling pathway, the VEGF signaling pathway was activated. The VEGF signaling pathway possibly activates STAT3 though induction of STAT3 phosphorylation. Gene correlation analysis revealed that the VEGFA- STAT3-KLF4-CDKN1A signal axis was not only present in head and neck squamous carcinoma (HNSCC) but also two other epithelial-derived carcinomas that highly express VEGFA, including kidney renal clear cell carcinoma (KIRC) and ovarian serous cystadenocarcinoma (OV).
Keywords: Anoikis resistance; Head and neck squamous cell carcinoma; RNA-Seq; Transcriptomics.
Conflict of interest statement
The authors declare there are no competing interests.
Figures


Similar articles
-
Anoikis resistance of small airway epithelium is involved in the progression of chronic obstructive pulmonary disease.Front Immunol. 2023 Apr 5;14:1155478. doi: 10.3389/fimmu.2023.1155478. eCollection 2023. Front Immunol. 2023. PMID: 37090717 Free PMC article.
-
Hepatocyte growth factor inhibits anoikis by induction of activator protein 1-dependent cyclooxygenase-2. Implication in head and neck squamous cell carcinoma progression.J Biol Chem. 2002 Dec 20;277(51):50137-42. doi: 10.1074/jbc.M208952200. Epub 2002 Oct 18. J Biol Chem. 2002. PMID: 12393863
-
Identification of Potential Biomarkers and Survival Analysis for Head and Neck Squamous Cell Carcinoma Using Bioinformatics Strategy: A Study Based on TCGA and GEO Datasets.Biomed Res Int. 2019 Aug 7;2019:7376034. doi: 10.1155/2019/7376034. eCollection 2019. Biomed Res Int. 2019. PMID: 31485443 Free PMC article.
-
Anoikis molecular pathways and its role in cancer progression.Biochim Biophys Acta. 2013 Dec;1833(12):3481-3498. doi: 10.1016/j.bbamcr.2013.06.026. Epub 2013 Jul 2. Biochim Biophys Acta. 2013. PMID: 23830918 Review.
-
Cell surface adhesion molecules and adhesion-initiated signaling: understanding of anoikis resistance mechanisms and therapeutic opportunities.Cell Signal. 2012 Feb;24(2):393-401. doi: 10.1016/j.cellsig.2011.10.005. Epub 2011 Oct 17. Cell Signal. 2012. PMID: 22024283 Review.
Cited by
-
RNA Sequencing and Cell Models of Virus-Associated Cancer (Review).Sovrem Tekhnologii Med. 2022;14(1):64-80. doi: 10.17691/stm2022.14.1.07. Epub 2022 Jan 28. Sovrem Tekhnologii Med. 2022. PMID: 35992999 Free PMC article. Review.
-
mir-145-5p is a suppressor of colorectal cancer at early stage, while promotes colorectal cancer metastasis at late stage through regulating AKT signaling evoked EMT-mediated anoikis.BMC Cancer. 2022 Nov 8;22(1):1151. doi: 10.1186/s12885-022-10182-6. BMC Cancer. 2022. PMID: 36348305 Free PMC article.
-
Construction and validation of an anoikis-related long non-coding RNA-based prognostic model for head and neck squamous cell carcinoma.Transl Cancer Res. 2025 Jul 30;14(7):4160-4178. doi: 10.21037/tcr-2024-2520. Epub 2025 Jul 25. Transl Cancer Res. 2025. PMID: 40792140 Free PMC article.
-
Identification of a new anoikis-related gene signature for prognostic significance in head and neck squamous carcinomas.Medicine (Baltimore). 2023 Sep 8;102(36):e34790. doi: 10.1097/MD.0000000000034790. Medicine (Baltimore). 2023. PMID: 37682196 Free PMC article.
-
Analyses of Transcriptomics Cell Signalling for Pre-Screening Applications in the Integrated Approach for Testing and Assessment of Non-Genotoxic Carcinogens.Int J Mol Sci. 2022 Oct 22;23(21):12718. doi: 10.3390/ijms232112718. Int J Mol Sci. 2022. PMID: 36361516 Free PMC article. Review.
References
-
- Akhavan D, Pourzia AL, Nourian AA, Williams KJ, Nathanson D, Babic I, Villa GR, Tanaka K, Nael A, Yang H. De-repression of PDGFR β transcription promotes acquired resistance to EGFR tyrosine kinase inhibitors in glioblastoma patients. Cancer Discovery. 2013;3:534–547. doi: 10.1158/2159-8290.CD-12-0502. - DOI - PMC - PubMed
Associated data
LinkOut - more resources
Full Text Sources
Molecular Biology Databases
Research Materials
Miscellaneous
