. 2019 Jun 6:5:197-207.
doi: 10.1016/j.trci.2019.04.003. eCollection 2019.

Analysis of dementia in the US population using Medicare claims: Insights from linked survey and administrative claims data

Affiliations

Analysis of dementia in the US population using Medicare claims: Insights from linked survey and administrative claims data

Yi Chen et al. Alzheimers Dement (N Y). .

Abstract

Introduction: Medicare claims data may be a rich data source for tracking population dementia rates. Insufficient understanding of completeness of diagnosis, and for whom, limits their use.

Methods: We analyzed agreement in prevalent and incident dementia based on cognitive assessment from the Health and Retirement Study for persons with linked Medicare claims from 2000 to 2008 (N = 10,450 persons). Multinomial logistic regression identified sociodemographic factors associated with disagreement.

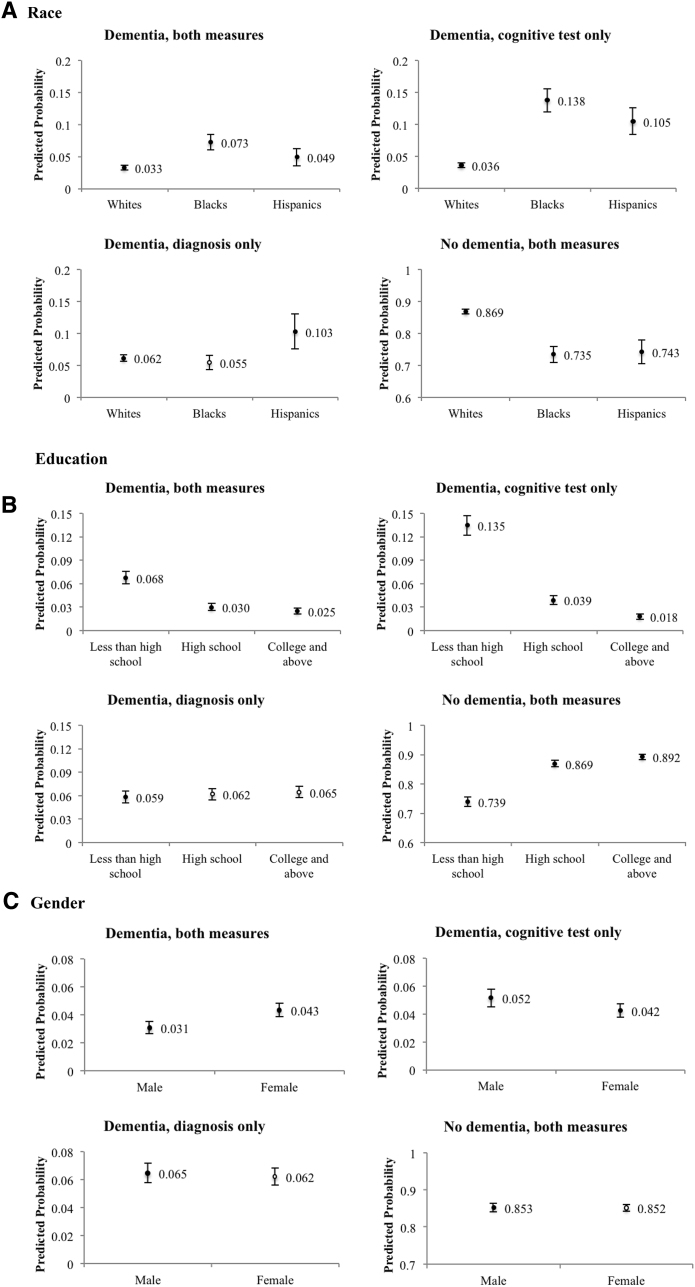
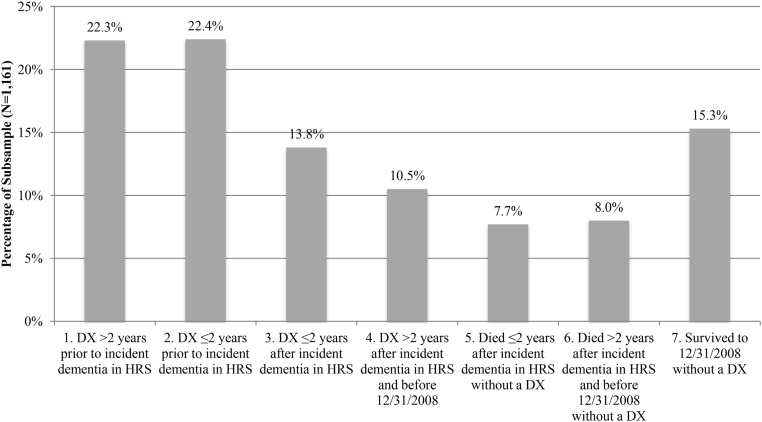
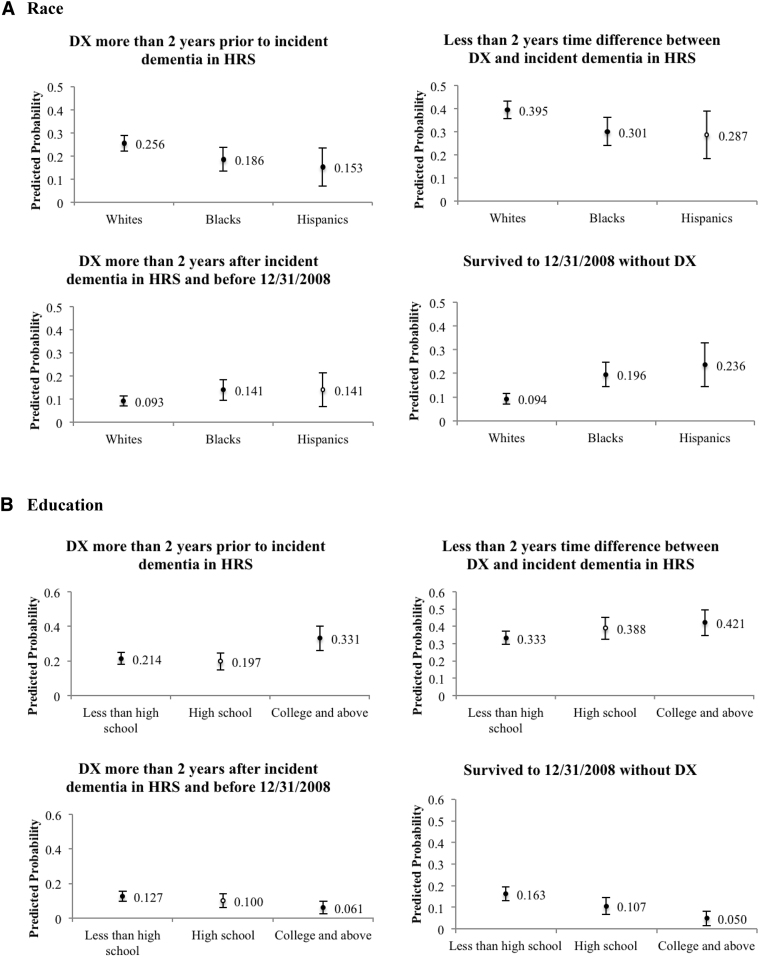
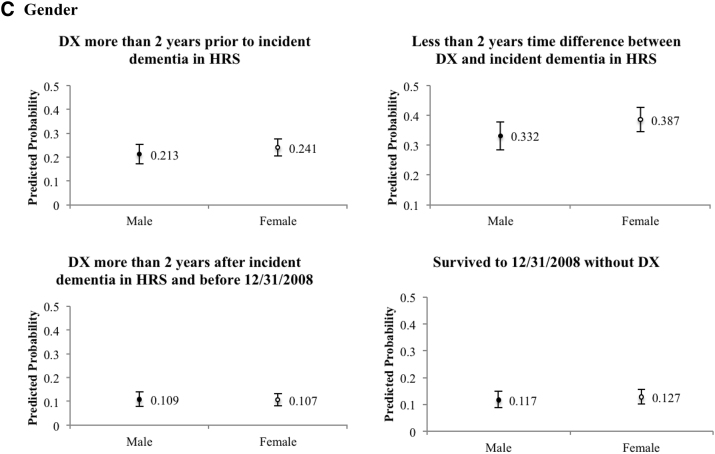
Results: Survey-based cognitive tests and claims-based dementia diagnosis yielded equal prevalence estimates, yet only half were identified by both measures. Race and education were associated with disagreement. Eighty-five percent of respondents with incident dementia measured by cognitive decline received a diagnosis or died within the study period, with lower odds among blacks and Hispanics than among whites.

Discussions: Claims data are valuable for tracking dementia in the US population and improve over time. Delayed diagnosis may underestimate rates within black and Hispanic populations.

Keywords: Cognition; Diagnosis; Disparities; Incidence; Prevalence; Race/ethnicity.


Figures

Fig. 1
Fig. 1
Predicted probability of concordance in prevalent dementia by race (A), education (B), and gender (C) (N = 31,186). Predicted probabilities of each concordance category are based on estimates from multinomial logistic regression, adjusting for sex, age group, race, education, marital status, survival in two years, doctor visit during the past two years, and a linear time trend; error bars show 95% confidence intervals of predictions. Black dots indicate statistical difference between a probability and that for whites, less than high school education, or male, at a significance level of 0.05. The number of observations in regression reduced from 31,186 to 31,117 due to missing values in covariates.
Fig. 2
Fig. 2
Timing of diagnosis in claims data relative to incident dementia based on cognitive scores in Health and Retirement Study data (N = 1161). DX = diagnosis coded in Medicare claims. This subsample is limited to respondents who were ascertained as dementia by HRS cognitive tests for the first time during HRS 2000, 2002, or 2004 waves. From the left to the right, outcomes are: (1) diagnosed more than 2 years before incident dementia in HRS, (2) diagnosed 2 years or less before incident dementia in HRS, (3) diagnosed 2 years or sooner after incident dementia in HRS, (4) diagnosed more than 2 years after incident dementia in HRS and before December 31, 2008, (5) died 2 years or sooner after incident dementia in HRS without a diagnosis in claims, (6) died more than 2 years after incident dementia in HRS and before December 31, 2008, without a diagnosis in claims, and (7) survived to December 31, 2008, without a diagnosis in claims. The reported percentages are weighted using wave-specific HRS sampling weights to adjust for survey design.
Fig. 3
Fig. 3
Predicted probability of relative timing of incident dementia, by race (A), education (B), and gender (C) (N = 1161). DX = diagnosis coded in Medicare claims. Five outcome groups in the multinomial logistic regression include (1) diagnosed more than 2 years before incident dementia in HRS, (2) less than 2 years time difference between incident dementia in claims data and in HRS, (3) diagnosed more than 2 years after incident dementia in HRS and before December 31, 2008, (4) died before December 31, 2008, without a diagnosis in claims, and (5) survived to December 31, 2008, without a diagnosis in claims. This figure omits estimates for group (4). Predicted probabilities of each concordance category are based on estimates from multinomial logistic regression, adjusting for sex, age group, race, education, marital status, doctor visit during the past two years, and linear time trend; error bars show 95% confidence intervals of predictions. Black dots indicate statistical difference between a probability and that for whites, less than high school education, or male, at a significance level of 0.05. The number of observations in regression reduced from 1161 to 1152 due to missing values in covariates.
Fig. 3
Fig. 3
Predicted probability of relative timing of incident dementia, by race (A), education (B), and gender (C) (N = 1161). DX = diagnosis coded in Medicare claims. Five outcome groups in the multinomial logistic regression include (1) diagnosed more than 2 years before incident dementia in HRS, (2) less than 2 years time difference between incident dementia in claims data and in HRS, (3) diagnosed more than 2 years after incident dementia in HRS and before December 31, 2008, (4) died before December 31, 2008, without a diagnosis in claims, and (5) survived to December 31, 2008, without a diagnosis in claims. This figure omits estimates for group (4). Predicted probabilities of each concordance category are based on estimates from multinomial logistic regression, adjusting for sex, age group, race, education, marital status, doctor visit during the past two years, and linear time trend; error bars show 95% confidence intervals of predictions. Black dots indicate statistical difference between a probability and that for whites, less than high school education, or male, at a significance level of 0.05. The number of observations in regression reduced from 1161 to 1152 due to missing values in covariates.

References

    1. Valcour V.G., Masaki K.H., Curb J.D., Blanchette P.L. The detection of dementia in the primary care setting. Arch Intern Med. 2000;160:2964–2968. - PubMed
    1. Chodosh J., Petitti D.B., Elliott M., Hays R.D., Crooks V.C., Reuben D.B. Physician recognition of cognitive impairment: evaluating the need for improvement. J Am Geriatr Soc. 2004;52:1051–1059. - PubMed
    1. Bradford A., Kunik M.E., Schulz P., Williams S.P., Singh H. Missed and delayed diagnosis of dementia in primary care: prevalence and contributing factors. Alzheimer Dis Assoc Disord. 2009;23:306–314. - PMC - PubMed
    1. Langa K.M., Larson E.B., Crimmins E.M., Faul J.D., Levine D.A., Kabeto M.U. A Comparison of the prevalence of dementia in the United States in 2000 and 2012. JAMA Intern Med. 2017;177:51–58. - PMC - PubMed
    1. Zissimopoulos J., Crimmins E., St Clair P. The value of delaying Alzheimer's disease onset. Forum Health Econ Policy. 2014;18:25–39. - PMC - PubMed