Construction of prognostic risk prediction model of oral squamous cell carcinoma based on co-methylated genes
- PMID: 31198983
- PMCID: PMC6657967
- DOI: 10.3892/ijmm.2019.4243
Construction of prognostic risk prediction model of oral squamous cell carcinoma based on co-methylated genes
Abstract
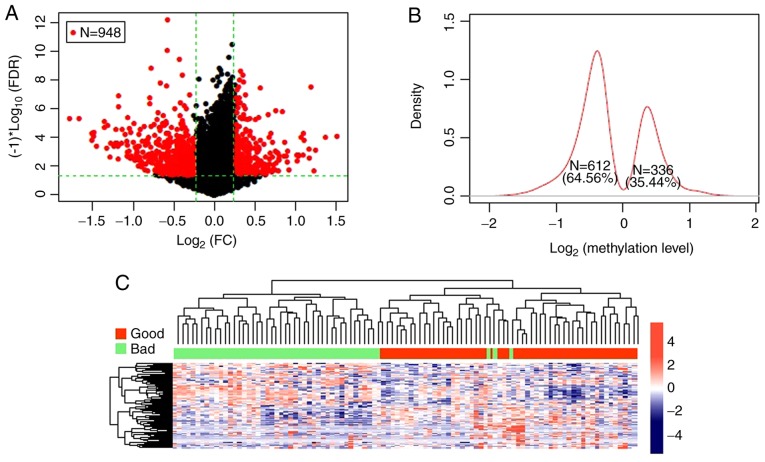
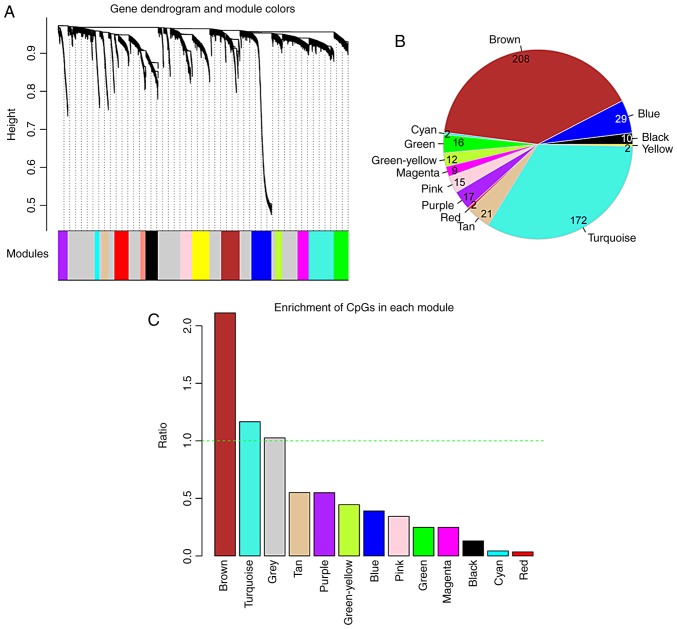
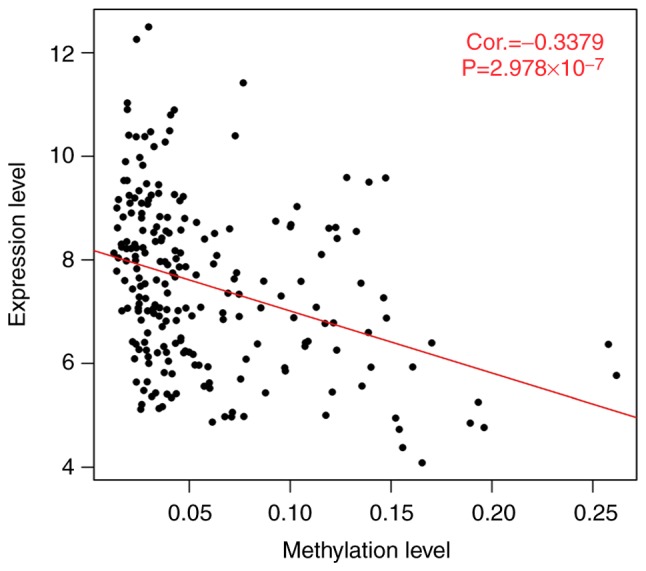
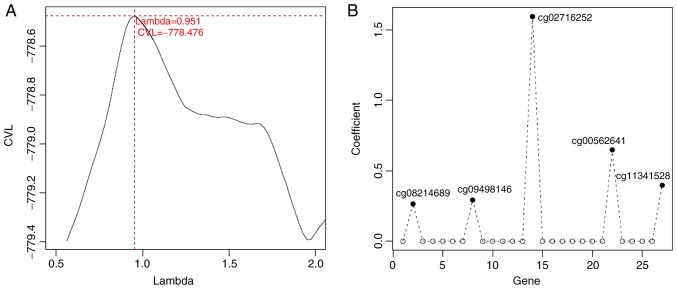
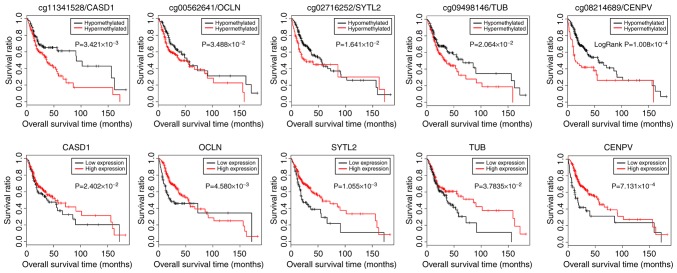
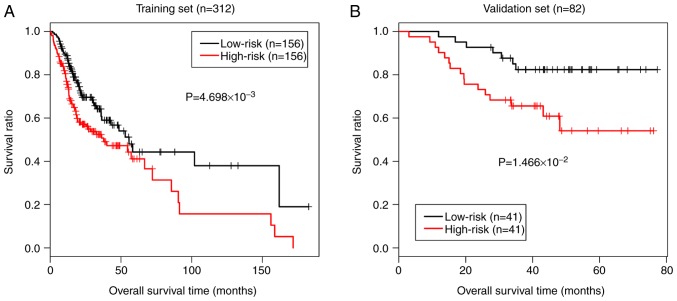
This study aimed to identify DNA methylation markers in oral squamous cell carcinoma (OSCC) and to construct a prognostic prediction model of OSCC. For this purpose, the methylation data of patients with OSCC downloaded from The Cancer Genome Atlas were considered as a training dataset. The methylation profiles of GSE37745 for OSCC samples were downloaded from Gene Expression Omnibus and considered as validation dataset. Differentially methylated genes (DMGs) were screened from the TCGA training dataset, followed by co‑methylation analysis using weighted correlation network analysis (WGCNA). Subsequently, the methylation and gene expression levels of DMGs involved in key modules were extracted for correlation analysis. Prognosis‑related methylated genes were screened using the univariate Cox regression analysis. Finally, the risk prediction model was constructed and validated through GSE52793. The results revealed that a total of 948 DMGs with CpGs were screened out. Co‑methylation gene analysis obtained 2 (brown and turquoise) modules involving 380 DMGs. Correlation analysis revealed that the methylation levels of 132 genes negatively correlated with the gene expression levels. By combining with the clinical survival prognosis of samples, 5 optimized prognostic genes [centromere protein V (CENPV), Tubby bipartite transcription factor (TUB), synaptotagmin like 2 (SYTL2), occludin (OCLN) and CAS1 domain containing 1 (CASD1)] were selected for constructing a risk prediction model. It was consistent in the training dataset and GSE52793 that low‑risk samples had a better survival prognosis. On the whole, this study indicates that the constructed risk prediction model based on CENPV, SYTL2, OCLN, CASD1, and TUB may have the potential to be used for predicting the survival prognosis of patients with OSCC.
Figures
Similar articles
-
Identification of hub methylated-CpG sites and associated genes in oral squamous cell carcinoma.Cancer Med. 2020 May;9(9):3174-3187. doi: 10.1002/cam4.2969. Epub 2020 Mar 10. Cancer Med. 2020. PMID: 32155325 Free PMC article.
-
An integrated methylation and gene expression microarray analysis reveals significant prognostic biomarkers in oral squamous cell carcinoma.Oncol Rep. 2018 Nov;40(5):2637-2647. doi: 10.3892/or.2018.6702. Epub 2018 Sep 12. Oncol Rep. 2018. PMID: 30226546 Free PMC article.
-
A two-CpG-based prognostic signature for oral squamous cell carcinoma overall survival.J Cell Biochem. 2019 Jun;120(6):9082-9090. doi: 10.1002/jcb.28182. Epub 2018 Dec 12. J Cell Biochem. 2019. PMID: 30548666
-
Epigenetic disregulation in oral cancer.Int J Mol Sci. 2012;13(2):2331-2353. doi: 10.3390/ijms13022331. Epub 2012 Feb 21. Int J Mol Sci. 2012. PMID: 22408457 Free PMC article. Review.
-
Histone modifications in oral squamous cell carcinoma and oral potentially malignant disorders.Oral Dis. 2020 May;26(4):719-732. doi: 10.1111/odi.13115. Epub 2019 Jul 26. Oral Dis. 2020. PMID: 31056829 Review.
Cited by
-
On the Cutting Edge of Oral Cancer Prevention: Finding Risk-Predictive Markers in Precancerous Lesions by Longitudinal Studies.Cells. 2022 Mar 18;11(6):1033. doi: 10.3390/cells11061033. Cells. 2022. PMID: 35326482 Free PMC article. Review.
-
Prognostic and therapeutic prediction by screening signature combinations from transcriptome-methylome interactions in oral squamous cell carcinoma.Sci Rep. 2022 Jul 6;12(1):11400. doi: 10.1038/s41598-022-15534-7. Sci Rep. 2022. PMID: 35794182 Free PMC article.
-
Identification of hub methylated-CpG sites and associated genes in oral squamous cell carcinoma.Cancer Med. 2020 May;9(9):3174-3187. doi: 10.1002/cam4.2969. Epub 2020 Mar 10. Cancer Med. 2020. PMID: 32155325 Free PMC article.
-
Pre-Operative Evaluation of DNA Methylation Profile in Oral Squamous Cell Carcinoma Can Predict Tumor Aggressive Potential.Int J Mol Sci. 2020 Sep 14;21(18):6691. doi: 10.3390/ijms21186691. Int J Mol Sci. 2020. PMID: 32937734 Free PMC article.
References
-
- Werning JW. Thieme. 2007. Oral cancer: Diagnosis, management, and rehabilitation.
-
- World Health Organization (WHO) In: International classification of diseases for oncology (ICD-O)-3rd edition, 1st revision. Fritz A, Percy C, Jack A, Shanmugaratnam K, Sobin L, Parkin DM, Whelan S, editors. WHO; Geneva: 2013.
-
- Wu Y, Zhang L, Zhang L, Wang Y, Li H, Ren X, Wei F, Yu W, Liu T, Wang X, et al. Long non-coding RNA HOTAIR promotes tumor cell invasion and metastasis by recruiting EZH2 and repressing E-cadherin in oral squamous cell carcinoma. Int J Oncol. 2015;46:2586–2594. doi: 10.3892/ijo.2015.2976. - DOI - PubMed
MeSH terms
Substances
LinkOut - more resources
Full Text Sources
Medical
Miscellaneous