. 2019 Sep;13(9):1898-1912.
doi: 10.1002/1878-0261.12532. Epub 2019 Jun 27.

Aberrantly expressed PLOD1 promotes cancer aggressiveness in bladder cancer: a potential prognostic marker and therapeutic target

Affiliations

Aberrantly expressed PLOD1 promotes cancer aggressiveness in bladder cancer: a potential prognostic marker and therapeutic target

Yasutaka Yamada et al. Mol Oncol. 2019 Sep.

Abstract

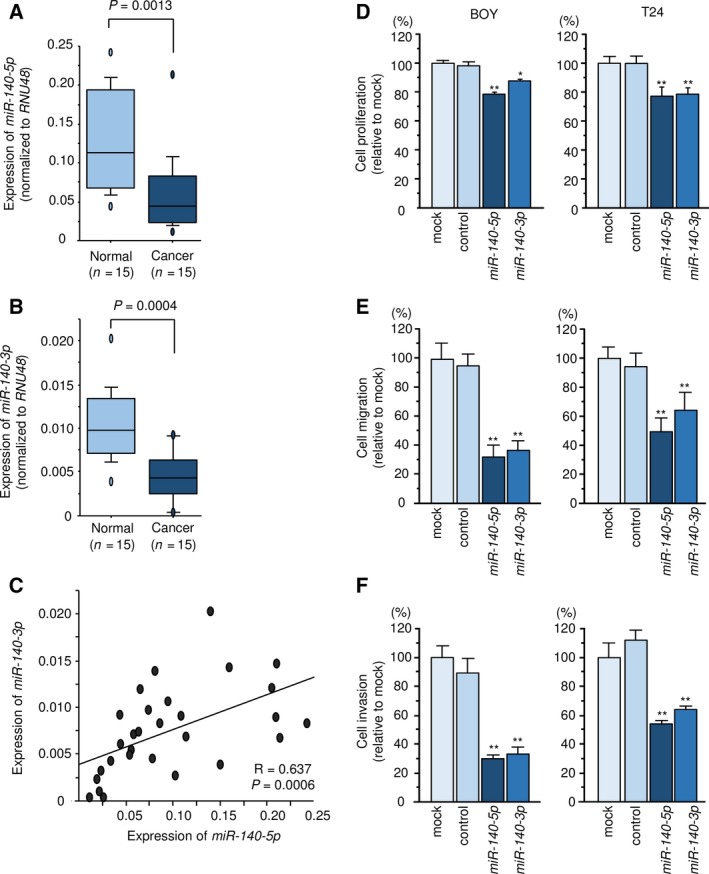
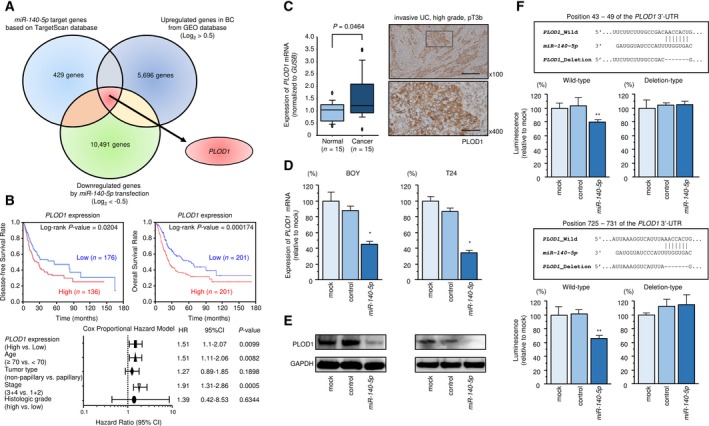
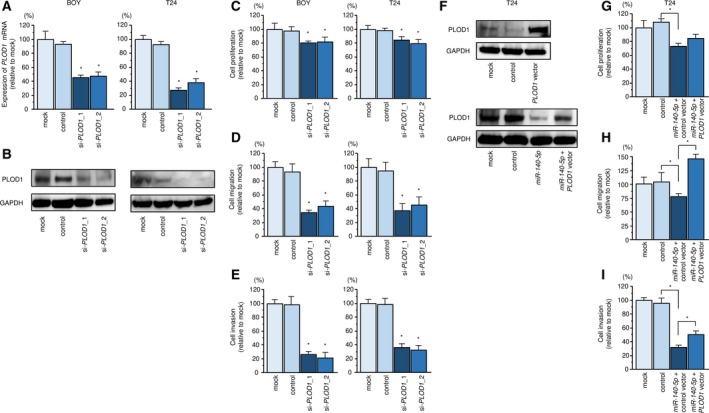
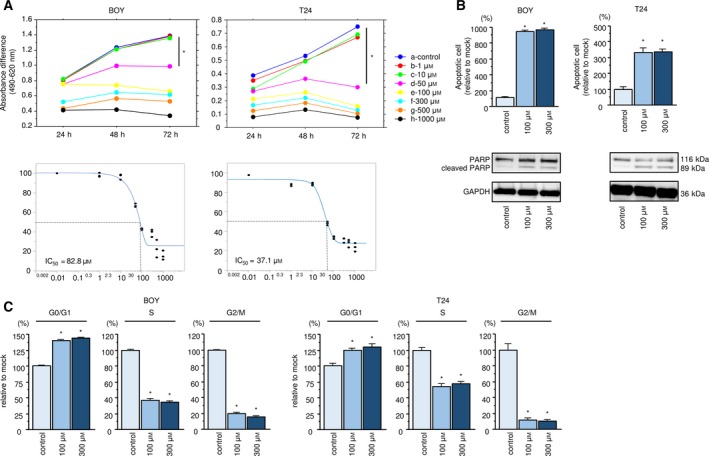
Bladder cancer (BC) is the ninth most malignant tumor worldwide. Some BC patients will develop muscle-invasive BC (MIBC), which has a 5-year survival rate of approximately 60% due to metastasis. As such, there is an urgent need for novel therapeutic and diagnostic targets for MIBC. Analysis of novel antitumor microRNA (miRNA)-mediated cancer networks is an effective strategy for exploring therapeutic targets and prognostic markers in cancers. Our previous miRNA analysis revealed that miR-140-5p acts as an antitumor miRNA in BC cells. Here, we investigated miR-140-5p regulation of BC molecular pathogenesis. Procollagen-lysine, 2-oxoglutarate 5-dioxygenase 1 (PLOD1) was found to be directly regulated by miR-140-5p, and aberrant expression of PLOD1 was observed in BC clinical specimens. High PLOD1 expression was significantly associated with a poor prognosis (disease-free survival: P = 0.0204; overall survival: P = 0.000174). Multivariate analysis showed PLOD1 expression to be an independent prognostic factor in BC patients (hazard ratio = 1.51, P = 0.0099). Furthermore, downregulation of PLOD1 by siRNAs and a specific inhibitor significantly decreased BC cell aggressiveness. Aberrant expression of PLOD1 was closely associated with BC pathogenesis. In summary, the present study showed that PLOD1 may be a potential prognostic marker and therapeutic target for BC.

Keywords: miR-140-5p; PLOD1; bladder cancer; inhibitor; microRNA; passenger strand.


Conflict of interest statement

The authors declare no conflict of interest.

Figures

Figure 1
Figure 1
miR‐140 expression and antitumor functions in BC. (A–C) Expression levels of miR‐140‐5p and miR‐140‐3p in BC clinical specimens (= 0.0013 and = 0.0004, respectively). RNU48 was used as an internal control. P‐values were calculated using Bonferroni‐adjusted Mann–Whitney U‐test. A positive correlation between miR‐140‐5p and miR‐140‐3p expression levels was detected by Spearman's rank test (R = 0.637, = 0.0006). (D–F) Cell proliferation, migration, and invasion activities. Error bars are represented as mean ± SD (n = 5, n = 8, and n = 8, respectively). P‐values were calculated using Bonferroni‐adjusted Mann–Whitney U‐test. *< 0.001, **< 0.0001.
Figure 2
Figure 2
Clinical significance, expression, and regulation of PLOD1. (A) The strategy used to identify miR‐140‐5p candidate target genes, represented by a Venn diagram. (B) Clinical significance of PLOD1. (C) PLOD1 mRNA and protein expression in BC tissues. Scale bars of ×100 and ×400 represent 200 and 50 μm, respectively. P‐values were calculated using Bonferroni‐adjusted Mann–Whitney U‐test. (D) PLOD1 mRNA expression levels 48 h after transfection of BC cells with 10 nm miR‐140‐5p. GAPDH was used as the internal control gene. Error bars are represented as mean ± SD (n = 3). P‐values were calculated using Bonferroni‐adjusted Mann–Whitney U‐test. (E) PLOD1 protein expression 72 h after transfection with 10 nm miR‐140‐5p. GAPDH was used as the loading control. (F) Dual‐luciferase reporter assays using vectors encoding the wild‐type PLOD1 3′‐UTR sequence containing two putative miR‐140‐5p target sites and 3′‐UTR sequences with deletions of the target sites (Deletion). Normalized data were calculated as the ratio of Renilla/Firefly luciferase activities. Error bars are represented as mean ± SD (n = 3). P‐values were calculated using Bonferroni‐adjusted Mann–Whitney U‐test. *< 0.0001, **< 0.005.
Figure 3
Figure 3
Knockdown and rescue studies of PLOD1. (A, B) PLOD1 mRNA and protein expression 72 h after transfection of si‐PLOD1_1 or si‐PLOD1_2 in BC cell lines. GAPDH was used as the control. Error bars are represented as mean ± SD (n = 3). P‐values were calculated using Bonferroni‐adjusted Mann–Whitney U‐test. (C) Cell proliferation, (D) migration, and (E) invasion activities in BC cells. Error bars are represented as mean ± SD (n = 5, n = 8, and n = 8, respectively). P‐values were calculated using Bonferroni‐adjusted Mann–Whitney U‐test. (F) PLOD1 protein expression was evaluated 72 h after reverse transfection of miR‐140‐5p and 48 h after forward transfection of PLOD1. GAPDH was used as the loading control. (G) Cell proliferation assay performed 72 h after reverse transfection of miR‐140‐5p and 48 h after forward transfection of PLOD1. (H) Cell migration assay performed 48 h after reverse transfection of miR‐140‐5p and 24 h after forward transfection of PLOD1. (I) Cell invasion assay performed 48 h after reverse transfection of miR‐140‐5p and 24 h after forward transfection of PLOD1. Error bars are represented as mean ± SD (n = 5, n = 8, and n = 8, respectively). P‐values were calculated using Bonferroni‐adjusted Mann–Whitney U‐test. *< 0.0001.
Figure 4
Figure 4
Functional analysis of a PLOD1 inhibitor. (A) Cell proliferation assay of BC cells transfected with an inhibitor of PLOD1 and the IC 50 values of the PLOD1 inhibitor. IC 50 values were calculated using jmp software. Error bars are represented as mean ± SD (n = 5). P‐values were calculated using Bonferroni‐adjusted Mann–Whitney U‐test. (B) Effect of the PLOD1 inhibitor on apoptosis, as assessed by apoptosis assays, and western blot analysis of cleaved PARP, as a marker of apoptosis. GAPDH was used as the loading control. Error bars are represented as mean ± SD (n = 3). P‐values were calculated using Bonferroni‐adjusted Mann–Whitney U‐test. (C) Effect of the PLOD1 inhibitor on the cell cycle. The bar charts represent the percentages of inhibitor‐transfected cells relative to the control cells in the G0/G1, S, and G2/M phases, respectively. Error bars are represented as mean ± SD (n = 3). P‐values were calculated using Bonferroni‐adjusted Mann–Whitney U‐test. *< 0.0001.

Similar articles

Cited by

References

    1. Abufaraj M, Dalbagni G, Daneshmand S, Horenblas S, Kamat AM, Kanzaki R, Zlotta AR and Shariat SF (2018) The role of surgery in metastatic bladder cancer: a systematic review. Eur Urol 73, 543–557. - PMC - PubMed
    1. Anaya J (2016) OncoLnc: linking TCGA survival data to mRNAs, miRNAs, and lncRNAs. PeerJ Comput Sci 2, e67.
    1. Antoni S, Ferlay J, Soerjomataram I, Znaor A, Jemal A and Bray F (2017) Bladder cancer incidence and mortality: a global overview and recent trends. Eur Urol 71, 96–108. - PubMed
    1. Arai T, Kojima S, Yamada Y, Sugawara S, Kato M, Yamazaki K, Naya Y, Ichikawa T and Seki N (2018a) Pirin: a potential novel therapeutic target for castration‐resistant prostate cancer regulated by miR‐455‐5p. Mol Oncol 13, 322–337. - PMC - PubMed
    1. Arai T, Okato A, Yamada Y, Sugawara S, Kurozumi A, Kojima S, Yamazaki K, Naya Y, Ichikawa T and Seki N (2018b) Regulation of NCAPG by miR‐99a‐3p (passenger strand) inhibits cancer cell aggressiveness and is involved in CRPC. Cancer Med 7, 1988–2002. - PMC - PubMed

Publication types

MeSH terms