

Analysis of the genetic architecture of maize kernel size traits by combined linkage and association mapping
- PMID: 31199064
- PMCID: PMC6920160
- DOI: 10.1111/pbi.13188
Analysis of the genetic architecture of maize kernel size traits by combined linkage and association mapping
Abstract
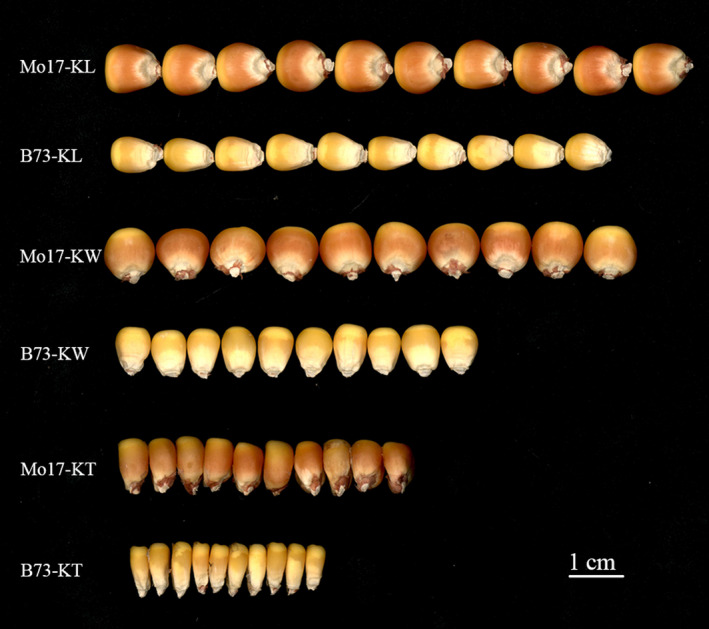
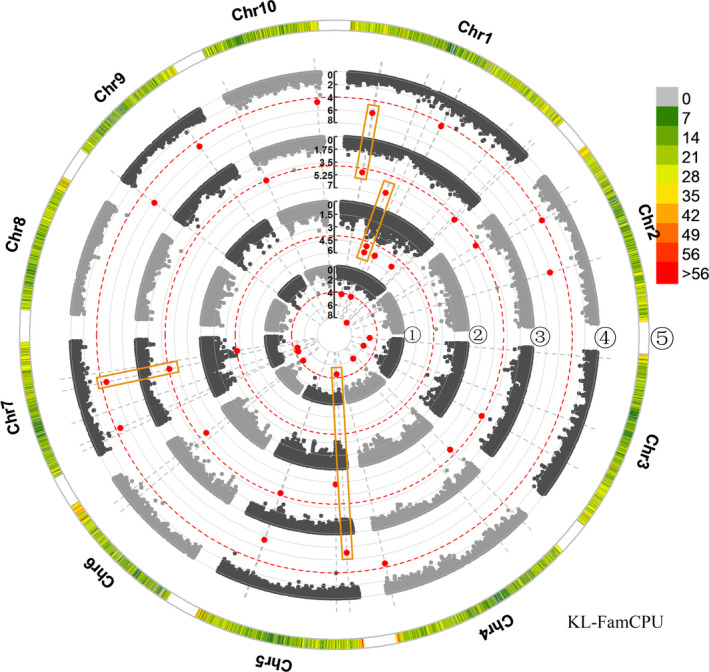
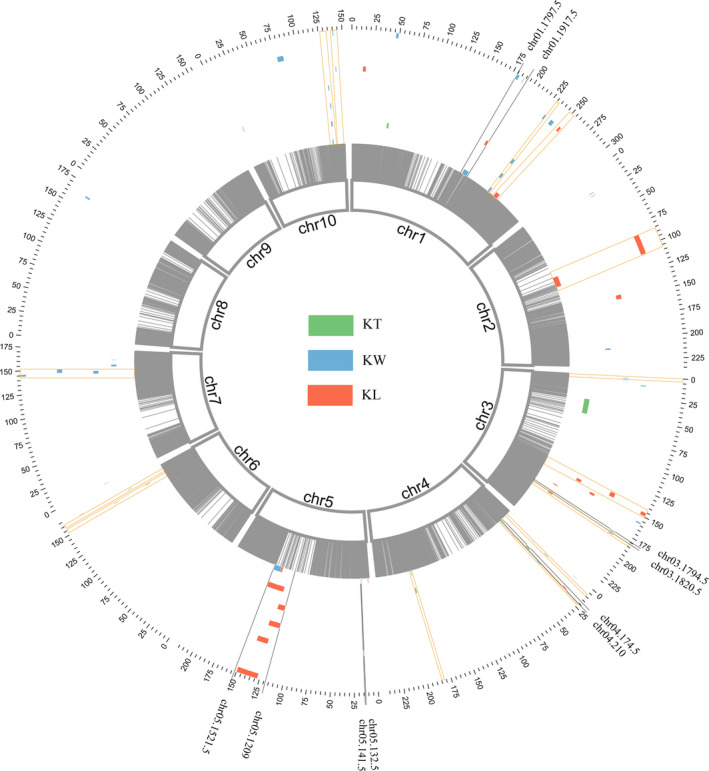
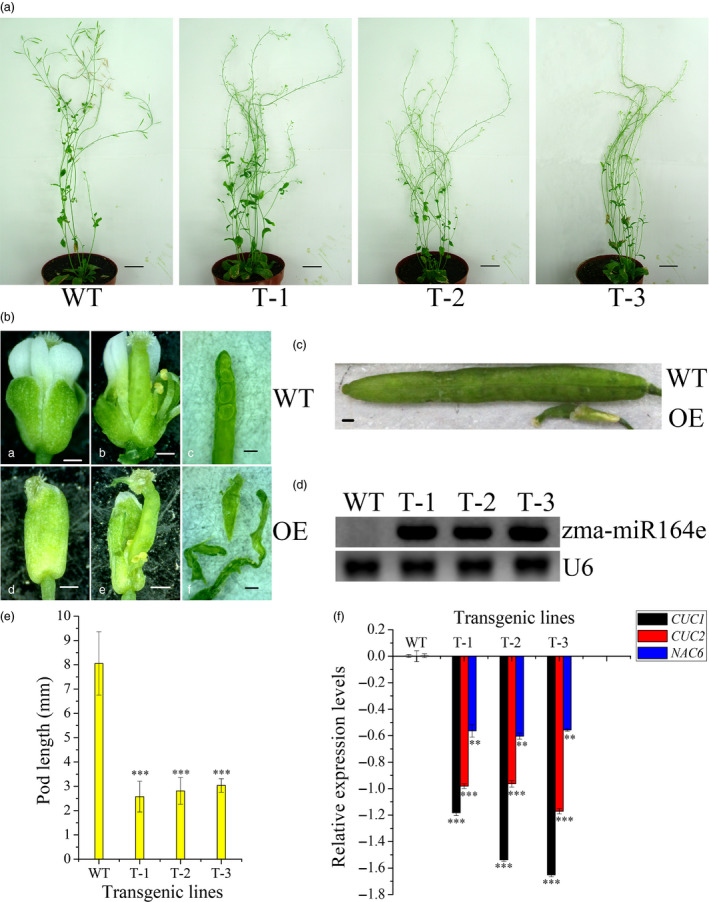
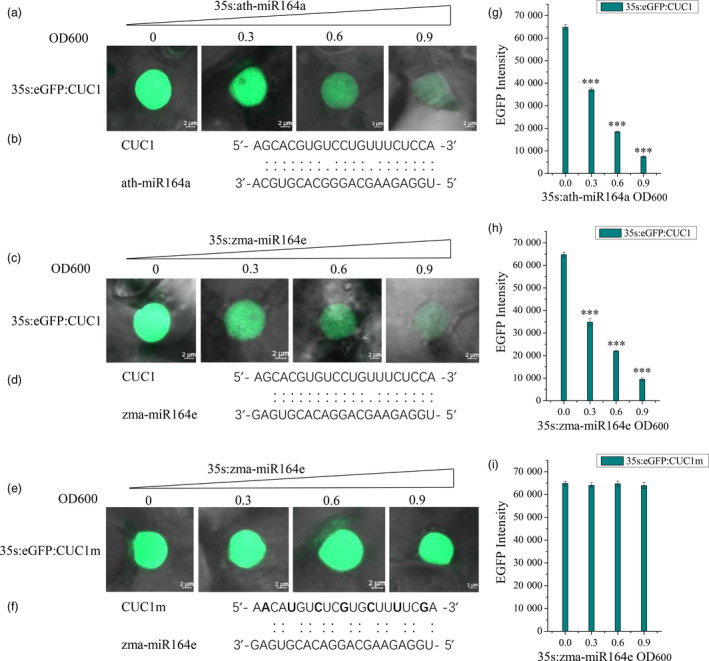
Kernel size-related traits are the most direct traits correlating with grain yield. The genetic basis of three kernel traits of maize, kernel length (KL), kernel width (KW) and kernel thickness (KT), was investigated in an association panel and a biparental population. A total of 21 single nucleotide polymorphisms (SNPs) were detected to be most significantly (P < 2.25 × 10⁻⁶ ) associated with these three traits in the association panel under four environments. Furthermore, 50 quantitative trait loci (QTL) controlling these traits were detected in seven environments in the intermated B73 × Mo17 (IBM) Syn10 doubled haploid (DH) population, of which eight were repetitively identified in at least three environments. Combining the two mapping populations revealed that 56 SNPs (P < 1 × 10⁻³ ) fell within 18 of the QTL confidence intervals. According to the top significant SNPs, stable-effect SNPs and the co-localized SNPs by association analysis and linkage mapping, a total of 73 candidate genes were identified, regulating seed development. Additionally, seven miRNAs were found to situate within the linkage disequilibrium (LD) regions of the co-localized SNPs, of which zma-miR164e was demonstrated to cleave the mRNAs of Arabidopsis CUC1, CUC2 and NAC6 in vitro. Overexpression of zma-miR164e resulted in the down-regulation of these genes above and the failure of seed formation in Arabidopsis pods, with the increased branch number. These findings provide insights into the mechanism of seed development and the improvement of molecular marker-assisted selection (MAS) for high-yield breeding in maize.
Keywords: QTL mapping; co-localization; functional genes; genome-wide association study; kernel size; maize.
© 2019 The Authors. Plant Biotechnology Journal published by Society for Experimental Biology and The Association of Applied Biologists and John Wiley & Sons Ltd.
Conflict of interest statement
The authors declare they have no conflict of interest.
Figures
Similar articles
-
Combined GWAS and QTL analysis for dissecting the genetic architecture of kernel test weight in maize.Mol Genet Genomics. 2020 Mar;295(2):409-420. doi: 10.1007/s00438-019-01631-2. Epub 2019 Dec 5. Mol Genet Genomics. 2020. PMID: 31807910
-
A combination of linkage mapping and GWAS brings new elements on the genetic basis of yield-related traits in maize across multiple environments.Theor Appl Genet. 2020 Oct;133(10):2881-2895. doi: 10.1007/s00122-020-03639-4. Epub 2020 Jun 27. Theor Appl Genet. 2020. PMID: 32594266
-
Combined linkage mapping and association analysis uncovers candidate genes for 25 leaf-related traits across three environments in maize.Theor Appl Genet. 2023 Jan;136(1):12. doi: 10.1007/s00122-023-04285-2. Epub 2023 Jan 20. Theor Appl Genet. 2023. PMID: 36662253
-
Hotspot Regions of Quantitative Trait Loci and Candidate Genes for Ear-Related Traits in Maize: A Literature Review.Genes (Basel). 2023 Dec 21;15(1):15. doi: 10.3390/genes15010015. Genes (Basel). 2023. PMID: 38275597 Free PMC article. Review.
-
Review: Recent advances in unraveling the genetic architecture of kernel row number in maize.Plant Sci. 2025 Mar;352:112366. doi: 10.1016/j.plantsci.2024.112366. Epub 2024 Dec 20. Plant Sci. 2025. PMID: 39710150 Review.
Cited by
-
Identification of Multiple Genetic Loci Related to Low-Temperature Tolerance during Germination in Maize (Zea maize L.) through a Genome-Wide Association Study.Curr Issues Mol Biol. 2023 Nov 29;45(12):9634-9655. doi: 10.3390/cimb45120602. Curr Issues Mol Biol. 2023. PMID: 38132448 Free PMC article.
-
Angular Leaf Spot Resistance Loci Associated With Different Plant Growth Stages in Common Bean.Front Plant Sci. 2021 Apr 13;12:647043. doi: 10.3389/fpls.2021.647043. eCollection 2021. Front Plant Sci. 2021. PMID: 33927738 Free PMC article.
-
A combination of QTL mapping and genome-wide association study revealed the key gene for husk number in maize.Theor Appl Genet. 2024 Apr 25;137(5):112. doi: 10.1007/s00122-024-04617-w. Theor Appl Genet. 2024. PMID: 38662228
-
DEK219 and HSF17 Collaboratively Regulate the Kernel Length in Maize.Plants (Basel). 2024 Jun 7;13(12):1592. doi: 10.3390/plants13121592. Plants (Basel). 2024. PMID: 38931024 Free PMC article.
-
Quantitative trait locus analysis of gray leaf spot resistance in the maize IBM Syn10 DH population.Theor Appl Genet. 2024 Jul 13;137(8):183. doi: 10.1007/s00122-024-04694-x. Theor Appl Genet. 2024. PMID: 39002016
References
-
- Allen, M. , Qin, W. , Moreau, F. and Moffatt, B. (2002) Adenine phosphoribosyltransferase isoforms of Arabidopsis and their potential contributions to adenine and cytokinin metabolism. Physiol. Plant. 115, 56–68. - PubMed
-
- Bradbury, P.J. , Zhang, Z. , Kroon, D.E. , Casstevens, T.M. , Ramdoss, Y. and Buckler, E.S. (2007) TASSEL: Software for association mapping of complex traits in diverse samples. Bioinformatics, 23, 2633–2635. - PubMed
-
- Cai, M. , Li, S. , Sun, F. , Sun, Q. , Zhao, H. , Ren, X. , Zhao, Y. et al. (2017) Emp10 encodes a mitochondrial PPR protein that affects the cis‐splicing of nad2 intron 1 and seed development in maize. Plant J. 91, 132–144. - PubMed
Publication types
MeSH terms
LinkOut - more resources
Full Text Sources
Research Materials
