Synaptic inhibition tunes contrast computation in the retina
- PMID: 31199207
- PMCID: PMC6578594
- DOI: 10.1017/S095252381900004X
Synaptic inhibition tunes contrast computation in the retina
Abstract
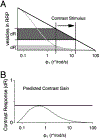
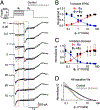
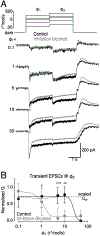
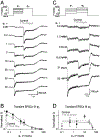
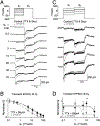
Inhibition shapes activity and signal processing in neural networks through numerous mechanisms mediated by many different cell types. Here, we examined how one type of GABAergic interneuron in the retina, the A17 amacrine cell, influences visual information processing. Our results suggest that A17s, which make reciprocal feedback inhibitory synapses onto rod bipolar cell (RBC) synaptic terminals, extend the luminance range over which RBC synapses compute temporal contrast and enhance the reliability of contrast signals over this range. Inhibition from other amacrine cells does not influence these computational features. Although A17-mediated feedback is mediated by both GABAA and GABAC receptors, the latter plays the primary role in extending the range of contrast computation. These results identify specific functions for an inhibitory interneuron subtype, as well as specific synaptic receptors, in a behaviorally relevant neural computation.
Keywords: Amacrine cell; Feedback inhibition; Ribbon synapse; Weber contrast.
Figures
Similar articles
-
Mechanisms underlying lateral GABAergic feedback onto rod bipolar cells in rat retina.J Neurosci. 2010 Feb 10;30(6):2330-9. doi: 10.1523/JNEUROSCI.5574-09.2010. J Neurosci. 2010. PMID: 20147559 Free PMC article.
-
Complex inhibitory microcircuitry regulates retinal signaling near visual threshold.J Neurophysiol. 2015 Jul;114(1):341-53. doi: 10.1152/jn.00017.2015. Epub 2015 May 13. J Neurophysiol. 2015. PMID: 25972578 Free PMC article.
-
Interneuron circuits tune inhibition in retinal bipolar cells.J Neurophysiol. 2010 Jan;103(1):25-37. doi: 10.1152/jn.00458.2009. Epub 2009 Nov 11. J Neurophysiol. 2010. PMID: 19906884 Free PMC article.
-
Amacrine cell-mediated input to bipolar cells: variations on a common mechanistic theme.Vis Neurosci. 2012 Jan;29(1):41-9. doi: 10.1017/S0952523811000241. Vis Neurosci. 2012. PMID: 22310371 Review.
-
A17 Amacrine Cells and Olfactory Granule Cells: Parallel Processors of Early Sensory Information.Front Cell Neurosci. 2020 Nov 5;14:600537. doi: 10.3389/fncel.2020.600537. eCollection 2020. Front Cell Neurosci. 2020. PMID: 33250720 Free PMC article. Review.
Cited by
-
Origin of Retinal Oscillatory Potentials in the Mouse, a Tool to Specifically Locate Retinal Damage.Int J Mol Sci. 2023 Feb 4;24(4):3126. doi: 10.3390/ijms24043126. Int J Mol Sci. 2023. PMID: 36834538 Free PMC article.
-
Asymmetric Activation of ON and OFF Pathways in the Degenerated Retina.eNeuro. 2024 May 15;11(5):ENEURO.0110-24.2024. doi: 10.1523/ENEURO.0110-24.2024. Print 2024 May. eNeuro. 2024. PMID: 38719453 Free PMC article.
-
Temporal pattern recognition in retinal ganglion cells is mediated by dynamical inhibitory synapses.Nat Commun. 2024 Jul 20;15(1):6118. doi: 10.1038/s41467-024-50506-7. Nat Commun. 2024. PMID: 39033142 Free PMC article.
-
Differences in the spatial fidelity of evoked and spontaneous signals in the degenerating retina.Front Cell Neurosci. 2022 Nov 7;16:1040090. doi: 10.3389/fncel.2022.1040090. eCollection 2022. Front Cell Neurosci. 2022. PMID: 36419935 Free PMC article.
-
GABAA presynaptic inhibition regulates the gain and kinetics of retinal output neurons.Elife. 2021 Apr 27;10:e60994. doi: 10.7554/eLife.60994. Elife. 2021. PMID: 33904401 Free PMC article.
References
-
- Aguilar M & Stiles W. (1954). Saturation of the Rod Mechanism of the Retina at High Levels of Stimulation. Optica Acta: International Journal of Optics 1, 59–65.
-
- Bloomfield SA. (1992) . Relationship between receptive and dendritic field size of amacrine cells in the rabbit retina. J Neurophysiol 68, 711–725. - PubMed
Publication types
MeSH terms
Grants and funding
LinkOut - more resources
Full Text Sources

