. 2019 Nov;87(11):952-965.
doi: 10.1002/prot.25757. Epub 2019 Jun 26.

Decrypting protein surfaces by combining evolution, geometry, and molecular docking

Affiliations

Decrypting protein surfaces by combining evolution, geometry, and molecular docking

Chloé Dequeker et al. Proteins. 2019 Nov.

Abstract

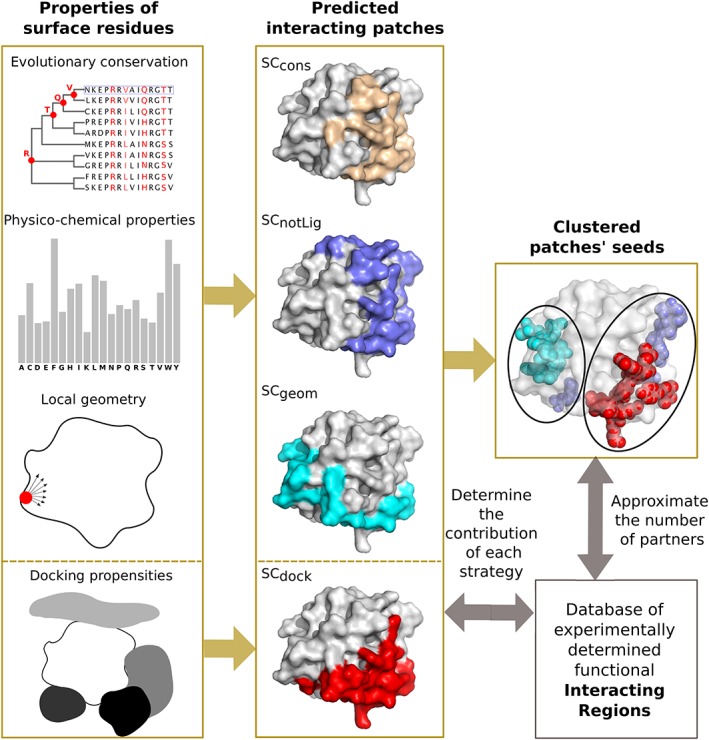
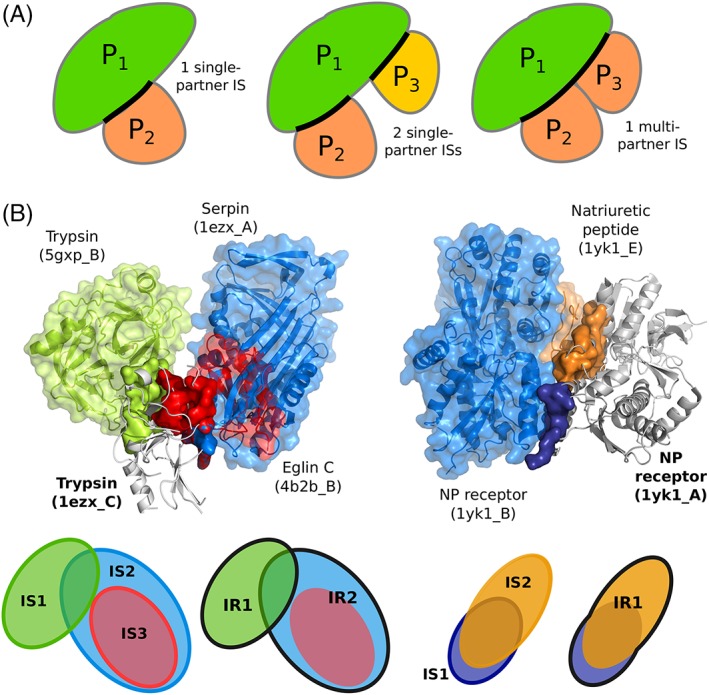
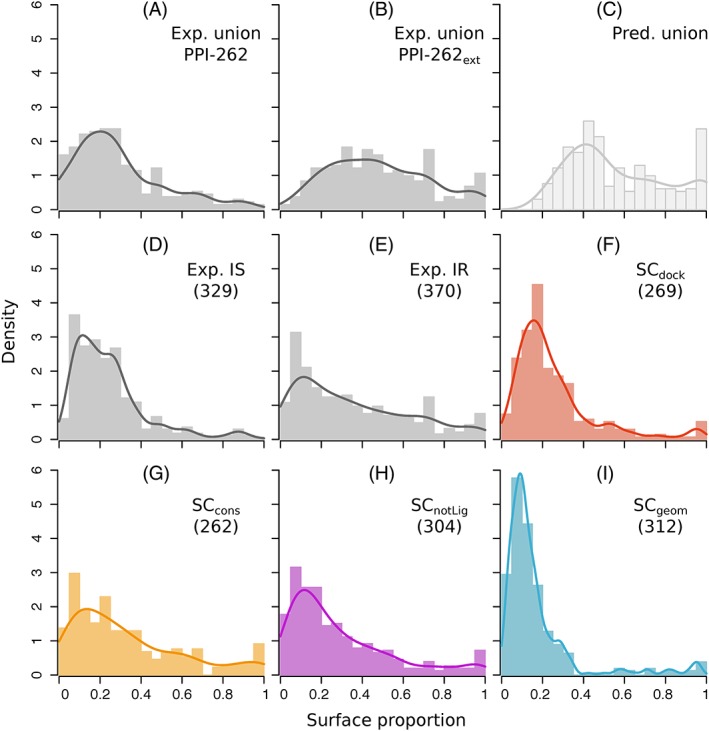
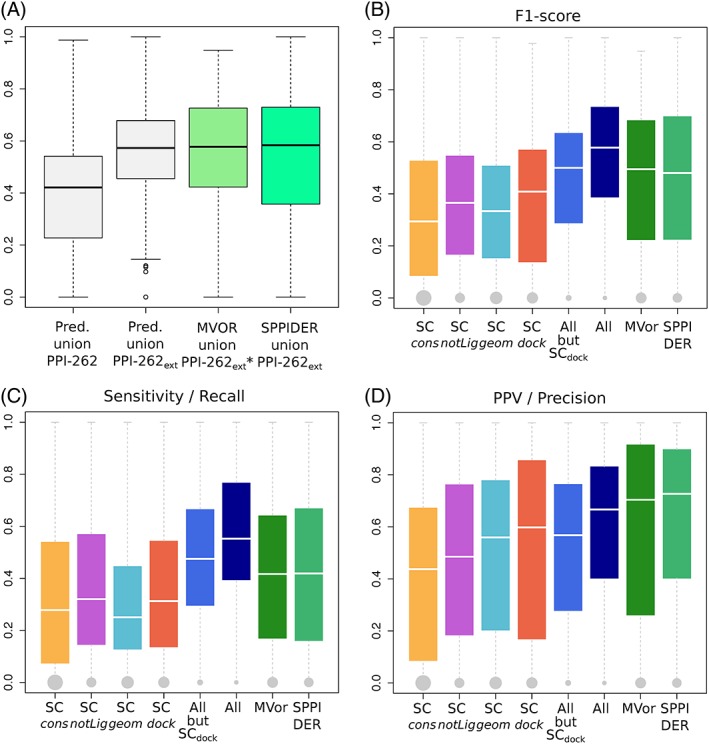
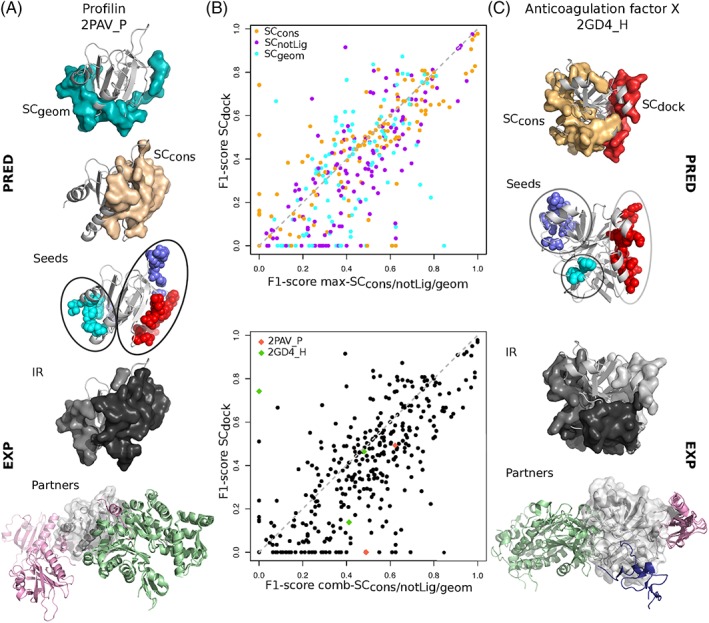
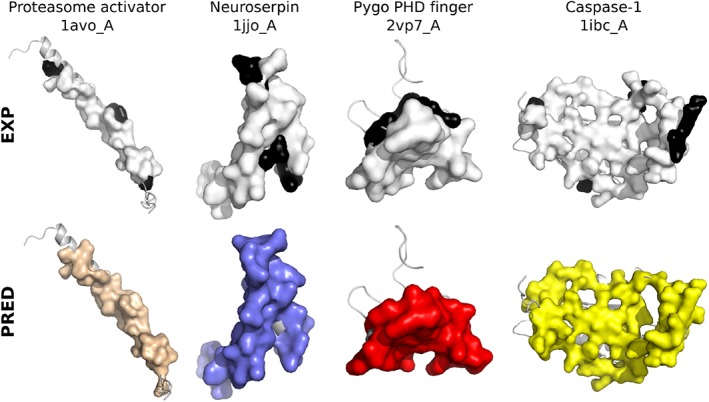
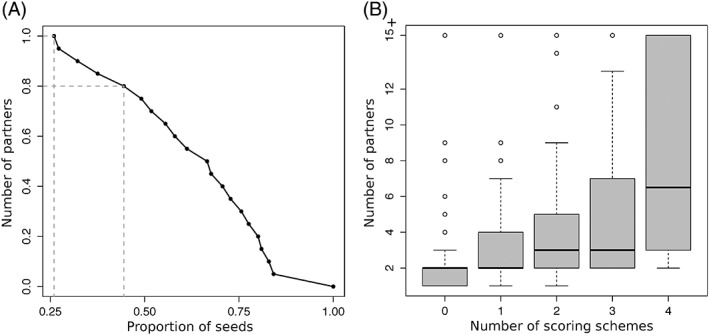
The growing body of experimental and computational data describing how proteins interact with each other has emphasized the multiplicity of protein interactions and the complexity underlying protein surface usage and deformability. In this work, we propose new concepts and methods toward deciphering such complexity. We introduce the notion of interacting region to account for the multiple usage of a protein's surface residues by several partners and for the variability of protein interfaces coming from molecular flexibility. We predict interacting patches by crossing evolutionary, physicochemical and geometrical properties of the protein surface with information coming from complete cross-docking (CC-D) simulations. We show that our predictions match well interacting regions and that the different sources of information are complementary. We further propose an indicator of whether a protein has a few or many partners. Our prediction strategies are implemented in the dynJET2 algorithm and assessed on a new dataset of 262 protein on which we performed CC-D. The code and the data are available at: http://www.lcqb.upmc.fr/dynJET2/.

Keywords: binding site; complete cross-docking; evolutionary conservation; interface prediction; protein-protein interaction.


Conflict of interest statement

The authors have no conflict of interest to declare.

Figures

Figure 1
Figure 1
Schematic representation of our workflow. We consider four residue‐based properties (left panel), namely evolutionary conservation, amino acid propensities to be found at an interface, local geometry, and propensities to be found in docked interfaces. We predict interacting patches at the surface of proteins by using four different strategies: SCcons, SCnotLig, and SCgeom combines the first three properties, while SCdock relies exclusively on the fourth property. We compare the predicted patches with a set of experimentally determined functional interacting regions. We analyze and cluster the predicted patches' seeds, from which they were grown, to precisely localize interacting regions and infer the number of partners used by each region [Color figure can be viewed at http://wileyonlinelibrary.com]
Figure 2
Figure 2
Examples and schema illustrating the notions of interacting site and interacting region. A, Schematic representation of single‐ and multiple‐partner interacting sites. Three proteins are considered, namely P1, P2, and P3. The ISs defined on P1 are highlighted by thick black lines. See the materials and methods section for a precise definition of the sites issued from multiple partners. B, Two examples of the usage of the protein surface by different partners. The query proteins are displayed as gray cartoons, their interacting sites as opaque colored surfaces, and their partners as colored cartoons and transparent surfaces. Left: trypsin (1ezx_C, in gray) interacts with itself (5gxp_B, in green), serpin (1ezx_A, in blue) and eglin C (4b2b_B, in red). The three corresponding ISs lead to the definition of 2 IRs, as depicted on the schema at the bottom, where each IR is contoured by a thick line. Right: the natriuretic peptide receptor forms a homodimer (1yk1_A, in gray, and 1yk1_B, in blue) to bind its substrate (1yk1_E, in orange). The 2 ISs detected at the surface of one receptor monomer (1yk1_A, in gray) are merged into an IR
Figure 3
Figure 3
Proportion of protein surface covered by experimental interfaces and predicted patches. Distribution are reported for: (A) the union of ISs from PPI‐262, (B) the union of IRs from PPI‐262ext (C) the union of patches predicted by dynJET2, (D) individual ISs from PPI‐262, (E) individual IRs from PPI‐262ext,(F‐I) individual patches predicted by each SC. The union of ISs, IRs or predicted patches is realized for each protein. Notice that the sizes of the predicted patches do not add up when considering their union, since several of them overlap [Color figure can be viewed at http://wileyonlinelibrary.com]
Figure 4
Figure 4
Agreement between experimental interfaces and predicted patches. A, Distributions of F1‐scores computed for the union of dynJET2 predictions (boxes in light gray), Multi‐VORFFIP predictions (box in light green) and SPPIDER predictions (box in spring green). dynJET2 predictions were assessed against the union of ISs from PPI‐262 and of IRs from PPI‐262ext. Multi‐VORFFIP predictions were assessed against the union of IRs from PPI‐262ext*, a subset from PPI‐262ext involving 252 protein chains. SPPIDER predictions were assessed against the union of IRs from PPI‐262ext. B‐D, Agreement between predicted patches and experimental IRs from PPI‐262ext. For each IR, the best‐matching patch or combination of patches predicted by the strategies/methods indicated in x‐axis is retained. The performance measures are the following: (B) F1‐score, (C) sensitivity (recall), (D) positive predicted value (precision). The sizes of the gray dots are proportional to the number of IRs that could not be detected at all [Color figure can be viewed at http://wileyonlinelibrary.com]
Figure 5
Figure 5
Examples and comparison of predictions. A, Profilin (light gray cartoon) displayed with the patches predicted by SCcons (in beige) and SCgeom (in cyan), the patches' clustered seeds, two experimental IRs from PPI‐262ext (in gray tones) and the corresponding partners (colored cartoons); (B) Scatterplot of F1‐scores computed for the best‐matching patch or combination of patches, among SCcons, SCnotLig, SCgeom (x‐axis), and from SCdock (y‐axis) against experimental IRs from PPI‐262ext. In cases where a combination of several patches is retained, the patches either come from a single SC (on top) or from several SC (at the bottom, x‐axis). (C) Heavy chain of the anticoagulation factor X (light gray cartoon) displayed with the patches predicted by SCcons (beige) and SCdock (red), the patches' clustered seeds, the three experimental IRs from PPI‐262ext (in gray tones) and the corresponding partners (colored cartoons) [Color figure can be viewed at http://wileyonlinelibrary.com]
Figure 6
Figure 6
Examples of predictions whose precision is higher on the IR compared to the IS. The query protein structure from P‐262 is displayed as a gray cartoon. The experimental and predicted interfaces are displayed as opaque surfaces: on top, the IS is colored in white and the additional residues belonging to the IR are in black; at the bottom, the SCcons, SCnotLig, and SCdock patches predicted for 1avo_A, 1jjo_A, 2vp7_A are in wheat, purple and red, respectively, and the best combination of patches predicted for 1ibc_A is in yellow. The precision increases from 79% to 91% for 1avo_A, from 76% to 92% for 1jjo_A, from 70% to 83% for 2vp7_A and from 75% to 84% for 1ibc_A [Color figure can be viewed at http://wileyonlinelibrary.com]
Figure 7
Figure 7
Ability of the patches' seeds to detect IRs and estimate the number of partners. (A) Cumulative distribution of patches' seeds precision in detecting IRs. Each x‐value corresponds to the proportion of seeds with precision higher than the y‐value. Dotted segments emphasize the points with y = 1 and y = 0.8. (B) Number of partners for each IR vs number of scoring schemes predicting a seed in the IR

Similar articles

Cited by

References

    1. Baker M. Proteomics: the interaction map. Nature. 2012;484(7393):271‐275. - PubMed
    1. Bonetta L. Protein‐protein interactions: Interactome under construction. Nature. 2010;468(7325):851‐854. - PubMed
    1. Huttlin EL, Ting L, Bruckner RJ, et al. The BioPlex network: a systematic exploration of the human Interactome. Cell. 2015;162(2):425‐440. - PMC - PubMed
    1. Rolland T, Taşan M, Charloteaux B, et al. A proteome‐scale map of the human interactome network. Cell. 2014;159(5):1212‐1226. - PMC - PubMed
    1. Meyer MJ, Beltran JF, Liang S, et al. Interactome INSIDER: a structural interactome browser for genomic studies. Nat Methods. 2018;15(2):107‐114. - PMC - PubMed

Publication types

LinkOut - more resources