Review
. 2019 Jul-Aug;39(4):998-1016.
doi: 10.1148/rg.2019180178. Epub 2019 Jun 14.

Current Challenges in Diagnosis and Assessment of the Response of Locally Advanced and Metastatic Renal Cell Carcinoma

Affiliations
Review

Current Challenges in Diagnosis and Assessment of the Response of Locally Advanced and Metastatic Renal Cell Carcinoma

Alberto Diaz de Leon et al. Radiographics. 2019 Jul-Aug.

Abstract

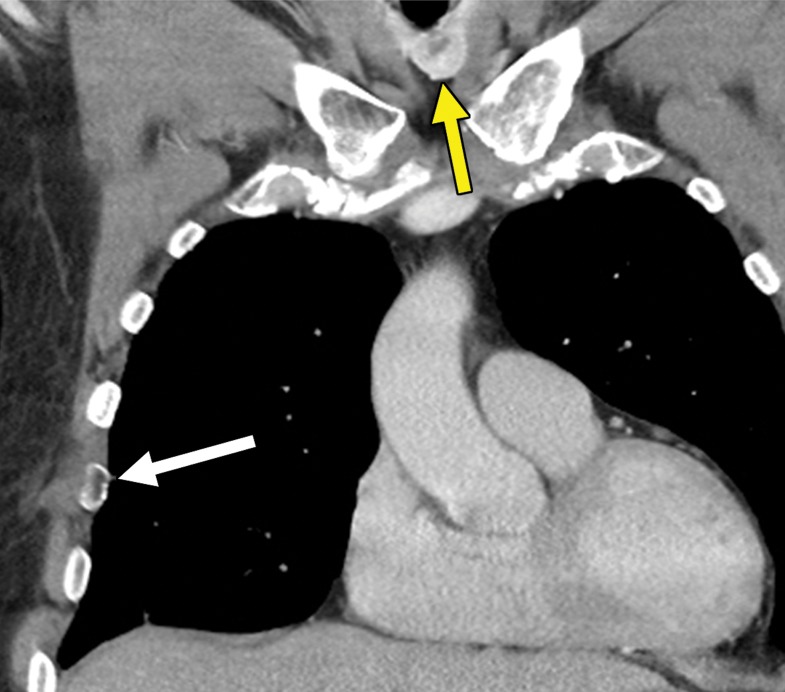
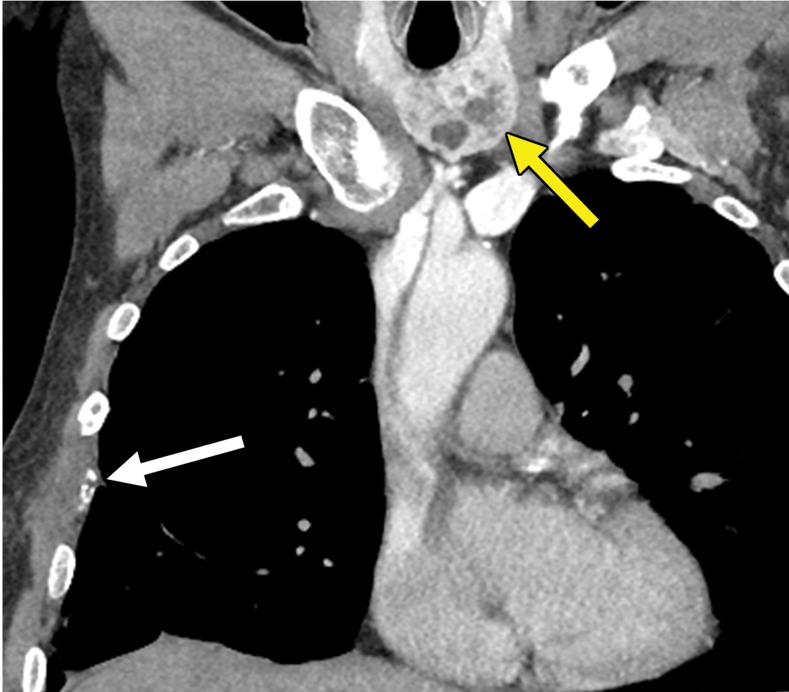
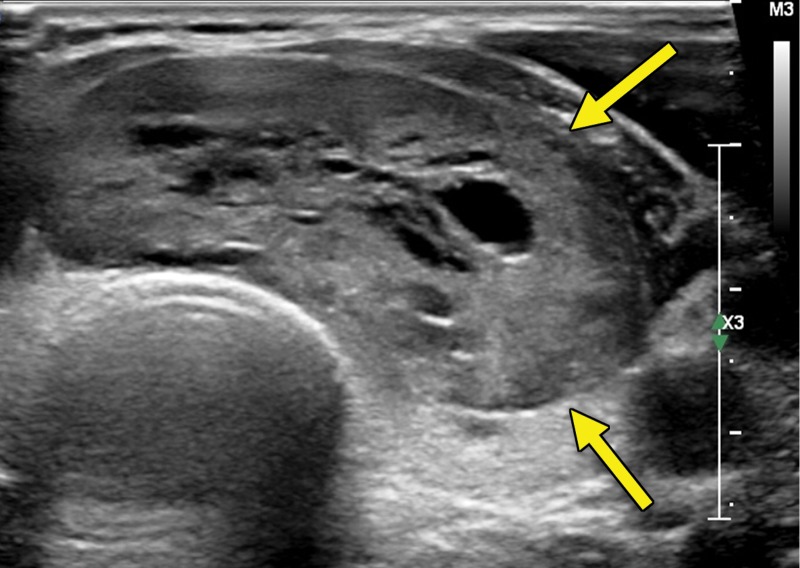
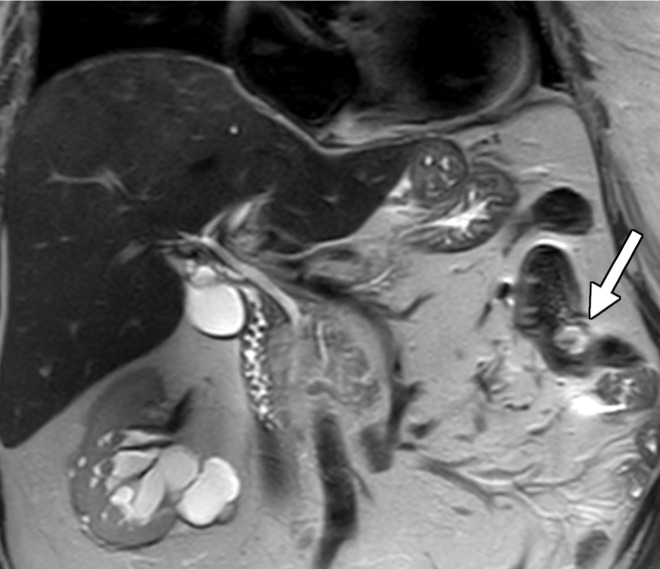
Locally advanced and metastatic renal cell carcinoma (RCC) present a specific set of challenges to the radiologist. The detection of metastatic disease is confounded by the ability of RCC to metastasize to virtually any part of the human body long after surgical resection of the primary tumor. This includes sites not commonly included in routine surveillance, which come to light after the patient becomes symptomatic. In the assessment of treatment response, the phenomenon of tumor heterogeneity, where clone selection through systemic therapy drives the growth of potentially more aggressive phenotypes, can result in oligoprogression despite overall disease control. Finally, advances in therapy have resulted in the development of immuno-oncologic agents that may result in changes that are not adequately evaluated with conventional size-based response criteria and may even be misinterpreted as progression. This article reviews the common challenges a radiologist may encounter in the evaluation of patients with locally advanced and metastatic RCC. ©RSNA, 2019.


Figures

Figure 1a.
Figure 1a.
Thyroid metastasis from clear cell RCC in a 53-year-old man. (a) Coronal CT image of the chest with intravenous contrast material shows a heterogeneous nodule in the left lobe of the thyroid (yellow arrow). Note the subtle residual cortical irregularity in the right fifth rib (white arrow), which is a sequela of a metastasis that had been treated previously with stereotactic radiation therapy. (b) Coronal CT image of the chest from an examination performed 2 years later shows interval enlargement of the left thyroid lesion (yellow arrow). Again note the subtle cortical irregularity in the right fifth rib (white arrow). (c) Thyroid US image from an examination performed soon after the CT examination in b shows a predominantly solid nodule with scattered cystic components in the left thyroid lobe (arrows). Fine-needle-aspiration biopsy allowed confirmation of metastatic RCC.
Figure 1b.
Figure 1b.
Thyroid metastasis from clear cell RCC in a 53-year-old man. (a) Coronal CT image of the chest with intravenous contrast material shows a heterogeneous nodule in the left lobe of the thyroid (yellow arrow). Note the subtle residual cortical irregularity in the right fifth rib (white arrow), which is a sequela of a metastasis that had been treated previously with stereotactic radiation therapy. (b) Coronal CT image of the chest from an examination performed 2 years later shows interval enlargement of the left thyroid lesion (yellow arrow). Again note the subtle cortical irregularity in the right fifth rib (white arrow). (c) Thyroid US image from an examination performed soon after the CT examination in b shows a predominantly solid nodule with scattered cystic components in the left thyroid lobe (arrows). Fine-needle-aspiration biopsy allowed confirmation of metastatic RCC.
Figure 1c.
Figure 1c.
Thyroid metastasis from clear cell RCC in a 53-year-old man. (a) Coronal CT image of the chest with intravenous contrast material shows a heterogeneous nodule in the left lobe of the thyroid (yellow arrow). Note the subtle residual cortical irregularity in the right fifth rib (white arrow), which is a sequela of a metastasis that had been treated previously with stereotactic radiation therapy. (b) Coronal CT image of the chest from an examination performed 2 years later shows interval enlargement of the left thyroid lesion (yellow arrow). Again note the subtle cortical irregularity in the right fifth rib (white arrow). (c) Thyroid US image from an examination performed soon after the CT examination in b shows a predominantly solid nodule with scattered cystic components in the left thyroid lobe (arrows). Fine-needle-aspiration biopsy allowed confirmation of metastatic RCC.
Figure 2a.
Figure 2a.
Clear cell RCC metastasis to the small bowel in a 57-year-old man. (ac) Coronal T2-weighted (a), axial fat-saturated T2-weighted (b), and axial three-dimensional contrast-enhanced T1-weighted (c) MR images through the upper abdomen show a subtle intraluminal lesion in a segment of the jejunum (arrow in a and c). Note the hypervascular nature of the lesion exhibiting intense enhancement during the arterial phase (arrow in c), which is typical of clear cell RCC. During the MRI examination, the segment of the bowel with the lesion was intermittently undergoing intussusception (arrows in b), which obscured the abnormality. (d, e) Coronal T2-weighted (d) and axial contrast-enhanced arterial phase (e) MR images acquired 3 months later show that the abnormality has increased in size and is more readily visible (arrow).
Figure 2b.
Figure 2b.
Clear cell RCC metastasis to the small bowel in a 57-year-old man. (ac) Coronal T2-weighted (a), axial fat-saturated T2-weighted (b), and axial three-dimensional contrast-enhanced T1-weighted (c) MR images through the upper abdomen show a subtle intraluminal lesion in a segment of the jejunum (arrow in a and c). Note the hypervascular nature of the lesion exhibiting intense enhancement during the arterial phase (arrow in c), which is typical of clear cell RCC. During the MRI examination, the segment of the bowel with the lesion was intermittently undergoing intussusception (arrows in b), which obscured the abnormality. (d, e) Coronal T2-weighted (d) and axial contrast-enhanced arterial phase (e) MR images acquired 3 months later show that the abnormality has increased in size and is more readily visible (arrow).
Figure 2c.
Figure 2c.
Clear cell RCC metastasis to the small bowel in a 57-year-old man. (ac) Coronal T2-weighted (a), axial fat-saturated T2-weighted (b), and axial three-dimensional contrast-enhanced T1-weighted (c) MR images through the upper abdomen show a subtle intraluminal lesion in a segment of the jejunum (arrow in a and c). Note the hypervascular nature of the lesion exhibiting intense enhancement during the arterial phase (arrow in c), which is typical of clear cell RCC. During the MRI examination, the segment of the bowel with the lesion was intermittently undergoing intussusception (arrows in b), which obscured the abnormality. (d, e) Coronal T2-weighted (d) and axial contrast-enhanced arterial phase (e) MR images acquired 3 months later show that the abnormality has increased in size and is more readily visible (arrow).
Figure 2d.
Figure 2d.
Clear cell RCC metastasis to the small bowel in a 57-year-old man. (ac) Coronal T2-weighted (a), axial fat-saturated T2-weighted (b), and axial three-dimensional contrast-enhanced T1-weighted (c) MR images through the upper abdomen show a subtle intraluminal lesion in a segment of the jejunum (arrow in a and c). Note the hypervascular nature of the lesion exhibiting intense enhancement during the arterial phase (arrow in c), which is typical of clear cell RCC. During the MRI examination, the segment of the bowel with the lesion was intermittently undergoing intussusception (arrows in b), which obscured the abnormality. (d, e) Coronal T2-weighted (d) and axial contrast-enhanced arterial phase (e) MR images acquired 3 months later show that the abnormality has increased in size and is more readily visible (arrow).
Figure 2e.
Figure 2e.
Clear cell RCC metastasis to the small bowel in a 57-year-old man. (ac) Coronal T2-weighted (a), axial fat-saturated T2-weighted (b), and axial three-dimensional contrast-enhanced T1-weighted (c) MR images through the upper abdomen show a subtle intraluminal lesion in a segment of the jejunum (arrow in a and c). Note the hypervascular nature of the lesion exhibiting intense enhancement during the arterial phase (arrow in c), which is typical of clear cell RCC. During the MRI examination, the segment of the bowel with the lesion was intermittently undergoing intussusception (arrows in b), which obscured the abnormality. (d, e) Coronal T2-weighted (d) and axial contrast-enhanced arterial phase (e) MR images acquired 3 months later show that the abnormality has increased in size and is more readily visible (arrow).
Figure 3a.
Figure 3a.
Hereditary leiomyomatosis and RCC syndrome in a 30-year-old woman. (a) Axial contrast-enhanced T1-weighted MR image shows a right partially cystic renal tumor. Note the obvious infiltration of the renal parenchyma by the tumor (arrow). After nephrectomy, histopathologic evaluation and molecular assessment of the tumor disclosed fumarate hydratase–deficient RCC. (b, c) Axial (b) and sagittal (c) contrast-enhanced CT images acquired 1 year after nephrectomy show diffuse omental carcinomatosis (white arrows in b and c). An enhancing mass consistent with a leiomyoma is noted in the uterus (yellow arrow in c).
Figure 3b.
Figure 3b.
Hereditary leiomyomatosis and RCC syndrome in a 30-year-old woman. (a) Axial contrast-enhanced T1-weighted MR image shows a right partially cystic renal tumor. Note the obvious infiltration of the renal parenchyma by the tumor (arrow). After nephrectomy, histopathologic evaluation and molecular assessment of the tumor disclosed fumarate hydratase–deficient RCC. (b, c) Axial (b) and sagittal (c) contrast-enhanced CT images acquired 1 year after nephrectomy show diffuse omental carcinomatosis (white arrows in b and c). An enhancing mass consistent with a leiomyoma is noted in the uterus (yellow arrow in c).
Figure 3c.
Figure 3c.
Hereditary leiomyomatosis and RCC syndrome in a 30-year-old woman. (a) Axial contrast-enhanced T1-weighted MR image shows a right partially cystic renal tumor. Note the obvious infiltration of the renal parenchyma by the tumor (arrow). After nephrectomy, histopathologic evaluation and molecular assessment of the tumor disclosed fumarate hydratase–deficient RCC. (b, c) Axial (b) and sagittal (c) contrast-enhanced CT images acquired 1 year after nephrectomy show diffuse omental carcinomatosis (white arrows in b and c). An enhancing mass consistent with a leiomyoma is noted in the uterus (yellow arrow in c).
Figure 4a.
Figure 4a.
Metastatic clear cell RCC to the large bowel in a 54-year-old man. (a, b) Axial contrast-enhanced arterial phase (a) and portal venous phase (b) CT images of the upper abdomen show a subtle intraluminal lesion in the proximal transverse colon that appears nearly isointense (yellow arrow in a) compared with the oral contrast material (red arrow in a) in the adjacent colon on the arterial phase image. The lesion becomes hypointense (yellow arrow in b) relative to the oral contrast material in the adjacent colon (red arrow in b) during the portal phase acquisition. This lesion went undetected on several subsequent follow-up studies. (c, d) Axial (c) and coronal (d) CT images of the upper abdomen acquired 1.5 years later show that the intraluminal lesion has increased in size (yellow arrow) and resulted in a short-segment colocolic intussusception. Subsequent hemicolectomy allowed confirmation of metastatic clear cell RCC.
Figure 4b.
Figure 4b.
Metastatic clear cell RCC to the large bowel in a 54-year-old man. (a, b) Axial contrast-enhanced arterial phase (a) and portal venous phase (b) CT images of the upper abdomen show a subtle intraluminal lesion in the proximal transverse colon that appears nearly isointense (yellow arrow in a) compared with the oral contrast material (red arrow in a) in the adjacent colon on the arterial phase image. The lesion becomes hypointense (yellow arrow in b) relative to the oral contrast material in the adjacent colon (red arrow in b) during the portal phase acquisition. This lesion went undetected on several subsequent follow-up studies. (c, d) Axial (c) and coronal (d) CT images of the upper abdomen acquired 1.5 years later show that the intraluminal lesion has increased in size (yellow arrow) and resulted in a short-segment colocolic intussusception. Subsequent hemicolectomy allowed confirmation of metastatic clear cell RCC.
Figure 4c.
Figure 4c.
Metastatic clear cell RCC to the large bowel in a 54-year-old man. (a, b) Axial contrast-enhanced arterial phase (a) and portal venous phase (b) CT images of the upper abdomen show a subtle intraluminal lesion in the proximal transverse colon that appears nearly isointense (yellow arrow in a) compared with the oral contrast material (red arrow in a) in the adjacent colon on the arterial phase image. The lesion becomes hypointense (yellow arrow in b) relative to the oral contrast material in the adjacent colon (red arrow in b) during the portal phase acquisition. This lesion went undetected on several subsequent follow-up studies. (c, d) Axial (c) and coronal (d) CT images of the upper abdomen acquired 1.5 years later show that the intraluminal lesion has increased in size (yellow arrow) and resulted in a short-segment colocolic intussusception. Subsequent hemicolectomy allowed confirmation of metastatic clear cell RCC.
Figure 4d.
Figure 4d.
Metastatic clear cell RCC to the large bowel in a 54-year-old man. (a, b) Axial contrast-enhanced arterial phase (a) and portal venous phase (b) CT images of the upper abdomen show a subtle intraluminal lesion in the proximal transverse colon that appears nearly isointense (yellow arrow in a) compared with the oral contrast material (red arrow in a) in the adjacent colon on the arterial phase image. The lesion becomes hypointense (yellow arrow in b) relative to the oral contrast material in the adjacent colon (red arrow in b) during the portal phase acquisition. This lesion went undetected on several subsequent follow-up studies. (c, d) Axial (c) and coronal (d) CT images of the upper abdomen acquired 1.5 years later show that the intraluminal lesion has increased in size (yellow arrow) and resulted in a short-segment colocolic intussusception. Subsequent hemicolectomy allowed confirmation of metastatic clear cell RCC.
Figure 5a.
Figure 5a.
Metastatic RCC involving the pancreas and left adrenal gland in a 65-year-old man. (a, b) Axial (a) and coronal (b) contrast-enhanced CT images acquired during the arterial phase show an avidly enhancing mass in the pancreatic neck (red arrow in a) resulting in upstream dilatation of the pancreatic duct (arrow in b). A large left adrenal metastasis (black arrow in a) is present. The patient was subsequently administered ipilimumab and nivolumab. (c, d) Axial (c) and coronal (d) contrast-enhanced CT images from an examination performed 3 months after the initiation of therapy show a dramatic decrease in the size and enhancement of the pancreatic (red arrow in c) and adrenal (black arrow in c) metastases. Note the associated resolution of pancreatic ductal dilatation.
Figure 5b.
Figure 5b.
Metastatic RCC involving the pancreas and left adrenal gland in a 65-year-old man. (a, b) Axial (a) and coronal (b) contrast-enhanced CT images acquired during the arterial phase show an avidly enhancing mass in the pancreatic neck (red arrow in a) resulting in upstream dilatation of the pancreatic duct (arrow in b). A large left adrenal metastasis (black arrow in a) is present. The patient was subsequently administered ipilimumab and nivolumab. (c, d) Axial (c) and coronal (d) contrast-enhanced CT images from an examination performed 3 months after the initiation of therapy show a dramatic decrease in the size and enhancement of the pancreatic (red arrow in c) and adrenal (black arrow in c) metastases. Note the associated resolution of pancreatic ductal dilatation.
Figure 5c.
Figure 5c.
Metastatic RCC involving the pancreas and left adrenal gland in a 65-year-old man. (a, b) Axial (a) and coronal (b) contrast-enhanced CT images acquired during the arterial phase show an avidly enhancing mass in the pancreatic neck (red arrow in a) resulting in upstream dilatation of the pancreatic duct (arrow in b). A large left adrenal metastasis (black arrow in a) is present. The patient was subsequently administered ipilimumab and nivolumab. (c, d) Axial (c) and coronal (d) contrast-enhanced CT images from an examination performed 3 months after the initiation of therapy show a dramatic decrease in the size and enhancement of the pancreatic (red arrow in c) and adrenal (black arrow in c) metastases. Note the associated resolution of pancreatic ductal dilatation.
Figure 5d.
Figure 5d.
Metastatic RCC involving the pancreas and left adrenal gland in a 65-year-old man. (a, b) Axial (a) and coronal (b) contrast-enhanced CT images acquired during the arterial phase show an avidly enhancing mass in the pancreatic neck (red arrow in a) resulting in upstream dilatation of the pancreatic duct (arrow in b). A large left adrenal metastasis (black arrow in a) is present. The patient was subsequently administered ipilimumab and nivolumab. (c, d) Axial (c) and coronal (d) contrast-enhanced CT images from an examination performed 3 months after the initiation of therapy show a dramatic decrease in the size and enhancement of the pancreatic (red arrow in c) and adrenal (black arrow in c) metastases. Note the associated resolution of pancreatic ductal dilatation.
Figure 6a.
Figure 6a.
Metastatic RCC and hip pain in a 63-year-old man. (a) Radiograph of the right hip shows no abnormalities. (b) 99mTc methylene diphosphonate bone scintigram shows lesions in the right humerus and the clavicle (arrows) and the right hip (dashed square). (c) Detail image of the right hip corresponding to the dashed square in b shows abnormal uptake in the right femoral head (red arrow) and a small area of increased uptake in the acetabulum (yellow arrow). (d, e) Coronal fat-saturated T2-weighted fast spin-echo MR images at the level of the femoral head (d) and the ischial tuberosity (e) show marrow edema in the femoral neck (red arrows in d) corresponding to the abnormality on the bone scan due to an insufficiency fracture. Mild degenerative changes are noted in the right acetabulum (yellow arrow in d), corresponding to the focus of uptake in the right acetabulum in c, but there is no evidence of metastasis. A metastasis in the right ischium (red arrow in e) is clearly shown on the MR images but not detected on the bone scintigram (black arrow in c).
Figure 6b.
Figure 6b.
Metastatic RCC and hip pain in a 63-year-old man. (a) Radiograph of the right hip shows no abnormalities. (b) 99mTc methylene diphosphonate bone scintigram shows lesions in the right humerus and the clavicle (arrows) and the right hip (dashed square). (c) Detail image of the right hip corresponding to the dashed square in b shows abnormal uptake in the right femoral head (red arrow) and a small area of increased uptake in the acetabulum (yellow arrow). (d, e) Coronal fat-saturated T2-weighted fast spin-echo MR images at the level of the femoral head (d) and the ischial tuberosity (e) show marrow edema in the femoral neck (red arrows in d) corresponding to the abnormality on the bone scan due to an insufficiency fracture. Mild degenerative changes are noted in the right acetabulum (yellow arrow in d), corresponding to the focus of uptake in the right acetabulum in c, but there is no evidence of metastasis. A metastasis in the right ischium (red arrow in e) is clearly shown on the MR images but not detected on the bone scintigram (black arrow in c).
Figure 6c.
Figure 6c.
Metastatic RCC and hip pain in a 63-year-old man. (a) Radiograph of the right hip shows no abnormalities. (b) 99mTc methylene diphosphonate bone scintigram shows lesions in the right humerus and the clavicle (arrows) and the right hip (dashed square). (c) Detail image of the right hip corresponding to the dashed square in b shows abnormal uptake in the right femoral head (red arrow) and a small area of increased uptake in the acetabulum (yellow arrow). (d, e) Coronal fat-saturated T2-weighted fast spin-echo MR images at the level of the femoral head (d) and the ischial tuberosity (e) show marrow edema in the femoral neck (red arrows in d) corresponding to the abnormality on the bone scan due to an insufficiency fracture. Mild degenerative changes are noted in the right acetabulum (yellow arrow in d), corresponding to the focus of uptake in the right acetabulum in c, but there is no evidence of metastasis. A metastasis in the right ischium (red arrow in e) is clearly shown on the MR images but not detected on the bone scintigram (black arrow in c).
Figure 6d.
Figure 6d.
Metastatic RCC and hip pain in a 63-year-old man. (a) Radiograph of the right hip shows no abnormalities. (b) 99mTc methylene diphosphonate bone scintigram shows lesions in the right humerus and the clavicle (arrows) and the right hip (dashed square). (c) Detail image of the right hip corresponding to the dashed square in b shows abnormal uptake in the right femoral head (red arrow) and a small area of increased uptake in the acetabulum (yellow arrow). (d, e) Coronal fat-saturated T2-weighted fast spin-echo MR images at the level of the femoral head (d) and the ischial tuberosity (e) show marrow edema in the femoral neck (red arrows in d) corresponding to the abnormality on the bone scan due to an insufficiency fracture. Mild degenerative changes are noted in the right acetabulum (yellow arrow in d), corresponding to the focus of uptake in the right acetabulum in c, but there is no evidence of metastasis. A metastasis in the right ischium (red arrow in e) is clearly shown on the MR images but not detected on the bone scintigram (black arrow in c).
Figure 6e.
Figure 6e.
Metastatic RCC and hip pain in a 63-year-old man. (a) Radiograph of the right hip shows no abnormalities. (b) 99mTc methylene diphosphonate bone scintigram shows lesions in the right humerus and the clavicle (arrows) and the right hip (dashed square). (c) Detail image of the right hip corresponding to the dashed square in b shows abnormal uptake in the right femoral head (red arrow) and a small area of increased uptake in the acetabulum (yellow arrow). (d, e) Coronal fat-saturated T2-weighted fast spin-echo MR images at the level of the femoral head (d) and the ischial tuberosity (e) show marrow edema in the femoral neck (red arrows in d) corresponding to the abnormality on the bone scan due to an insufficiency fracture. Mild degenerative changes are noted in the right acetabulum (yellow arrow in d), corresponding to the focus of uptake in the right acetabulum in c, but there is no evidence of metastasis. A metastasis in the right ischium (red arrow in e) is clearly shown on the MR images but not detected on the bone scintigram (black arrow in c).
Figure 7a.
Figure 7a.
Metastatic clear cell RCC in a 53-year-old man undergoing therapy with nivolumab with oligoprogression. (a, b) Axial contrast-enhanced CT images through the lower chest and upper abdomen before the initiation of nivolumab show several extrapleural metastases in the right hemithorax (arrow). The patient subsequently received nivolumab. (c, d) Axial contrast-enhanced MR images acquired 6 months after therapy show that most of the lesions decreased in size substantially (arrow in d), but one of the metastases had enlarged (arrow in c). Another extrapleural metastasis had resolved (not shown). (e) Axial contrast-enhanced MR image from an examination after radiation therapy was performed for the enlarging lesion shows a decrease in size and enhancement of the right chest wall lesion (arrow). The patient continued to take nivolumab for an additional 6 months.
Figure 7b.
Figure 7b.
Metastatic clear cell RCC in a 53-year-old man undergoing therapy with nivolumab with oligoprogression. (a, b) Axial contrast-enhanced CT images through the lower chest and upper abdomen before the initiation of nivolumab show several extrapleural metastases in the right hemithorax (arrow). The patient subsequently received nivolumab. (c, d) Axial contrast-enhanced MR images acquired 6 months after therapy show that most of the lesions decreased in size substantially (arrow in d), but one of the metastases had enlarged (arrow in c). Another extrapleural metastasis had resolved (not shown). (e) Axial contrast-enhanced MR image from an examination after radiation therapy was performed for the enlarging lesion shows a decrease in size and enhancement of the right chest wall lesion (arrow). The patient continued to take nivolumab for an additional 6 months.
Figure 7c.
Figure 7c.
Metastatic clear cell RCC in a 53-year-old man undergoing therapy with nivolumab with oligoprogression. (a, b) Axial contrast-enhanced CT images through the lower chest and upper abdomen before the initiation of nivolumab show several extrapleural metastases in the right hemithorax (arrow). The patient subsequently received nivolumab. (c, d) Axial contrast-enhanced MR images acquired 6 months after therapy show that most of the lesions decreased in size substantially (arrow in d), but one of the metastases had enlarged (arrow in c). Another extrapleural metastasis had resolved (not shown). (e) Axial contrast-enhanced MR image from an examination after radiation therapy was performed for the enlarging lesion shows a decrease in size and enhancement of the right chest wall lesion (arrow). The patient continued to take nivolumab for an additional 6 months.
Figure 7d.
Figure 7d.
Metastatic clear cell RCC in a 53-year-old man undergoing therapy with nivolumab with oligoprogression. (a, b) Axial contrast-enhanced CT images through the lower chest and upper abdomen before the initiation of nivolumab show several extrapleural metastases in the right hemithorax (arrow). The patient subsequently received nivolumab. (c, d) Axial contrast-enhanced MR images acquired 6 months after therapy show that most of the lesions decreased in size substantially (arrow in d), but one of the metastases had enlarged (arrow in c). Another extrapleural metastasis had resolved (not shown). (e) Axial contrast-enhanced MR image from an examination after radiation therapy was performed for the enlarging lesion shows a decrease in size and enhancement of the right chest wall lesion (arrow). The patient continued to take nivolumab for an additional 6 months.
Figure 7e.
Figure 7e.
Metastatic clear cell RCC in a 53-year-old man undergoing therapy with nivolumab with oligoprogression. (a, b) Axial contrast-enhanced CT images through the lower chest and upper abdomen before the initiation of nivolumab show several extrapleural metastases in the right hemithorax (arrow). The patient subsequently received nivolumab. (c, d) Axial contrast-enhanced MR images acquired 6 months after therapy show that most of the lesions decreased in size substantially (arrow in d), but one of the metastases had enlarged (arrow in c). Another extrapleural metastasis had resolved (not shown). (e) Axial contrast-enhanced MR image from an examination after radiation therapy was performed for the enlarging lesion shows a decrease in size and enhancement of the right chest wall lesion (arrow). The patient continued to take nivolumab for an additional 6 months.
Figure 8a.
Figure 8a.
Decrease in enhancement and iodine concentration in a hepatic metastasis of RCC in a 58-year-old woman after treatment with a tyrosine kinase inhibitor. (a) Baseline contrast-enhanced CT image of the upper abdomen obtained during the early arterial phase shows an avidly enhancing lesion in the right hepatic lobe (arrow), which is compatible with an RCC metastasis. (b) Contrast-enhanced CT image acquired after the initiation of pazopanib shows a decrease in enhancement in the hepatic lesion without a substantial change in size (arrow). (c, d) Iodine maps obtained before (c) and after (d) therapy show a corresponding decrease in iodine concentration (arrow).
Figure 8b.
Figure 8b.
Decrease in enhancement and iodine concentration in a hepatic metastasis of RCC in a 58-year-old woman after treatment with a tyrosine kinase inhibitor. (a) Baseline contrast-enhanced CT image of the upper abdomen obtained during the early arterial phase shows an avidly enhancing lesion in the right hepatic lobe (arrow), which is compatible with an RCC metastasis. (b) Contrast-enhanced CT image acquired after the initiation of pazopanib shows a decrease in enhancement in the hepatic lesion without a substantial change in size (arrow). (c, d) Iodine maps obtained before (c) and after (d) therapy show a corresponding decrease in iodine concentration (arrow).
Figure 8c.
Figure 8c.
Decrease in enhancement and iodine concentration in a hepatic metastasis of RCC in a 58-year-old woman after treatment with a tyrosine kinase inhibitor. (a) Baseline contrast-enhanced CT image of the upper abdomen obtained during the early arterial phase shows an avidly enhancing lesion in the right hepatic lobe (arrow), which is compatible with an RCC metastasis. (b) Contrast-enhanced CT image acquired after the initiation of pazopanib shows a decrease in enhancement in the hepatic lesion without a substantial change in size (arrow). (c, d) Iodine maps obtained before (c) and after (d) therapy show a corresponding decrease in iodine concentration (arrow).
Figure 8d.
Figure 8d.
Decrease in enhancement and iodine concentration in a hepatic metastasis of RCC in a 58-year-old woman after treatment with a tyrosine kinase inhibitor. (a) Baseline contrast-enhanced CT image of the upper abdomen obtained during the early arterial phase shows an avidly enhancing lesion in the right hepatic lobe (arrow), which is compatible with an RCC metastasis. (b) Contrast-enhanced CT image acquired after the initiation of pazopanib shows a decrease in enhancement in the hepatic lesion without a substantial change in size (arrow). (c, d) Iodine maps obtained before (c) and after (d) therapy show a corresponding decrease in iodine concentration (arrow).
Figure 9a.
Figure 9a.
Pseudoprogression after initiation of nivolumab in a 69-year-old man with metastatic clear cell RCC. (a) Baseline axial CT image of the chest shows several right pulmonary metastases (arrows), which had enlarged when compared with prior images (not shown). (b) Axial CT image from a follow-up examination 1 month after treatment with nivolumab shows continued enlargement of the pulmonary metastases (arrows). Images of the abdomen at that time also showed new hepatic and pancreatic metastases (not shown). Given these findings and poor performance status, the patient decided to forego further treatment and pursue hospice care. After 6 months, the patient returned to clinical care with substantially improved performance status. (c) Axial CT image obtained at that time shows substantial improvement in pulmonary disease. Several of the pulmonary metastases previously visualized in the right middle and lower lobes are no longer seen. The hepatic and pancreatic metastases had decreased substantially in size (not shown). The rapid enlargement on the initial follow-up image in b is in keeping with pseudoprogression, which is the result of a transient inflammatory infiltration to the tumor by immune cells and a part of the pathophysiology of response for immune checkpoint inhibitors.
Figure 9b.
Figure 9b.
Pseudoprogression after initiation of nivolumab in a 69-year-old man with metastatic clear cell RCC. (a) Baseline axial CT image of the chest shows several right pulmonary metastases (arrows), which had enlarged when compared with prior images (not shown). (b) Axial CT image from a follow-up examination 1 month after treatment with nivolumab shows continued enlargement of the pulmonary metastases (arrows). Images of the abdomen at that time also showed new hepatic and pancreatic metastases (not shown). Given these findings and poor performance status, the patient decided to forego further treatment and pursue hospice care. After 6 months, the patient returned to clinical care with substantially improved performance status. (c) Axial CT image obtained at that time shows substantial improvement in pulmonary disease. Several of the pulmonary metastases previously visualized in the right middle and lower lobes are no longer seen. The hepatic and pancreatic metastases had decreased substantially in size (not shown). The rapid enlargement on the initial follow-up image in b is in keeping with pseudoprogression, which is the result of a transient inflammatory infiltration to the tumor by immune cells and a part of the pathophysiology of response for immune checkpoint inhibitors.
Figure 9c.
Figure 9c.
Pseudoprogression after initiation of nivolumab in a 69-year-old man with metastatic clear cell RCC. (a) Baseline axial CT image of the chest shows several right pulmonary metastases (arrows), which had enlarged when compared with prior images (not shown). (b) Axial CT image from a follow-up examination 1 month after treatment with nivolumab shows continued enlargement of the pulmonary metastases (arrows). Images of the abdomen at that time also showed new hepatic and pancreatic metastases (not shown). Given these findings and poor performance status, the patient decided to forego further treatment and pursue hospice care. After 6 months, the patient returned to clinical care with substantially improved performance status. (c) Axial CT image obtained at that time shows substantial improvement in pulmonary disease. Several of the pulmonary metastases previously visualized in the right middle and lower lobes are no longer seen. The hepatic and pancreatic metastases had decreased substantially in size (not shown). The rapid enlargement on the initial follow-up image in b is in keeping with pseudoprogression, which is the result of a transient inflammatory infiltration to the tumor by immune cells and a part of the pathophysiology of response for immune checkpoint inhibitors.
Figure 10a.
Figure 10a.
Metastatic clear cell RCC with enteritis in a 55-year-old woman who underwent checkpoint inhibition therapy. The patient developed abdominal pain and high-grade diarrhea after completion of a second cycle of combination therapy with ipilimumab and nivolumab. Coronal reconstructions of a nonenhanced CT examination reveal dilatation of proximal small bowel loops filled with oral contrast material (*), with fluid-filled nondistended loops of the distal small bowel (white arrow). Note the fluid-filled cecum (yellow arrow in b) in the right lower quadrant. Small-bowel biopsy results confirmed findings consistent with immunomodulatory enteritis.
Figure 10b.
Figure 10b.
Metastatic clear cell RCC with enteritis in a 55-year-old woman who underwent checkpoint inhibition therapy. The patient developed abdominal pain and high-grade diarrhea after completion of a second cycle of combination therapy with ipilimumab and nivolumab. Coronal reconstructions of a nonenhanced CT examination reveal dilatation of proximal small bowel loops filled with oral contrast material (*), with fluid-filled nondistended loops of the distal small bowel (white arrow). Note the fluid-filled cecum (yellow arrow in b) in the right lower quadrant. Small-bowel biopsy results confirmed findings consistent with immunomodulatory enteritis.
Figure 11a.
Figure 11a.
Pneumonitis associated with nivolumab therapy in a 61-year-old woman with metastatic clear cell RCC. The patient presented in the emergency department with shortness of breath 1 month after the initiation of nivolumab therapy. (a) Axial CT image of the chest shows patchy peribronchovascular consolidation, which is most pronounced in the right lower and middle lobes (red arrows). The nivolumab therapy subsequently was stopped, and the patient was given corticosteroids. Black arrow = right middle lobe metastasis. (b) Axial CT image of the chest obtained 1 month later shows near-complete resolution of consolidation. Arrow = right middle lobe metastasis.
Figure 11b.
Figure 11b.
Pneumonitis associated with nivolumab therapy in a 61-year-old woman with metastatic clear cell RCC. The patient presented in the emergency department with shortness of breath 1 month after the initiation of nivolumab therapy. (a) Axial CT image of the chest shows patchy peribronchovascular consolidation, which is most pronounced in the right lower and middle lobes (red arrows). The nivolumab therapy subsequently was stopped, and the patient was given corticosteroids. Black arrow = right middle lobe metastasis. (b) Axial CT image of the chest obtained 1 month later shows near-complete resolution of consolidation. Arrow = right middle lobe metastasis.

Similar articles

Cited by

References

    1. Amin MB, Amin MB, Tamboli P, et al. . Prognostic impact of histologic subtyping of adult renal epithelial neoplasms: an experience of 405 cases. Am J Surg Pathol 2002;26(3):281–291. - PubMed
    1. Patard JJ, Leray E, Rioux-Leclercq N, et al. . Prognostic value of histologic subtypes in renal cell carcinoma: a multicenter experience. J Clin Oncol 2005;23(12):2763–2771. - PubMed
    1. Siegel RL, Miller KD, Jemal A. Cancer statistics, 2016. CA Cancer J Clin 2016;66(1):7–30. - PubMed
    1. Noone AMHN, Krapcho M, Miller D, et al. . SEER cancer statistics review, 1975-2015. Bethesda, Md: National Cancer Institute. https://seer.cancer.gov/csr/1975_2015/. Accessed April 20, 2018.
    1. Ross H, Martignoni G, Argani P. Renal cell carcinoma with clear cell and papillary features. Arch Pathol Lab Med 2012;136(4):391–399. - PubMed

MeSH terms

Substances