. 2019 Jun 14;15(6):e1008213.
doi: 10.1371/journal.pgen.1008213. eCollection 2019 Jun.

The gene regulatory basis of genetic compensation during neural crest induction

Affiliations

The gene regulatory basis of genetic compensation during neural crest induction

Christopher M Dooley et al. PLoS Genet. .

Abstract

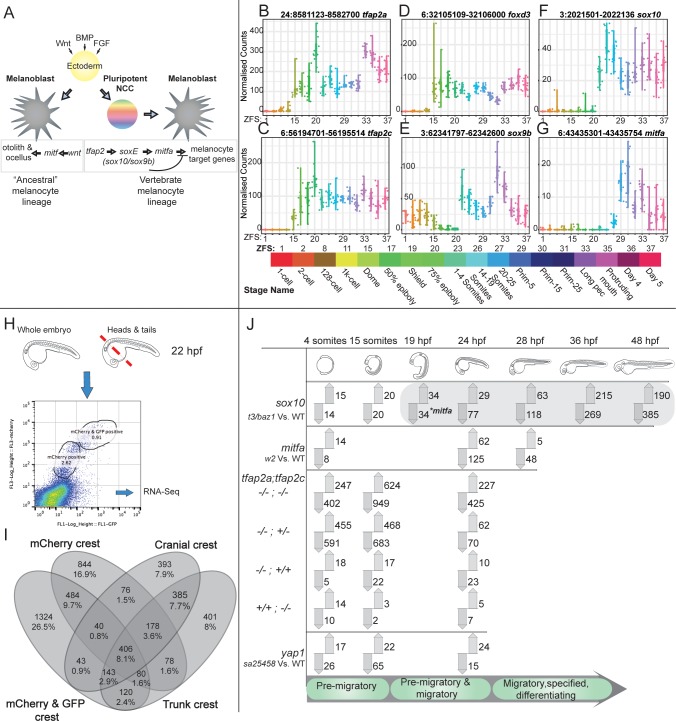
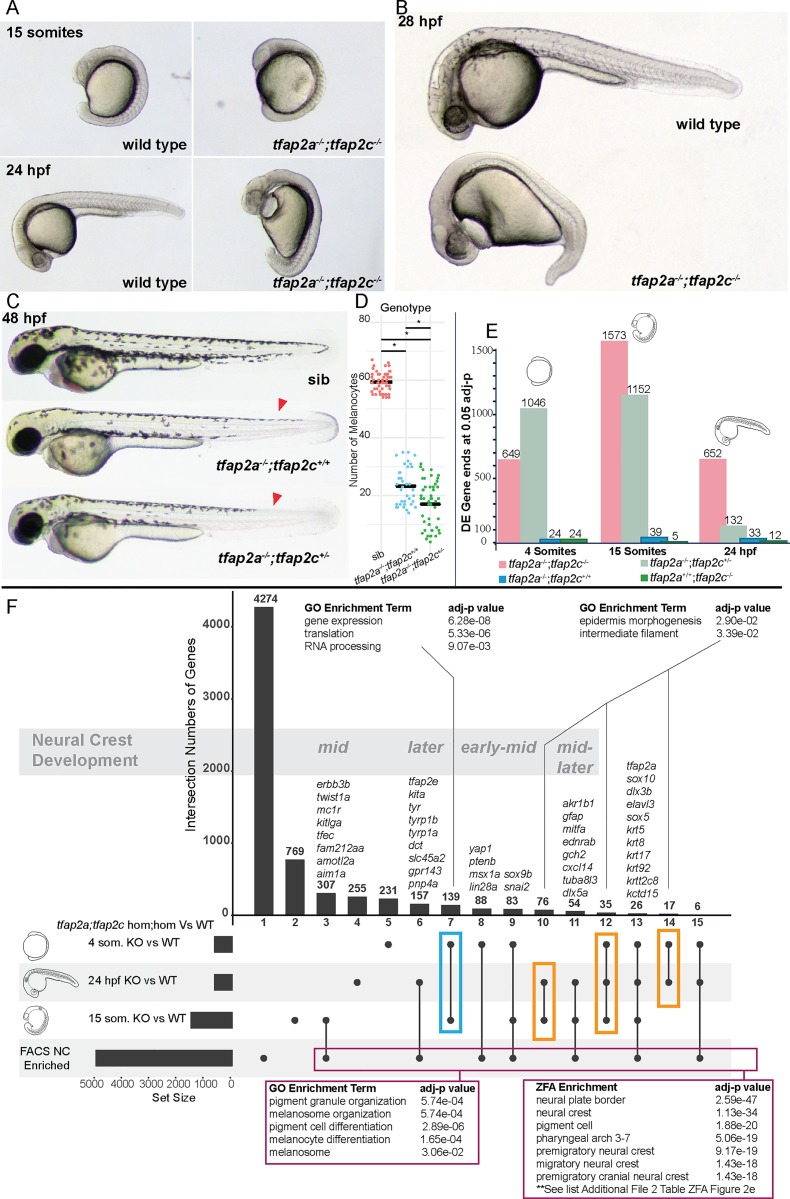
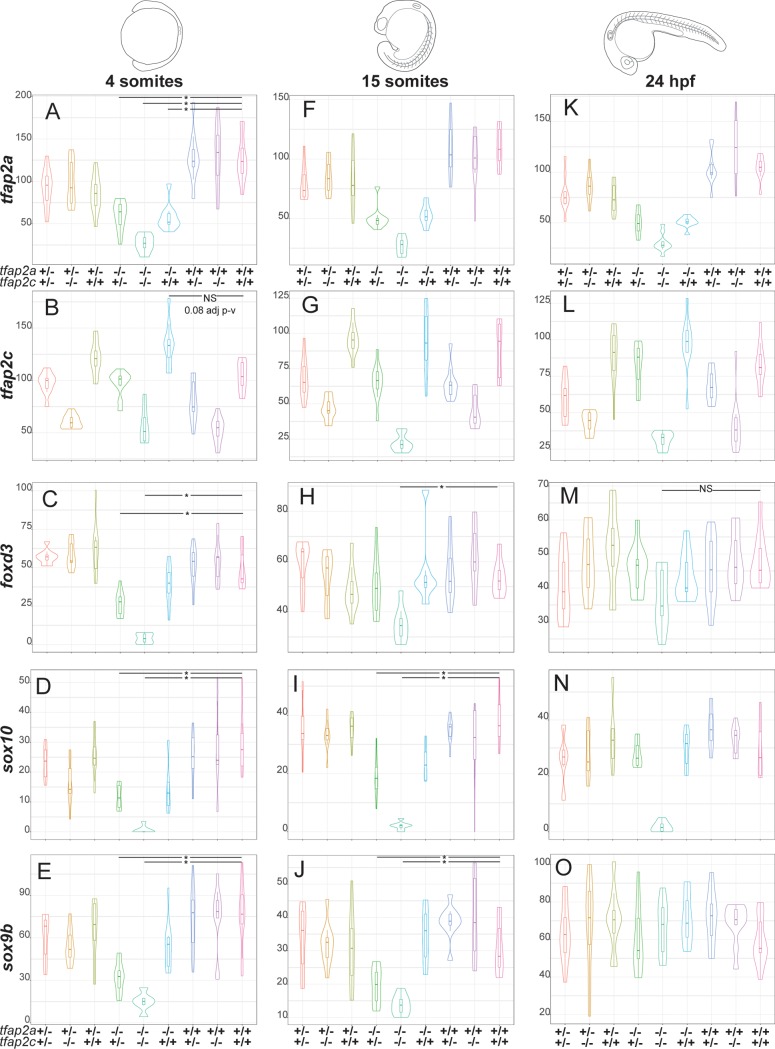
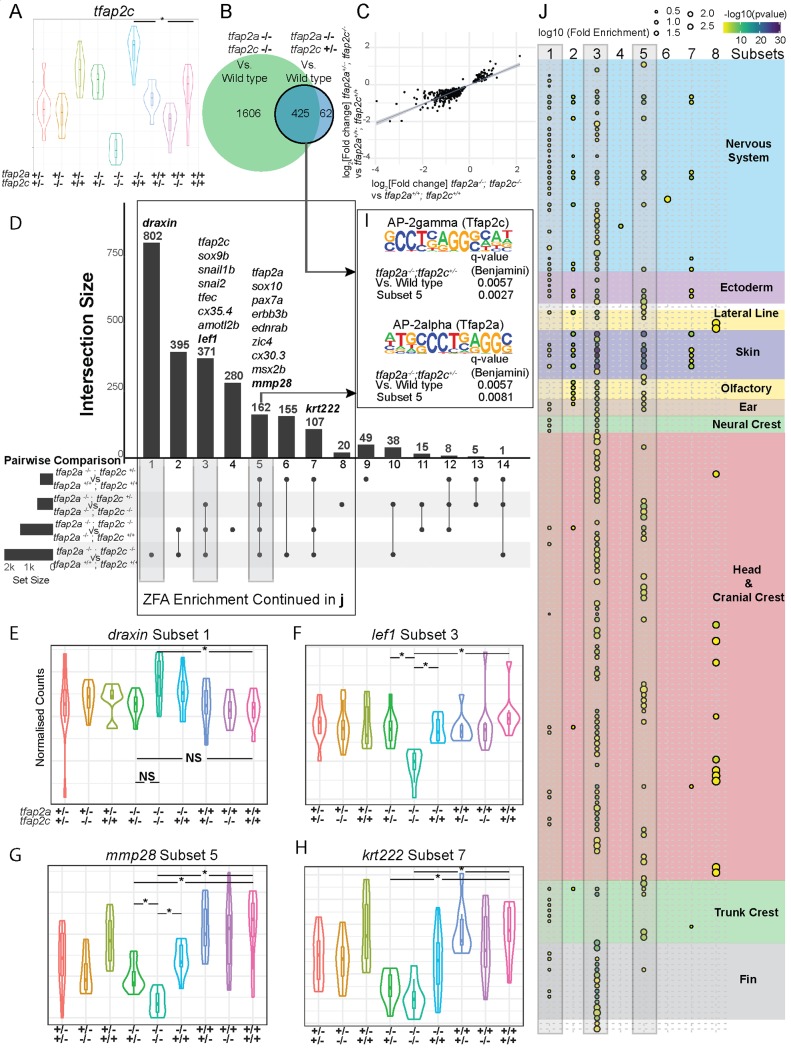
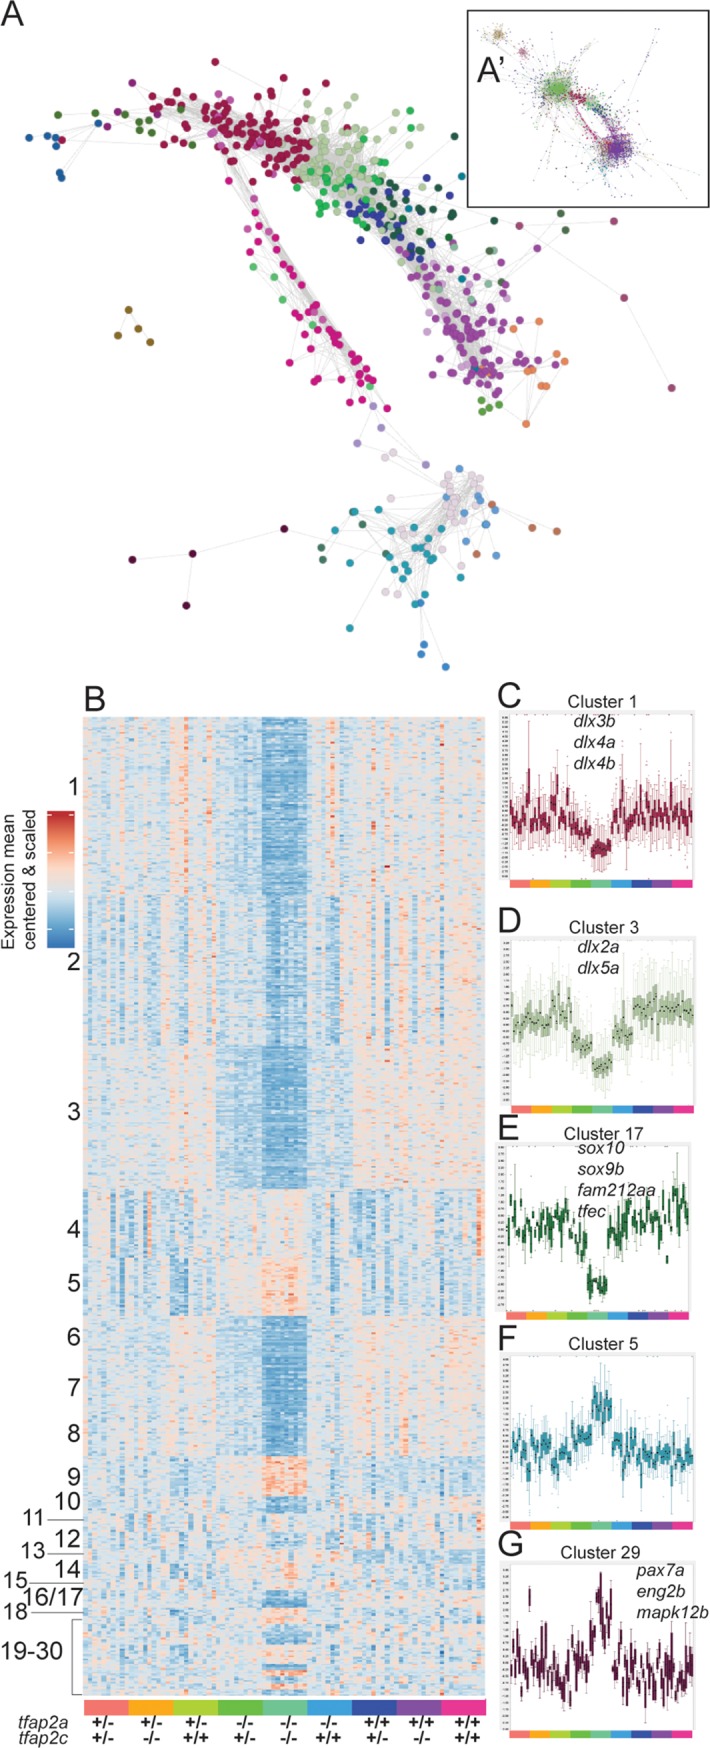
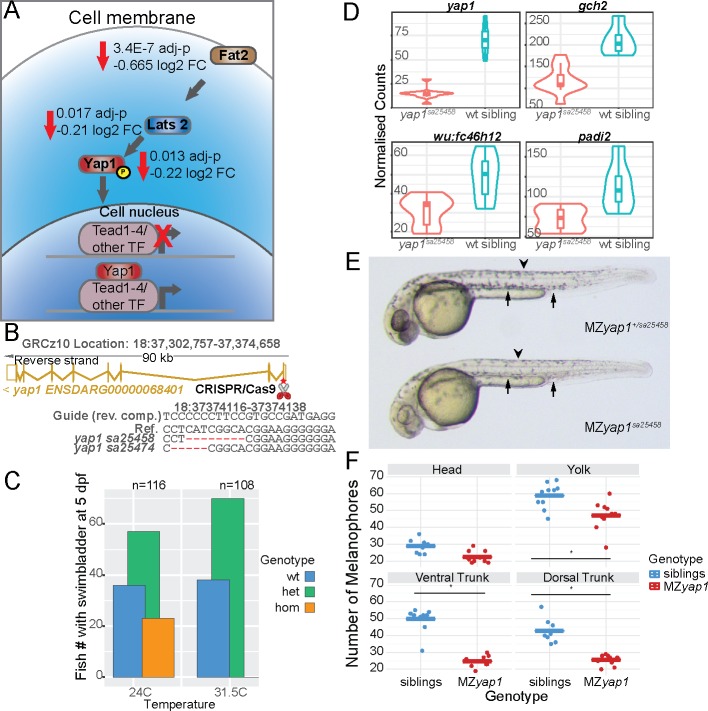
The neural crest (NC) is a vertebrate-specific cell type that contributes to a wide range of different tissues across all three germ layers. The gene regulatory network (GRN) responsible for the formation of neural crest is conserved across vertebrates. Central to the induction of the NC GRN are AP-2 and SoxE transcription factors. NC induction robustness is ensured through the ability of some of these transcription factors to compensate loss of function of gene family members. However the gene regulatory events underlying compensation are poorly understood. We have used gene knockout and RNA sequencing strategies to dissect NC induction and compensation in zebrafish. We genetically ablate the NC using double mutants of tfap2a;tfap2c or remove specific subsets of the NC with sox10 and mitfa knockouts and characterise genome-wide gene expression levels across multiple time points. We find that compensation through a single wild-type allele of tfap2c is capable of maintaining early NC induction and differentiation in the absence of tfap2a function, but many target genes have abnormal expression levels and therefore show sensitivity to the reduced tfap2 dosage. This separation of morphological and molecular phenotypes identifies a core set of genes required for early NC development. We also identify the 15 somites stage as the peak of the molecular phenotype which strongly diminishes at 24 hpf even as the morphological phenotype becomes more apparent. Using gene knockouts, we associate previously uncharacterised genes with pigment cell development and establish a role for maternal Hippo signalling in melanocyte differentiation. This work extends and refines the NC GRN while also uncovering the transcriptional basis of genetic compensation via paralogues.


Conflict of interest statement

The authors have declared that no competing interests exist.

Figures

Fig 1
Fig 1. Analysis of the zebrafish NC GRN using gene expression data, knockouts and tissue-specific sequencing.
(A) The NC is induced by different morphogens, for example Wnt, BMP and FGF acting on ectoderm. Non-vertebrate chordates lack NC cells but are capable of producing pigmented cells and otoliths via mitf. AP-2 and SoxE family genes are required in vertebrates to form the NC and these also contribute to the differentiation of specific NC tissues types. (B-G) 3’ end transcriptome sequencing (DeTCT) of six key neural crest transcription factors (tfap2a, tfap2c, foxd3, sox9b, sox10, mitfa) across 18 developmental time points covering zygote to 5 dpf. Normalised counts of individual embryos (dots) are plotted for each stage. The mapped GRCz10 genomic positions of each 3’ end are at the top of the plots next to the gene names. ZFS numbers are labelled with their corresponding stage names and representative colouring. (H) FACS of dissociated sox10:mg was sorted based on mCherry and GFP signals at 22–23 hpf and were either sorted as whole embryos or separated heads and tails. Multiple replicates of each cell population were harvested and sequenced via RNA-seq. (I) FACS transgenic populations were compared to non-transgenic populations using DESeq2 to produce gene enrichment lists for each population. The enriched gene lists for the mCherry and mCherry/GFP population from whole embryos and mCherry and/or GFP positive populations from the head or trunk were then compared to each other as a Venn diagram. (J) An overview of the transcriptomics loss of function analysis comparing mutants to WT siblings, using 3’ tag sequencing, carried out at stages of premigratory, migratory and differentiating neural crest cells. The phases of NC differentiation are noted at the bottom. Differentially expressed genes at adj. p-value <0.05 when compared to wild-type siblings are represented with up and down arrows for increased and decreased abundance, respectively. The sox10 downstream target mitfa (*) is first detected as reduced (adj. p-value 0.019, log2 FC -1.775) at 19 hpf.
Fig 2
Fig 2. Molecular profiling of tfap2a;tfap2c mutants across multiple time points using 3’ tag sequencing.
(A) tfap2a-/-;tfap2c-/- mutants present the first morphological phenotypes at the 15 somite stage. (B) By 28 hpf the morphological phenotype leads to an overall dorsalised form, bifurcation of the forming eye, heart oedema, and complete lack of neural crest cells. All other genotypes appear normal. (C) At 48 hpf the previously described reduction of melanocytes can be noted in tfap2a-/-;tfap2c+/+ embryos and a modest reduction of melanocytes can be identified in the dorsal tail (red arrow heads) in tfap2a-/-;tfap2c+/- mutants. (D) Quantification of melanocytes in the three corresponding genotypes at 36 hpf. (E) Chart indicating the number of differentially expressed gene 3’ ends identified with an adjusted p-value of <0.05 for each pairwise comparison of genotypes tfap2a-/-;tfap2c-/-, tfap2a-/-;tfap2c+/-, tfap2a-/-;tfap2c+/+ and tfap2a+/+;tfap2c-/- to tfap2a+/+;tfap2c+/+ siblings at 4 somites, 15 somites and 24 hpf (F) An UpSet[53] diagram to compare multiple pairwise DE gene lists derived from the tfap2a-/-;tfap2c-/- vs wild-type siblings (adj. p-value <0.05) for the 4 somite, 15 somite and 24 hpf stages and the list of neural crest-enriched genes derived from sorted neural crest cells at 22–23 hpf. The horizontal black bars represent the size of the gene lists. Individual subsets are marked with a black dot and overlaps with a connecting line. The number of genes in each subset is shown above each vertical bar. The vertical bars are numbered consecutively along the x-axis. GO/ZFA enrichment was carried out on the subset of the 4 and 15 somite stages (blue box), the subsets indicated with the orange boxes and on all genes contained in the neural crest FACS enrichment and in at least one of the three different double knockout time points (magenta box). The developmental time course nature of the data allows for the grouping of the subsets into timing based on neural crest development starting with early neural crest-specific gene expression and then moving towards early-mid, mid, mid-later and later. The complete list of the 26 genes in group 13 can be found in S2 Table.
Fig 3
Fig 3. Expression of sox10, sox9b and foxd3 in tfap2a;tfap2c mutants across three developmental time points.
Normalised counts and gene name to the left of the violin plots and the corresponding genotypes for tfap2a and tfap2c at the bottom. All plots are ordered by the time points shown on the top of the figure. (A) At 4 somites levels of tfap2a are significantly lower than in wild-type siblings in all tfap2a-/- genotypes. (B) Levels of tfap2c present at elevated levels in tfap2a-/-;tfap2c+/+ embryos when compared to wild-type siblings but fail the statistical cut-off (adj p-value 0.08). (C-E) Levels of foxd3, sox10 and sox9b are significantly different in both tfap2a-/-;tfap2c+/- and tfap2a-/-;tfap2c-/- embryos but not in tfap2a-/-;tfap2c+/+. (F-G) At 15 somites the levels of tfap2a and tfap2c recapitulate trends observed at 4 somite stage. (H) Levels of foxd3 are only significantly different in tfap2a-/-;tfap2c-/- embryos when compared to wild-type siblings. (I-J) The levels of sox10 and sox9b are both significantly different in tfap2a-/-;tfap2c+/- and tfap2a-/-;tfap2c-/- embryos compared to wild-type siblings. (K-L) The profiles of tfap2a and tfap2c at 24 hpf again remain similar to the two previous time points across all genetic combinations. (M) At 24 hpf the levels of foxd3 are not significantly different across any genotypes. (N) The levels of sox10 are markedly down in only the tfap2a-/-;tfap2c-/- embryos and levels of sox9b are unchanged across all genotypes (O). Statistical significance of below 0.05 adj p-value is denoted with a *. Not all significant differences have been labelled. NS is to emphasise pairwise comparisons which fail an adj. p-value <0.05 cut-off.
Fig 4
Fig 4. Identification of NC-specific gene subsets in tfap2a;tfap2c mutant RNA-seq 15 somite data.
(A) RNA-seq at 15 somites, an * indicates a significant (adj. p-value <0.05) increase of tfap2c transcript in tfap2a-/-;tfap2c+/+ embryos when compared to wild-type siblings. (B) Overlapping gene lists comparison of significantly (adj. p-value <0.05) differentially expressed genes when tfap2a-/-;tfap2c-/- and tfap2a-/-;tfap2c+/- are compared to wild-type siblings. (C) tfap2a-/-;tfap2c+/- log2[fold change] plotted against tfap2a-/-;tfap2c-/- log2[fold change] with regression curve showing a 1:2 ratio. (D) Subsetting of gene lists from four different pairwise comparisons. The subsets are labelled 1–14 and the genes from (e-h) are noted at the top of the groups they belong to. Groups 1, 3 and 5 have grey boxes around them. (E-H) Examples of violin plots for the four subset groups with “*” signifying a <0.05 adj p-value between two groups and NS indicating not significant. Genotypes of the embryo groups are listed at the bottom of each plot. (I) Enrichment for AP-2alpha (Tfap2a) and AP-2gamma (Tfap2c) binding sites in tfap2a-/-;tfap2c+/- DGE list and subset 5. (J) ZFA enrichment was carried out on all 14 subsets but only returned significant enrichment for groups 1–8. The log10[Fold Enrichment] is designated by the size of the circle and the colour represents -log10[p-value]. Grey bars correspond to the same subsets in (D). Anatomy terms have been manually organised based on the themes to the right. The actual terms have been cropped and placed in (S3 Fig ZFA Enrichment) for ease of reading.
Fig 5
Fig 5. Network analysis and Markov clustering of RNA-seq 15 somite data set.
(A) Interaction network analysis of 15 somite (0.7 Pearson correlation) RNA-seq data set represented as a subset. The entire interaction network can be found in A’. Each node represents a single gene and its colour corresponds to its cluster group. (B) A mean-centred and scaled heatmap representing 30 MCL network clusters organised by cluster size and by genotype at the bottom. (C-G) Examples of individual clusters displayed as boxplots of the values for all the genes in the cluster (mean centered and variance scaled). Samples are arranged as in (B) and are colour coded at the bottom of each cluster. Cluster number corresponds to the same cluster in (B). Some genes contained in clusters are labelled on the plot.
Fig 6
Fig 6. yap1 mutants are temperature sensitive and yap1 plays a role in melanocyte development.
(A) Transcripts of members of the Hippo signalling pathway fat2, lats2 and yap1 were less abundant in tfap2a;tfap2c mutants when compared to wild-type siblings. A schematic showing their role in signal transduction and transcription inside a cell. (B) CRISPR/Cas9 mutations were made in the first exon of yap1 leading to the two alleles described. The exon-intron structure of the yap1 transcript is shown in gold. The exact deletions are displayed below. (C) Embryos from a single clutch were split and raised at 24C and 31.5C. Bars indicate the absolute number of fish forming a swim bladder at 5 dpf for each yap1sa25458 genotype (D) Normalised counts of 3’ tag sequencing data at 24 hpf comparing yap1sa25458 mutants to wild-type siblings. All four genes, yap1, gch2, wu:fc46h12 and padi2, have an adj. p-value <0.05. (E) Maternal zygotic yap1 mutants present a strong reduction in melanocyte numbers at 36 hpf at both dorsal (arrow head) and ventral tail regions (arrow). (F) Quantification of melanocytes with the quantities on the left and then broken down into the regions of the head, yolk, ventral tail and dorsal tail. Each dot represents a region in a single larva, siblings in blue and MZyap1sa25458 in red. A statistical significance of <0.05 is indicated with “*”.

References

    1. Gans C, Northcutt RG. Neural Crest and the Origin of Vertebrates: A New Head. Science. 1983;220: 268–273. 10.1126/science.220.4594.268 - DOI - PubMed
    1. Hall BK. The neural crest and neural crest cells in vertebrate development and evolution 2nd ed. New York: Springer; 2009.
    1. Le Douarin N, Kalcheim C. The neural crest 2. ed., digitally printed version. Cambridge: Cambridge Univ. Press; 2009.
    1. Simoes-Costa M, Bronner ME. Reprogramming of avian neural crest axial identity and cell fate. Science. 2016;352: 1570–1573. 10.1126/science.aaf2729 - DOI - PMC - PubMed
    1. Lukoseviciute M, Gavriouchkina D, Williams RM, Hochgreb-Hagele T, Senanayake U, Chong-Morrison V, et al. From Pioneer to Repressor: Bimodal foxd3 Activity Dynamically Remodels Neural Crest Regulatory Landscape In Vivo. Dev Cell. 2018;47: 608–628.e6. 10.1016/j.devcel.2018.11.009 - DOI - PMC - PubMed

Publication types

MeSH terms

Substances