. 2019 Jun 14;13(6):e0007395.
doi: 10.1371/journal.pntd.0007395. eCollection 2019 Jun.

Downgrading disease transmission risk estimates using terminal importations

Affiliations

Downgrading disease transmission risk estimates using terminal importations

Spencer J Fox et al. PLoS Negl Trop Dis. .

Abstract

As emerging and re-emerging infectious arboviruses like dengue, chikungunya, and Zika threaten new populations worldwide, officials scramble to assess local severity and transmissibility, with little to no epidemiological history to draw upon. Indirect estimates of risk from vector habitat suitability maps are prone to great uncertainty, while direct estimates from epidemiological data are only possible after cases accumulate and, given environmental constraints on arbovirus transmission, cannot be widely generalized beyond the focal region. Combining these complementary methods, we use disease importation and transmission data to improve the accuracy and precision of a priori ecological risk estimates. We demonstrate this approach by estimating the spatiotemporal risks of Zika virus transmission throughout Texas, a high-risk region in the southern United States. Our estimates are, on average, 80% lower than published ecological estimates-with only six of 254 Texas counties deemed capable of sustaining a Zika epidemic-and they are consistent with the number of autochthonous cases detected in 2017. Importantly our method provides a framework for model comparison, as our mechanistic understanding of arbovirus transmission continues to improve. Real-time updating of prior risk estimates as importations and outbreaks arise can thereby provide critical, early insight into local transmission risks as emerging arboviruses expand their global reach.


Conflict of interest statement

The authors have declared that no competing interests exist.

Figures

Fig 1
Fig 1. Texas importations and baseline transmission risk estimates for 2016-17.
(A) Initial ZIKV R0 estimates using ecological risk models parameterized with actual 2016-2017 temperatures. Each solid line shows median values for one of Texas’ 254 counties. Dashed line shows the highest upper bound (99th percentile) across all counties. Horizontal dotted red line illustrates the threshold for county-month epidemic risk (R0 = 1). (B) Daily ZIKV importations into Texas. Blue arrows indicate importations that produced detected autochthonous transmission; shading indicates training (2016) and testing (2017) periods.
Fig 2
Fig 2. Posterior median county R0 estimates for Texas, based on ZIKV importations through January 2017.
This assumes that all importations were terminal except for two autochthonous cases detected in Cameron County in late 2016.
Fig 3
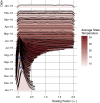
Fig 3. Evolving posterior distribution of statewide scaling factor for R0.
Zika importations, both with and without subsequent detected autochthonous transmission, provide insight into local transmission potential, via a statewide scaling factor, α. This shows the posterior distributions of α, for each day of 2016 that had at least one imported case. Median estimates reach a minimum in early November, just before the detected autochthonous transmission events (upside-down blue triangles). Red shading indicates the average statewide monthly temperature. Note: the scaling factor is never less than zero.
Fig 4
Fig 4. Expected autochthonous cases in 2017, assuming revised county R0 estimates through September 2017.
The probability distributions are built from 10,000 simulations, each randomly drawing from the R0 posterior distributions. The dashed blue line indicates the actual number of detected autochthonous cases in state (one), and the solid black lines indicates the mean expected number of autochthonous cases for the baseline importation scenario, in which only the reported importations occurred (top) and the increased importation scenario, in which a large fraction of importations went undetected (bottom).

Similar articles

Cited by

References

    1. Grills A, Morrison S, Nelson B, Miniota J, Watts A, Cetron MS. Projected Zika Virus Importation and Subsequent Ongoing Transmission after Travel to the 2016 Olympic and Paralympic Games—Country-Specific Assessment, July 2016. MMWR Morb Mortal Wkly Rep. 2016;65(28):711–715. 10.15585/mmwr.mm6528e1 - DOI - PubMed
    1. Ali S, Gugliemini O, Harber S, Harrison A, Houle L, Ivory J, et al. Environmental and Social Change Drive the Explosive Emergence of Zika Virus in the Americas. PLOS Neglected Tropical Diseases. 2017;11(2):1–16. 10.1371/journal.pntd.0005135 - DOI - PMC - PubMed
    1. Reiter P, Lathrop S, Bunning M, Biggerstaff B, Singer D, Tiwari T, et al. Texas lifestyle limits transmission of dengue virus. Emerg Infect Dis. 2003;9(1):86–89. 10.3201/eid0901.020220 - DOI - PMC - PubMed
    1. Castro LA, Fox SJ, Chen X, Liu K, Bellan SE, Dimitrov NB, et al. Assessing real-time Zika risk in the United States. BMC Infect Dis. 2017;17(1):284 10.1186/s12879-017-2394-9 - DOI - PMC - PubMed
    1. Carlson CJ, Dougherty ER, Getz W. An Ecological Assessment of the Pandemic Threat of Zika Virus. PLoS Negl Trop Dis. 2016;10(8):e0004968 10.1371/journal.pntd.0004968 - DOI - PMC - PubMed

Publication types