Clinical Trial
. 2019 Jun 14;14(6):e0218131.
doi: 10.1371/journal.pone.0218131. eCollection 2019.

Should transcutaneous bilirubin be measured in preterm infants receiving phototherapy? The relationship between transcutaneous and total serum bilirubin in preterm infants with and without phototherapy

Affiliations
Clinical Trial

Should transcutaneous bilirubin be measured in preterm infants receiving phototherapy? The relationship between transcutaneous and total serum bilirubin in preterm infants with and without phototherapy

Christian V Hulzebos et al. PLoS One. .

Abstract

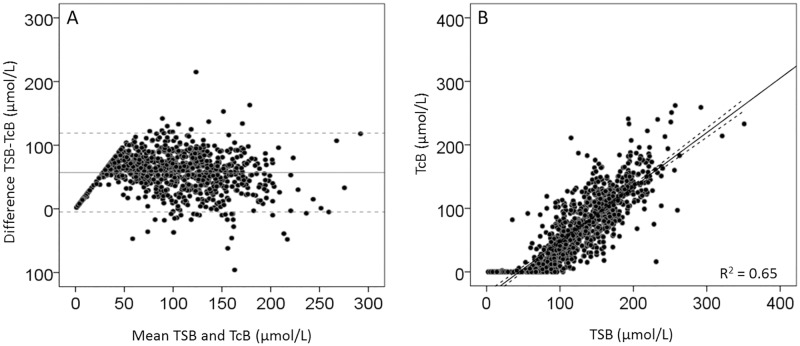
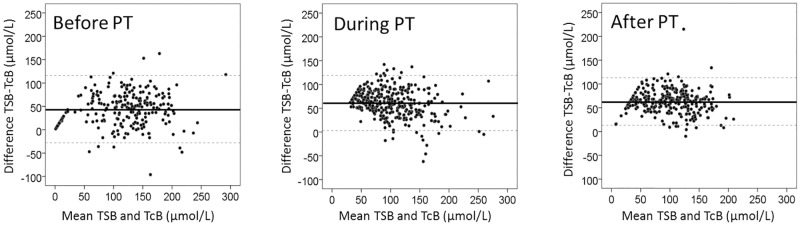
Our objective was to analyze the relationship between transcutaneous bilirubin (TcB) measured on an unexposed area of skin and total serum bilirubin (TSB) in preterm infants before, during, and after phototherapy (PT). For this purpose paired TSB and TcB levels were measured daily during the first ten days after birth in preterm infants of less than 32 weeks' gestation. TcB was measured with a Dräger Jaundice Meter JM-103 on the covered hipbone. Agreement between TSB and TcB levels was assessed before, during, and after PT. True negative and corresponding false negative percentages were calculated using different TcB cut-off levels. Data are presented as mean (±SD). We obtained 856 paired TcB and TSB levels in 109 preterm infants (66 boys, gestational age 29.4 ± 1.6 weeks and birth weight 1282 g ± 316 g). We found that the difference between TSB and TcB before PT was significantly lower, 44 (±36) μmol/L, than the difference during and after PT, 61 (±29) μmol/L and 63 (±25) μmol/L, respectively; P < 0.01. Blood sampling could be reduced by 42%, with 2% false negatives, when 50 μmol/L was added to the TcB level at 70% of the PT threshold. Our conclusion is that phototherapy enhances underestimation of TSB by TcB in preterms, even if measured on unexposed skin. The use of specific TcB cut-off levels substantially reduces the need for TSB measurements.


Conflict of interest statement

The authors have declared that no competing interests exist.

Figures

Fig 1
Fig 1. Bland Altman and correlation plots for all TcB and TSB measurements.
Fig 1A shows the agreement between TSB and TcB and Fig 1B shows the correlation between TSB and TcB. The x–axis of Fig 1A shows the mean of TSB and TcB in μmol/L and the y–axis shows the difference between TSB and TcB (μmol/L). The horizontal line in Fig 1A represents the mean difference: 57 μmol/L, the dotted lines represent the 95% confidence intervals:—5 to 119 μmol/L. 17.1μmol/L = 1 mg/dL bilirubin.
Fig 2
Fig 2. Bland Altman plots before, during, and after phototherapy.
The agreement between TSB and TcB before, during, and after PT. The x–axis shows the mean of TSB and TcB (μmol/L) and the y–axis shows the difference between TSB and TcB (μmol/L). The horizontal line represents the mean difference; the dotted lines represent the 95% confidence interval. 17.1μmol/L = 1 mg/dL bilirubin.
Fig 3
Fig 3. Birth weight categories and the mean difference between TSB and TcB.
The y–axis displays the mean difference between TSB and TcB in μmol/L. TSB, total serum bilirubin in μmol/L; TcB, transcutaneous bilirubin in μmol/L; 17.1μmol/L = 1 mg/dL bilirubin. The median is marked by the horizontal line in the central box. The boxes are limited by the 25th and 75th percentiles. The whiskers (┴) represent the minimum and maximum TSB and TcB levels. Outliers (○) and extremes (star symbol) are depicted separately. The dashed line is the line at origin.
Fig 4
Fig 4. Gestational age categories and the mean difference between TSB and TcB.
The y–axis displays the mean difference between TSB and TcB in μmol/L. TSB, total serum bilirubin in μmol/L; TcB, transcutaneous bilirubin in μmol/L; 17.1μmol/L = 1 mg/dL bilirubin. The median is marked by the horizontal line in the central box. The boxes are limited by the 25th and 75th percentiles. The whiskers (┴) represent the minimum and maximum TSB and TcB levels. Outliers (○) and extremes (star symbol) are depicted separately. The dashed line is the line at origin. Significant differences between groups are marked in the top of Fig 4 by # (P < 0.05) or ## (P < 0.01), respectively.

Similar articles

Cited by

References

    1. Yamanouchi I, Yamauchi Y, Igarashi I. Transcutaneous bilirubinometry: preliminary studies of noninvasive transcutaneous bilirubin meter in the Okayama National Hospital. Pediatrics 1980;65(2):195–202. - PubMed
    1. American Academy of Pediatrics. Management of hyperbilirubinemia in the newborn infant 35 or more weeks of gestation. Pediatrics 2004;114(1):297–316. 10.1542/peds.114.1.297 - DOI - PubMed
    1. Nagar G, Vandermeer B, Campbell S, Kumar M. Reliability of transcutaneous bilirubin devices in preterm infants: a systematic review. Pediatrics 2013;132(5):871–81. 10.1542/peds.2013-1713 - DOI - PubMed
    1. Maisels MJ, Coffey MP, Kring E. Transcutaneous bilirubin levels in newborns <35 weeks’gestation. J Perinatol 2015;35(9):739–44. 10.1038/jp.2015.34 - DOI - PubMed
    1. Ozkan H, Oren H, Duman N, Duman M. Dermal bilirubin kinetics during phototherapy in term neonates. Acta Paediatr 2003;92(5):577–581. - PubMed

Publication types