. 2019 Jun 14;15(6):e1007834.
doi: 10.1371/journal.ppat.1007834. eCollection 2019 Jun.

ATP6V0d2 controls Leishmania parasitophorous vacuole biogenesis via cholesterol homeostasis

Affiliations

ATP6V0d2 controls Leishmania parasitophorous vacuole biogenesis via cholesterol homeostasis

Carina Carraro Pessoa et al. PLoS Pathog. .

Abstract

V-ATPases are part of the membrane components of pathogen-containing vacuoles, although their function in intracellular infection remains elusive. In addition to organelle acidification, V-ATPases are alternatively implicated in membrane fusion and anti-inflammatory functions controlled by ATP6V0d2, the d subunit variant of the V-ATPase complex. Therefore, we evaluated the role of ATP6V0d2 in the biogenesis of pathogen-containing vacuoles using ATP6V0d2 knock-down macrophages infected with the protozoan parasite Leishmania amazonensis. These parasites survive within IFNγ/LPS-activated inflammatory macrophages, multiplying in large/fusogenic parasitophorous vacuoles (PVs) and inducing ATP6V0d2 upregulation. ATP6V0d2 knock-down decreased macrophage cholesterol levels and inhibited PV enlargement without interfering with parasite multiplication. However, parasites required ATP6V0d2 to resist the influx of oxidized low-density lipoprotein (ox-LDL)-derived cholesterol, which restored PV enlargement in ATP6V0d2 knock-down macrophages by replenishing macrophage cholesterol pools. Thus, we reveal parasite-mediated subversion of host V-ATPase function toward cholesterol retention, which is required for establishing an inflammation-resistant intracellular parasite niche.


Conflict of interest statement

The authors have declared that no competing interests exist.

Figures

Fig 1
Fig 1. ATP6V0d2 knock-down does not impair phagolysosomal acidification.
A. ATP6V0d2 and ATP6V0d1 mRNA relative expression in nonsilenced or ATP6V0d2-KD macrophages (left). ATP6V0d2 mRNA levels presented as a ratio between ATP6V0d2 and ATP6V0d1 expression. Dotted red line indicates level of knock-down. Results are representative of 5 independent experiments. B. Western blotting for ATP6V0d2 (38 kDa band) and ATP6V0a1 (116kDa) expression in nonsilenced (NS) or ATP6V0d2-KD macrophages (KD), confirming the specific silencing for d2 subunit and not for other components of the V0 complex. β-actin expression (42 kDa band) was assessed as loading control. C-E. Phagosomal pH evaluated in nonsilenced or ATP6V0d2-KD macrophages. C. Representative images of confocal microscopy showing FITC-coated latex beads that were engulfed by macrophages (differential interference contrast on the left and FITC green fluorescence on the right (FITC excitation at 496 nm; emission captured by 520–537 nm filter). Bar = 20 μm. D. FITC intensity (arbitrary units, AU, as obtained by microscope system) of each analyzed bead in macrophages cultivated at different pH (3.5–7.0) in nonsilenced (NS, gray) or ATP6V0d2-KD macrophages (KD, orange). A standard curve was generated from the mean values obtained at each pH condition and for each macrophage group (NS and KD). E. Average phagosomal pH of nonsilenced or ATP6V0d2-KD macrophages, activated or not by IFN-γ/LPS, estimated to be acidic between pH 5.1–5.3, in the conditions studied (ns = nonsignificant, p>0.05).
Fig 2
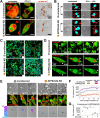
Fig 2. ATP6V0d2 upregulated by intracellular parasites does not participate in parasite resistance to IFN-γ/LPS-activated macrophages.
A. ATP6V0d2 mRNA expression relative to expression of isoform d1 (ATP6V0d1) in nonsilenced or ATP6V0d2-KD macrophages activated or not with IFN-γ/LPS and infected or not by L. amazonensis for 48 hours. The results are representative of 5 independent experiments. *p< 0.05; ns = nonsignificant. B. Expression of NOS2 (left panel) and arginase (right panel) mRNA after 6 and 72 hours of L. amazonensis infection, respectively, in nonsilenced and ATP6V0d2-KD macrophages activated or not with IFN-γ/LPS. NOS2 and arginase mRNA expression was calculated relative to β-actin mRNA expression. The asterisks indicate statistical significance (p<0.05) between nonsilenced and ATP6V0d2-KD measurements. ns = nonsignificant. The results are representative of 2 independent experiments. C-D. Dynamic quantification of parasite numbers in macrophage cultures recorded by live imaging using image segmentation and automatic counting algorithms. In C, upper panel, images of GFP-expressing macrophages (green) merged with images of DsRed2-expressing parasites (red) at the start (0d00:00) and after 20 hours and 30 minutes (0d:20:30) of image acquisition. In the lower panel, the results of image segmentation processing, which identifies parasites (red spots) and macrophages using a color scale ranging from cyan (noninfected macrophage) to magenta (macrophage sheltering >8 parasites). Bar = 10 μm. In D, the number of macrophages per recorded field (upper graph) and the number of parasites per macrophage (lower graph) were assessed throughout 36-hour live imaging recordings of infected nonsilenced or ATP6V0d2-KD macrophages activated or not with IFN-γ/LPS. The data are represented as the means and standard errors of 8 different microscopic fields per condition. The results are representative of 2 independent experiments. E. Infection indexes obtained from nonsilenced or ATP6V0d2-KD macrophages activated or not with IFN-γ/LPS and infected with L. amazonensis for 72 hours. The results are representative of 3 independent experiments.
Fig 3
Fig 3. ATP6V0d2 controls the volumetric expansion of L. amazonensis parasitophorous vacuoles without interfering with their acidification or acquisition of lysosome membrane proteins.
A. Confocal and phase contrast microscopy images showing nonsilenced or ATP6V0d2-KD macrophages that display acidified L. amazonensis PVs as assessed by a fluorescent lysosomotropic probe (first 2 columns, macrophages in green, lysosomotropic probe in red). Specificity of the probe for acidic compartments was confirmed by cultivating macrophages in the presence of the probe and ammonium chloride (NH4Cl, second column). Bar = 10 μm. Phagolysosomal acidification was confirmed by another lysosomotropic probe, Neutral Red, in both macrophage groups (third column). Bar = 20 μm. B. Immunofluorescence images showing LAMP-1 staining (red) in the membrane of L. amazonensis PVs (arrowheads) formed in nonsilenced or ATP6V0d2-KD macrophages activated or not with IFN-γ/LPS and hosting parasites for 30 minutes or 6 hours. Images show DIC and immunofluorescence for each analyzed group. Nuclei stained with DAPI. Bar = 5 μm. C. Two representative live imaging microscopic fields presenting the population of nonsilenced or ATP6V0d2-KD macrophages (green) infected by L. amazonensis (red) and their differences in PV dimensions as assessed by three-dimensional projections in xy, xz and yz coordinates. Dotted lines indicate the macrophages projected in three-dimensions. Images show nucleus staining by Hoechst live cell nuclear dye. Bar = 20 μm. D. Live imaging of IFN-γ/LPS-activated nonsilenced or ATP6V0d2-KD macrophages (green) hosting L. amazonensis (red). Arrowheads indicate PV volumetric expansion in nonsilenced macrophages or PV fission in macrophages silenced for ATP6V0d2. Time of image acquisition is expressed as hours:minutes (h:mm). Bars = 20 and 10 μm. E. Dynamic measurement of PV volumetric expansion from live imaging of infected nonsilenced or ATP6V0d2-KD macrophages (first row, differential interference contrast images), applying image segmentation on macrophages (green) and lysosomotropic probe (red) fluorescent channels (merged in the second row). The images represent the same infected macrophages recorded at different time points (presented as hours:minutes) of image acquisition. The lysosomotropic probe fluorescence retained in the PV allowed for reconstruction of the compartments as an isosurface from which volumetric information was assessed (third row, probe-positive detected PV represented in a colorimetric scale ranging from 50 μm3 in cyan to 250 μm3 in magenta). Bar = 10 μm. F. Dynamic tracking of PV volumetric expansion applied to infected nonsilenced or ATP6V0d2-KD macrophages, activated or not with IFN-γ/LPS, throughout a 24-hour live imaging acquisition. Parasites hosted by ATP6V0d2-KD macrophages are sheltered within smaller PVs with restrained PV volumetric expansion. The data are represented as the means and standard errors of 10 different microscopic fields per condition. The results are representative of 3 independent experiments. G. PV volumetric measures (n = ~50 vacuoles) of nonsilenced or ATP6V0d2-KD macrophages, activated or not with IFN-γ/LPS, in samples fixed after 48 hours of infection. The asterisks indicate statistical significance (p<0.05). ns = nonsignificant. The results are representative of 3 independent experiments.
Fig 4
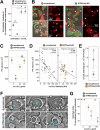
Fig 4. Ox-LDL-mediated repletion of ATP6V0d2-KD cholesterol levels restores PV volumes and impacts parasite multiplication.
A. Intracellular cholesterol levels displayed by nonsilenced or ATP6V0d2-KD macrophages treated or not with 50 μg/ml of ox-LDL for 48 hours, showing that ox-LDL replenishes the ~40% lower cholesterol amount of ATP6V0d2-KD to levels comparable to nonsilenced macrophages. The data were normalized by the maximum value obtained in nontreated, nonsilenced macrophage. The asterisks indicate statistical significance (p<0.05), and the results are representative of 4 independent experiments. B. Confocal images of live infected nonsilenced or ATP6V0d2-KD macrophages (green) treated with fluorescent ox-LDL (Dil-ox-LDL). Arrowheads indicate PVs that accumulated ox-LDL and asterisks indicate a representative case in which ox-LDL are not retained in larger PVs. Bar = 10 μm. C. PV volumetric measurements (n = ~50 vacuoles) of ATP6V0d2-KD macrophages infected for 24 hours treated or not with 50 or 100 μg/ml of ox-LDL for the following 48 hours (comprising 72 hours of intracellular infection). The asterisks indicate statistical significance (p<0.05). ns = nonsignificant. The results are representative of 3 independent experiments. D. Correlation between PV volume and fluorescence intensities (in arbitrary units) of Dil-ox-LDL retained in PVs. PV isosurfaces were obtained from Dil-ox-LDL fluorescence signal, allowing for retrieving volumetric data. Larger PVs that do not accumulate ox-LDL were excluded from the correlation. Pearson’s correlation coefficients indicate statistically significant negative correlation between PV volumes and accumulation of ox-LDL in both nonsilenced and ATP6V0d2-KD macrophages. E. Amount of ox-LDL retained in PVs formed in nonsilenced and ATP6V0d2-KD macrophages expressed as Dil-ox-LDL fluorescence per μm3 of PV (* p<0.05). F. Time-lapse imaging in differential interference contrast of infected nonsilenced (upper row) or ATP6V0d2-KD macrophages (lower row) treated with 50 μg/ml ox-LDL. Image acquisition started 24 hours post-infection and 15 minutes after ox-LDL addition; time is represented as hours:minutes (h:mm). In the upper row, arrowheads indicate parasites multiplying in large PVs in nonsilenced macrophages in the presence of ox-LDL; in the lower row, arrowheads indicate parasite killing in PVs whose volume was restored in ox-LDL-treated ATP6V0d2-KD macrophages. Bar = 5 μm. G. Infection index calculated after 72 hours of infection (with or without 48 hours of cholesterol repletion with 50 or 100 μg/ml of ox-LDL) displayed by infected nonsilenced or ATP6V0d2-KD macrophages. Parasite multiplication impairments occurred specifically in ATP6V0d2-KD macrophages in a dose-dependent manner. The data were normalized per macrophage group (nonsilenced or ATP6V0d2-KD) by the maximum value obtained in nontreated macrophages. The asterisks indicate statistical significance (p<0.05) between nonsilenced and ATP6V0d2-KD indexes, and the results are representative of 5 independent experiments.
Fig 5
Fig 5. Parasite-mediated expression of macrophage scavenger receptor CD36 is associated with ox-LDL-mediated PV volume recovery in ATP6V0d2-KD.
A. LDL-R, CD36, Msr1/SRA and LOX-1 mRNA expression in nonsilenced or ATP6V0d2-KD macrophages infected or not by L. amazonensis for 72 hours, treated or not with 50 μg/ml ox-LDL for 48 hours during intracellular infection. The results are representative of 2 independent experiments. Red arrowheads indicate parasite-mediated increase in mRNA levels of CD36 and LOX-1 scavenger receptors. B. Western blotting for CD36 protein expression (70-80kDa) in the studied conditions of infection and ox-LDL treatment. β-actin expression (42 kDa band) was assessed as loading control. CD36 expression detected by western blotting was further assessed by densitometric analysis of the protein bands corresponding to protein expression levels (graph on the lower panel, data expressed in arbitrary units). Red arrowhead indicates parasite-mediated increase in protein levels of CD36. C. CD36 membrane surface expression assessed by flow cytometry in nonsilenced (NS) or ATP6V0d2-KD macrophages (KD). Fluorescence intensities represented as FACS histograms; unstained controls and antibody isotype controls (APC ctrl) were employed to confirm CD36 antibody specificity. D. Membrane surface expression of scavenger receptors SR-BII and SR-BI in NS and KD macrophages assessed by flow cytometry. Fluorescence intensities represented as FACS histograms; fluorescence-coupled secondary antibodies without primary antibodies for the receptors (secondary ctrl) were employed to confirm antibody specificity.
Fig 6
Fig 6. Mechanistic model proposed for the participation of V-ATPase subunit ATP6V0d isoform d2 in the macrophage intracellular cholesterol regulation and L. amazonensis PV biogenesis.
A. The parasite upregulates the expression of d2 subunit (ATP6V0d2) but not the regular and ubiquitous d1 isoform, ATP6V0d1, indicating that infection is accompanied by additional functions of V-ATPases not necessarily related to acidification. Infection and PV biogenesis do not disturb the expression of cholesterol biosynthesis regulator SREBP2 nor the expression of scavenger receptors for nonmodified (LDL-R) or modified forms of LDL (Msr1/SRA, CD36, LOX-1) in nonsilenced macrophages. B. ATP6V0d2-KD macrophages presented 40% depletion in intracellular cholesterol levels that, although not interfering in parasite multiplication (which main sterol component is ergosterol), severely impaired L. amazonensis PV enlargement. CD36 expression is decreased during ATP6V0d2 knock-down and, with decreased levels of intracellular cholesterol, LDL-R expression is increased. LOX-1 and SRA expression suggests that modified LDL are able to be captured by infected cells despite ATP6V0d2 knock-down and CD36 decreased expression. C. When ATP6V0d2-KD macrophage intracellular cholesterol is replenished with exogenous oxidized Low-Density Lipoprotein (ox-LDL), a parasite-mediated restoration of CD36 expression is observed together with restored PV volumes. The ox-LDL source of cholesterol incorporated by ATP6V0d2-KD macrophages accumulated in PVs impaired parasite multiplication despite recovering PV dimensions.

Similar articles

Cited by

References

    1. Forgac M. Vacuolar ATPases: rotary proton pumps in physiology and pathophysiology. Nat Rev Mol Cell Biol. 2007;8(11):917–29. 10.1038/nrm2272 . - DOI - PubMed
    1. Mindell JA. Lysosomal acidification mechanisms. Annu Rev Physiol. 2012;74:69–86. 10.1146/annurev-physiol-012110-142317 . - DOI - PubMed
    1. Kane PM. The where, when, and how of organelle acidification by the yeast vacuolar H+-ATPase. Microbiol Mol Biol Rev. 2006;70(1):177–91. 10.1128/MMBR.70.1.177-191.2006 - DOI - PMC - PubMed
    1. Maxson ME, Grinstein S. The vacuolar-type H(+)-ATPase at a glance—more than a proton pump. J Cell Sci. 2014;127(Pt 23):4987–93. 10.1242/jcs.158550 . - DOI - PubMed
    1. Lukacs GL, Rotstein OD, Grinstein S. Phagosomal acidification is mediated by a vacuolar-type H(+)-ATPase in murine macrophages. J Biol Chem. 1990;265(34):21099–107. . - PubMed

Publication types