. 2019 Jun 13;177(7):1771-1780.e12.
doi: 10.1016/j.cell.2019.05.032.

Viral Capsid Trafficking along Treadmilling Tubulin Filaments in Bacteria

Affiliations

Viral Capsid Trafficking along Treadmilling Tubulin Filaments in Bacteria

Vorrapon Chaikeeratisak et al. Cell. .

Abstract

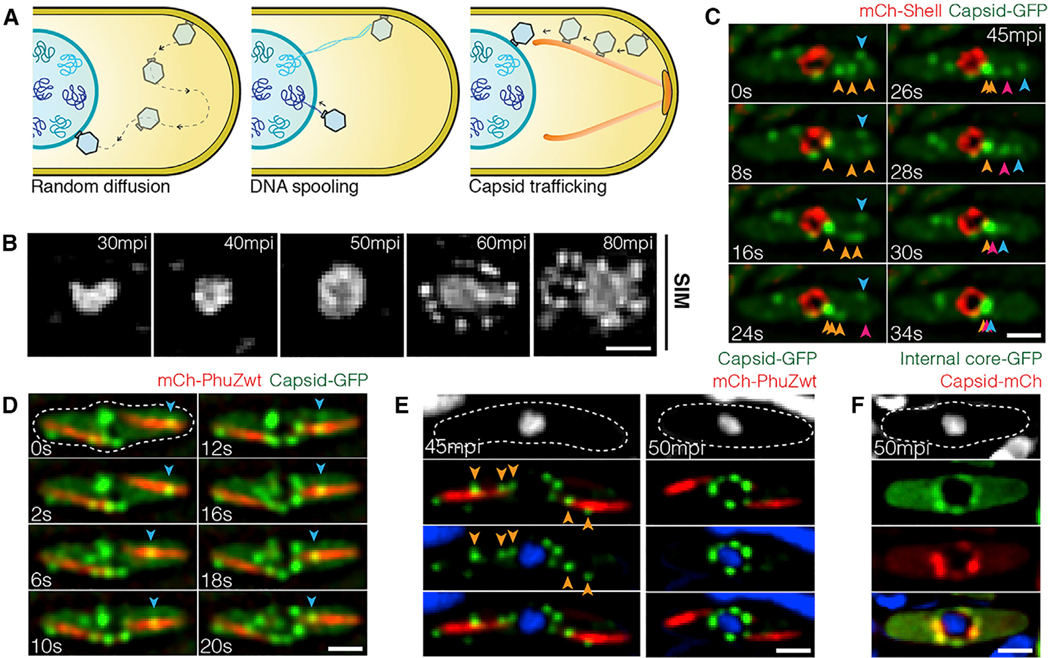
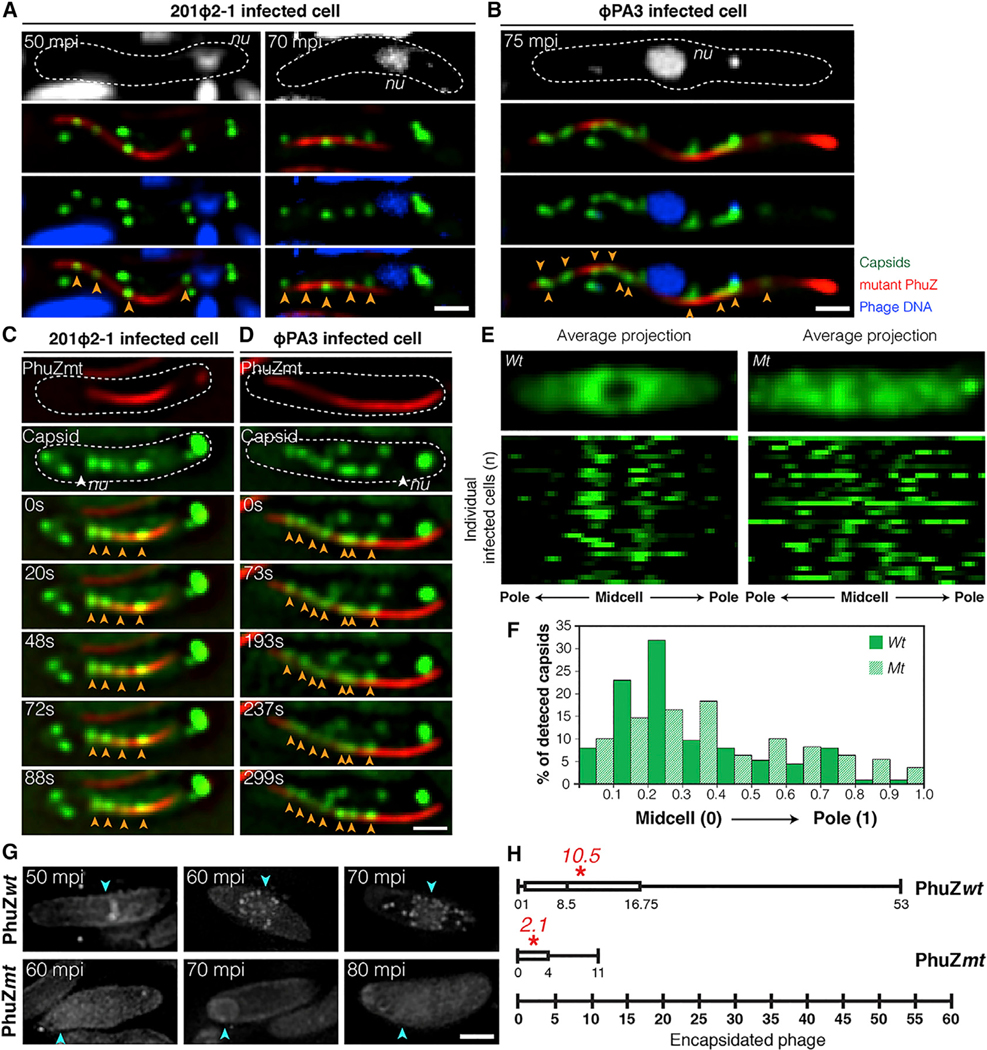
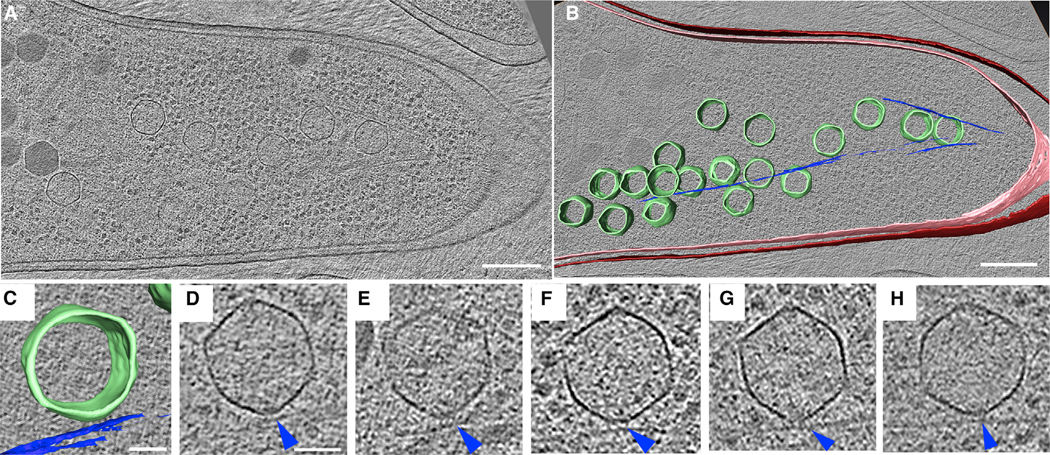
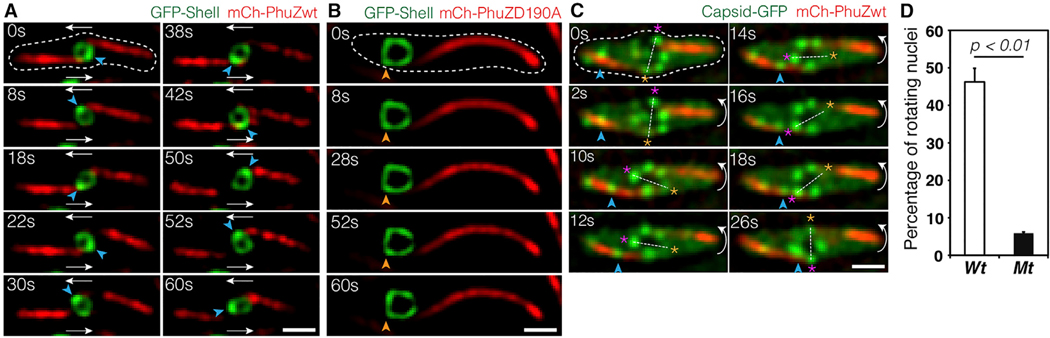
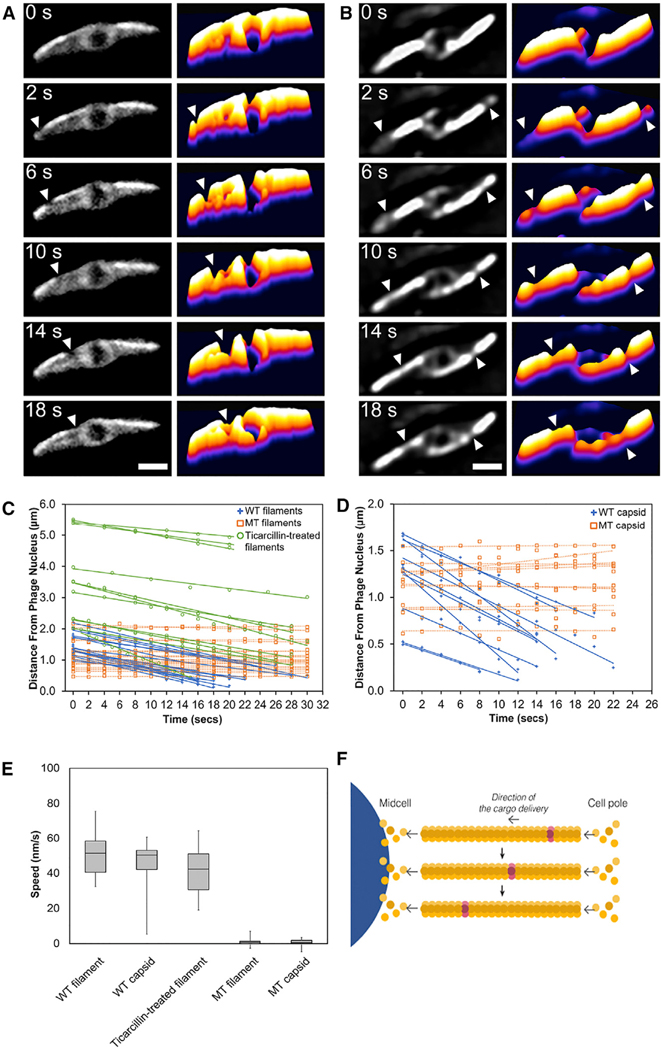
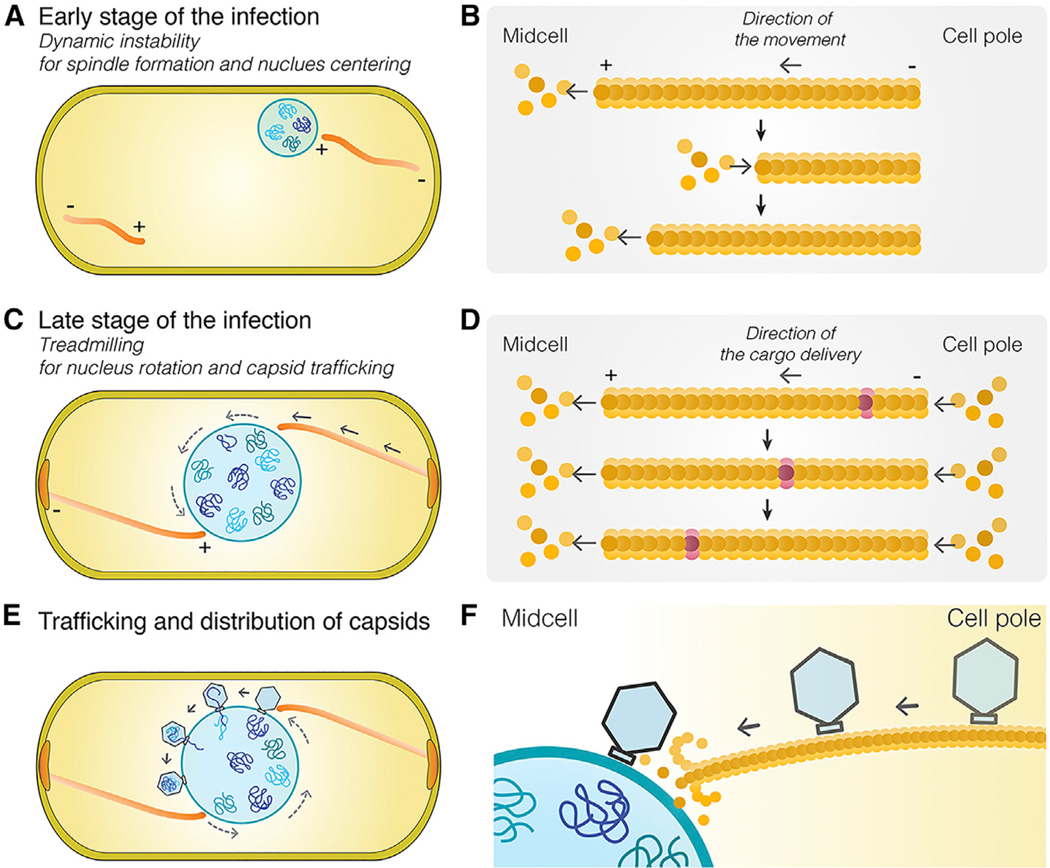
Cargo trafficking along microtubules is exploited by eukaryotic viruses, but no such examples have been reported in bacteria. Several large Pseudomonas phages assemble a dynamic, tubulin-based (PhuZ) spindle that centers replicating phage DNA sequestered within a nucleus-like structure. Here, we show that capsids assemble on the membrane and then move rapidly along PhuZ filaments toward the phage nucleus for DNA packaging. The spindle rotates the phage nucleus, distributing capsids around its surface. PhuZ filaments treadmill toward the nucleus at a constant rate similar to the rate of capsid movement and the linear velocity of nucleus rotation. Capsids become trapped along mutant static PhuZ filaments that are defective in GTP hydrolysis. Our results suggest a transport and distribution mechanism in which capsids attached to the sides of filaments are trafficked to the nucleus by PhuZ polymerization at the poles, demonstrating that the phage cytoskeleton evolved cargo-trafficking capabilities in bacteria.

Keywords: PhuZ; Pseudomonas phage; capsid distribution; capsid trafficking; giant phage; nuclear rotation; phage nucleus; treadmilling.


Conflict of interest statement

DECLARATION OF INTERESTS

The authors declare no competing interests.

Figures

Figure 1.
Figure 1.. Phage Capsids Traffic along PhuZ Filaments to the Phage Nucleus for DNA Encapsidation by 60 mpi
(A) Three possible models of capsid trajectory toward the phage nucleus. (B) 3D-SIM images showing appearance of the phage nucleus at various developmental stages of infected P. chlororaphis cells. The phage nucleus shows uniform staining in the first 50 min of infection. At 60 min post infection (mpi), bright puncta appear surrounding the phage nucleus. Scale bars, 0.5 micron. (C) Rapid time-lapse imaging of GFP-tagged capsid (gp200; green) and mCherry-tagged shell (gp105; red) in P. chlororaphis infected with phage 201Φ2–1 over a 34 s interval. Capsids (green) assemble near the cell membrane, and immediately after detachment, they independently migrate along the same straight-line trajectory toward the phage shell (red). Arrows indicate individual capsids. See also Data S1 (see Movie 1). (D) Rapid time-lapse imaging of GFP-tagged capsids (gp200; green) and mCherry-tagged wild-type PhuZ (gp059; red) during an interval of 20 s in phage 201Φ21-infected P. chlororaphis cells. Blue arrow indicates a capsid traveling along the PhuZ spindle from the cell pole to phage nucleus. See also Data S1 (see Movie 3). (E) Still images of phage 201Φ2–1-infected P. chlororaphis cells expressing GFP-tagged capsid (gp200; green) and mCherry-tagged wild-type PhuZ (gp059; red) at 45 and 50 mpi. (F) Still images of phage 201Φ2–1-infected P. chlororaphis cells expressing GFP-tagged internal core protein (gp246; green) and mCherry-tagged capsid (gp200; red) at 50 mpi. Dashed lines indicate cell borders. Scale bars in (C)–(F), 1 micron. See also Figures S1 and S2.
Figure 2.
Figure 2.. Phage Capsids Are Trapped along Mutant PhuZ Spindles in Both Phage 201𝚽2–1 and Phage 𝚽PA3, Resulting in Reduced Encapsidation
(A) Fluorescence images of P. chlororaphis expressing GFP-tagged 201-capsid (gp200; green) and catalytically defective mCherry-tagged 201-PhuZD190A (gp059; red) infected with phage 201Φ2–1 at 50 and 70 mpi. (B) Fluorescence images of P. aeruginosa expressing mCherry-tagged PA3-capsid (gp136; false color, green) and catalytically defective GFP-tagged PA3-PhuZD190A (gp028; false color, red) infected with phage ΦPA3 at 75 mpi. (C) Time-lapse imaging of P. chlororaphis expressing GFP-tagged 201-capsid (gp200; green) with mCherry-tagged 201-PhuZD190A (gp059; red) over an interval of 88 s. See also Data S1 (see Movie 4). (D) Time-lapse imaging of P. aeruginosa expressing mCherry-tagged PA3-capsid (gp136; false color, green) with GFP-tagged PA3-PhuZD190A (gp028; false color, red) over an interval of 299 s. See also Data S1 (see Movie 6). (E) Distribution of GFP-tagged 201-capsids (gp200) in P. chlororaphis cells expressing either wild-type (left) or mutant (right) PhuZD190A infected with phage 201Φ2–1 at 50 mpi. Average Z-projection images (n = 32) of GFP intensity (top); distribution plots of GFP intensity of individuals (n = 32) (bottom). (F) Graph showing percentage of detected GFP-tagged capsids in phage 201Φ2–1-infected P. chlororaphis cells expressing either wild-type (green) or mutant PhuZD190A (hatched bar) versus the fraction of cell length from the midcell to the cell pole. (G) 3D-SIM images of encapsidated phage particles in phage 201Φ2–1-infected P. chlororaphis cells expressing either wild-type (top) or mutant (bottom) PhuZD190A at various time points. Arrows indicate positions of the phage nuclei. (H) Box plot showing the number of encapsidated phage particles counted in phage 201Φ2–1-infected P. chlororaphis cells expressing either wild-type (top) or mutant (bottom) PhuZ at 80 mpi. Asterisks indicate the average number of the encapsidated particles counted per strain. Dashed lines indicate the border of the cells. Scale bars, 1 micron. See also Figure S2.
Figure 3.
Figure 3.. Cryo-electron Tomography Revealing Capsids Trapped along Mutant PhuZ Filaments during Phage 𝚽PA3 Infection in P. aeruginosa at 70 mpi
(A) A slice through a tomogram of a cryo-focused ion beam–thinned phage-infected cell at 70 mpi. Scale bar, 200 nm. (B) Annotation of the tomogram in (A) showing extracted structures, including capsids (green), cytoplasmic membrane (pink), outer membrane (red), and mutant PhuZD190A spindles (blue). Scale bar, 200 nm. (C and D) Zoomed-in view (C) of one of the capsids stuck on the mutant filament from the tomogram shown in (A) and its corresponding tomogram slice (D). Scale bar, 50 nm. (E–H) Slices of tomograms of capsids trapped along the mutant filaments from tomograms of other phage-infected cells taken for this study, with blue arrow pointing towards the mutant spindle. See also Figure S2.
Figure 4.
Figure 4.. Rotation of the Phage Nucleus Exerted by PhuZ Spindle Distribute Phage Capsids around the Nucleus
(A and B) Rapid time-lapse imaging of phage 201Φ2–1-infected P. chlororaphis expressing GFP-tagged shell (gp105) with either mCherry-tagged wild-type PhuZ (gp059) (A) or mCherry-tagged mutant PhuZD190A (gp059) (B) during 60 s intervals. In the presence of wild-type filaments, the shell (green) rotates counter-clockwise when the PhuZ filaments push the shell transversely; the shell successfully rotates twice within 42 s. The mutant PhuZD190A is unable to catalyze GTP hydrolysis and appears static, resulting in a mispositioned and motionless shell within the infected cell. See also Data S1 (see Movies 7 and 8). (C) Rapid time-lapse microscopy of phage 201Φ2–1-infected P. chlororaphis expressing GFP-tagged capsid (gp200) and mCherry-tagged wild-type PhuZ (gp059) in a 26 s interval. A capsid (arrow) travels along the filament from cell pole toward the phage nucleus, which rotates counterclockwise. The capsid docks on the surface of the nucleus at 26 s. Dashed lines indicate cell borders. Scale bars, 1 micron. See also Data S1 (see Movie 9). (D) Graph showing the percentage of rotating nuclei in P. chlororaphis infected cells in the presence of either wild-type PhuZ (wt) or mutant PhuZD190A (mt). The graph shows that the number of rotating nuclei in the presence of wild-type PhuZ (46.2%) is significantly higher (p < 0.01) than that in the presence of mutant PhuZD190A (5.9%). Data were collected from infected cells at 50 mpi from at least three different fields and are represented as mean ± SE (n; wt = 611 and mt = 286). See also Figure S4.
Figure 5.
Figure 5.. PhuZ Filaments Treadmill Unidirectionally toward the Nucleus at a Constant Rate
(A) A single photobleaching event at the cell pole(arrow) moves toward the phage nucleus. See also Data S1 (see Movie 12). (B) A double photobleaching event shows that bleach spots made at both cell poles (arrows) flux down the filaments toward the phage nucleus. Scale bars, 1 micron. See also Data S1 (see Movie 13). (C) Graph showing rates of bleach-spot movement (distance in microns versus time in seconds) in wild-type ΦPA3-PhuZ filaments, mutant ΦPA3PhuZD190A filaments, and wild-type ΦPA3-PhuZ filaments treated with the antibiotic ticarcillin to produce elongated cells. (D) Graph showing rates of capsid movement (distance in microns versus time in seconds) when co-expressed with either wild-type ΦPA3-PhuZ or the mutant ΦPA3-PhuZD190A. (E) Box-and-whisker plots showing average speeds of movement of bleach spots on wild-type PA3 PhuZ filaments (WT filament), on wild-type PA3 PhuZ filaments in ticaricillin-treated cells (ticaricillin-treated filament), or on mutant PA3 PhuZD190A filaments (MT filament). Average speed of capsid movement in cells with wild PA3 PhuZ filaments (WT capsid) or mutant PA3 PhuZD190A filaments (MT capsid). (F) Model of PhuZ filament treadmilling, indicating that addition of new subunits causes the bleached subunits (gray) to flux toward the nucleus. See also Figures S4 and S5 and Data S1 (see Movie 14).
Figure 6.
Figure 6.. Model of Capsid Trafficking and the Role of Nucleus Rotation in Distributing Capsids around the Phage Nucleus
The spindle’s functions are complex and change as phage development proceeds. (A) At the onset of infection, dynamically unstable filaments assemble with minus ends anchored at the cell poles, and plus ends oriented toward midcell push the growing phage nucleus to the cell midpoint where it oscillates in position. (B) Model of dynamically unstable filaments showing cycles of polymerization, depolymerization, and recovery at the plus end of the polymer. (C) Later in infection, the function of the spindle switches from centering the nucleus to rotating it in position and transporting capsids to the phage nucleus for DNA packaging. Treadmilling provides the driving force and temporally couples both processes. (D) Model of treadmilling filaments showing addition of new subunits at the minus end near the cell pole drives photobleached subunits (purple) toward midcell. (E) Rotation of the phage nucleus serves to distribute capsids evenly around its surface. (F) Capsids are delivered to the surface of the phage nucleus for DNA packaging.

Similar articles

Cited by

References

    1. Ayaz P, Munyoki S, Geyer EA, Piedra FA, Vu ES, Bromberg R, Otwinowski Z, Grishin NV, Brautigam CA, and Rice LM (2014). A tethered delivery mechanism explains the catalytic action of a microtubule polymerase. eLife 3, e03069. - PMC - PubMed
    1. Aylett CH, Izoré T, Amos LA, and Löwe J. (2013). Structure of the tubulin/FtsZ-like protein TubZ from Pseudomonas bacteriophage FKZ. J. Mol. Biol 425, 2164–2173. - PMC - PubMed
    1. Brouhard GJ, and Rice LM (2018). Microtubule dynamics: an interplay of biochemistry and mechanics. Nat. Rev. Mol. Cell Biol 19, 451–463. - PMC - PubMed
    1. Brouhard GJ, Stear JH, Noetzel TL, Al-Bassam J, Kinoshita K, Harrison SC, Howard J, and Hyman AA (2008). XMAP215 is a processive microtubule polymerase. Cell 132, 79–88. - PMC - PubMed
    1. Chaikeeratisak V, Nguyen K, Egan ME, Erb ML, Vavilina A, and Pogliano J. (2017a). The Phage Nucleus and Tubulin Spindle Are Conserved among Large Pseudomonas Phages. Cell Rep. 20, 1563–1571. - PMC - PubMed

Publication types