

Pathology Image Analysis Using Segmentation Deep Learning Algorithms
- PMID: 31199919
- PMCID: PMC6723214
- DOI: 10.1016/j.ajpath.2019.05.007
Pathology Image Analysis Using Segmentation Deep Learning Algorithms
Abstract
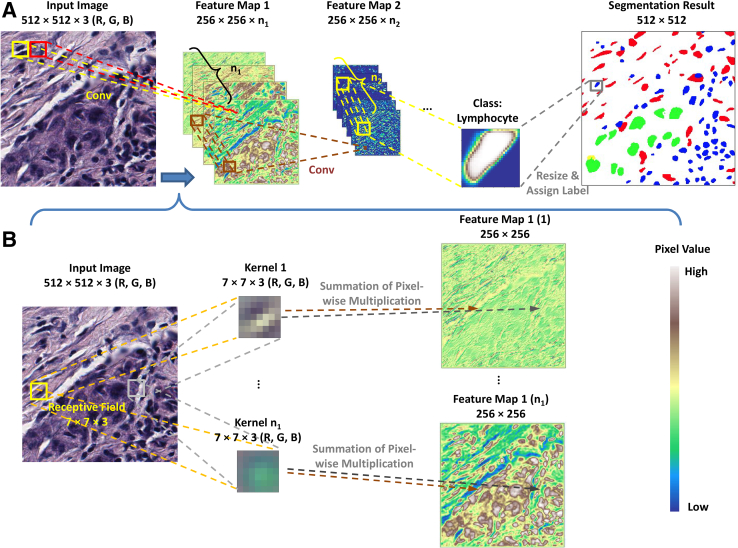
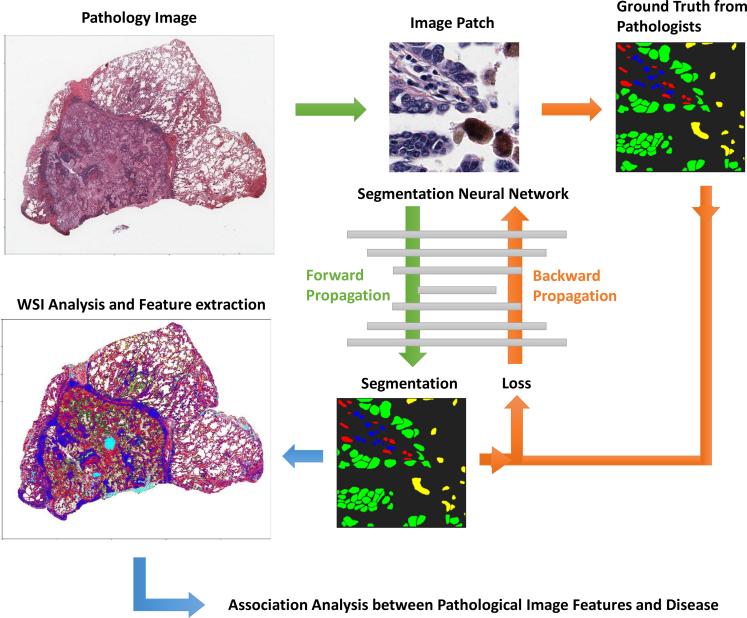
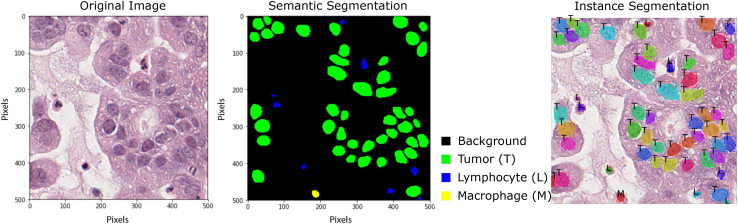
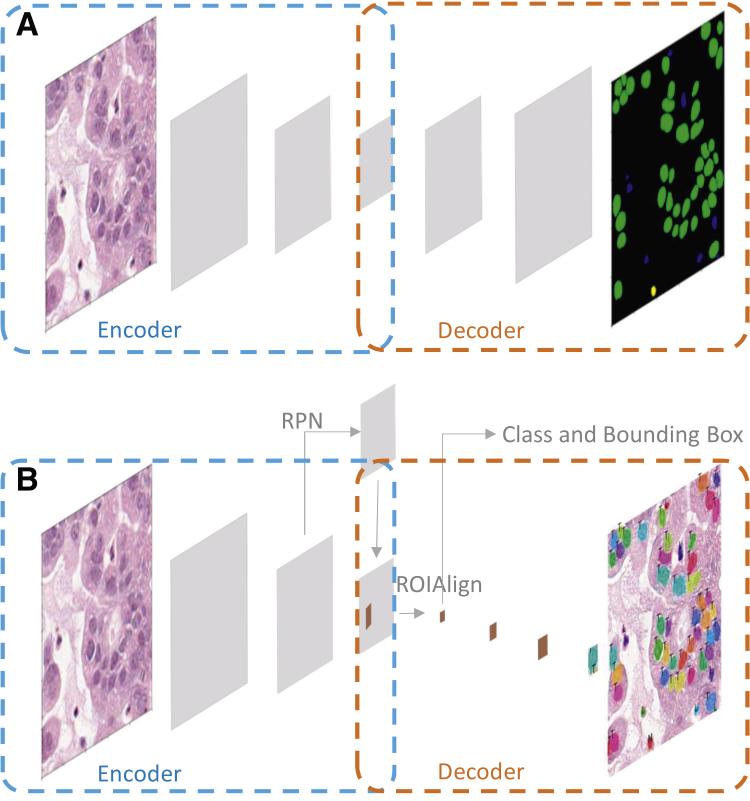
With the rapid development of image scanning techniques and visualization software, whole slide imaging (WSI) is becoming a routine diagnostic method. Accelerating clinical diagnosis from pathology images and automating image analysis efficiently and accurately remain significant challenges. Recently, deep learning algorithms have shown great promise in pathology image analysis, such as in tumor region identification, metastasis detection, and patient prognosis. Many machine learning algorithms, including convolutional neural networks, have been proposed to automatically segment pathology images. Among these algorithms, segmentation deep learning algorithms such as fully convolutional networks stand out for their accuracy, computational efficiency, and generalizability. Thus, deep learning-based pathology image segmentation has become an important tool in WSI analysis. In this review, the pathology image segmentation process using deep learning algorithms is described in detail. The goals are to provide quick guidance for implementing deep learning into pathology image analysis and to provide some potential ways of further improving segmentation performance. Although there have been previous reviews on using machine learning methods in digital pathology image analysis, this is the first in-depth review of the applications of deep learning algorithms for segmentation in WSI analysis.
Copyright © 2019 American Society for Investigative Pathology. Published by Elsevier Inc. All rights reserved.
Figures
Similar articles
-
Deep computational pathology in breast cancer.Semin Cancer Biol. 2021 Jul;72:226-237. doi: 10.1016/j.semcancer.2020.08.006. Epub 2020 Aug 17. Semin Cancer Biol. 2021. PMID: 32818626 Review.
-
A Deep Learning Approach for Histology-Based Nucleus Segmentation and Tumor Microenvironment Characterization.Mod Pathol. 2023 Aug;36(8):100196. doi: 10.1016/j.modpat.2023.100196. Epub 2023 Apr 24. Mod Pathol. 2023. PMID: 37100227 Free PMC article.
-
Variability and reproducibility in deep learning for medical image segmentation.Sci Rep. 2020 Aug 13;10(1):13724. doi: 10.1038/s41598-020-69920-0. Sci Rep. 2020. PMID: 32792540 Free PMC article.
-
The impact of pre- and post-image processing techniques on deep learning frameworks: A comprehensive review for digital pathology image analysis.Comput Biol Med. 2021 Jan;128:104129. doi: 10.1016/j.compbiomed.2020.104129. Epub 2020 Nov 21. Comput Biol Med. 2021. PMID: 33254082 Review.
-
A survey on deep learning in medical image analysis.Med Image Anal. 2017 Dec;42:60-88. doi: 10.1016/j.media.2017.07.005. Epub 2017 Jul 26. Med Image Anal. 2017. PMID: 28778026 Review.
Cited by
-
Novel ensemble learning approach with SVM-imputed ADASYN features for enhanced cervical cancer prediction.PLoS One. 2024 Jan 10;19(1):e0296107. doi: 10.1371/journal.pone.0296107. eCollection 2024. PLoS One. 2024. PMID: 38198475 Free PMC article.
-
The use of deep learning technology for the detection of optic neuropathy.Quant Imaging Med Surg. 2022 Mar;12(3):2129-2143. doi: 10.21037/qims-21-728. Quant Imaging Med Surg. 2022. PMID: 35284277 Free PMC article. Review.
-
An Expandable Informatics Framework for Enhancing Central Cancer Registries with Digital Pathology Specimens, Computational Imaging Tools, and Advanced Mining Capabilities.J Pathol Inform. 2022 Jan 5;13:5. doi: 10.4103/jpi.jpi_31_21. eCollection 2022. J Pathol Inform. 2022. PMID: 35136672 Free PMC article.
-
Computational Staining of Pathology Images to Study the Tumor Microenvironment in Lung Cancer.Cancer Res. 2020 May 15;80(10):2056-2066. doi: 10.1158/0008-5472.CAN-19-1629. Epub 2020 Jan 8. Cancer Res. 2020. PMID: 31915129 Free PMC article.
-
Enhancing semantic segmentation in chest X-ray images through image preprocessing: ps-KDE for pixel-wise substitution by kernel density estimation.PLoS One. 2024 Jun 24;19(6):e0299623. doi: 10.1371/journal.pone.0299623. eCollection 2024. PLoS One. 2024. PMID: 38913621 Free PMC article.
References
-
- Jara-Lazaro A.R., Thamboo T.P., Teh M., Tan P.H. Digital pathology: exploring its applications in diagnostic surgical pathology practice. Pathology. 2010;42:512–518. - PubMed
-
- Webster J.D., Dunstan R.W. Whole-slide imaging and automated image analysis: considerations and opportunities in the practice of pathology. Vet Pathol. 2014;51:211–223. - PubMed
-
- LeCun Y., Bengio Y., Hinton G. Deep learning. Nature. 2015;521:436–444. - PubMed
-
- Krizhevsky A., Sutskever I., Hinton G.E. ImageNet classification with deep convolutional neural networks. Commun ACM. 2017;60:84–90.
Publication types
MeSH terms
Grants and funding
LinkOut - more resources
Full Text Sources
Other Literature Sources
Medical
