. 2019 Jun 13;8(6):582.
doi: 10.3390/cells8060582.

Hyperosmotic Stress Response Memory is Modulated by Gene Positioning in Yeast

Affiliations

Hyperosmotic Stress Response Memory is Modulated by Gene Positioning in Yeast

Zacchari Ben Meriem et al. Cells. .

Abstract

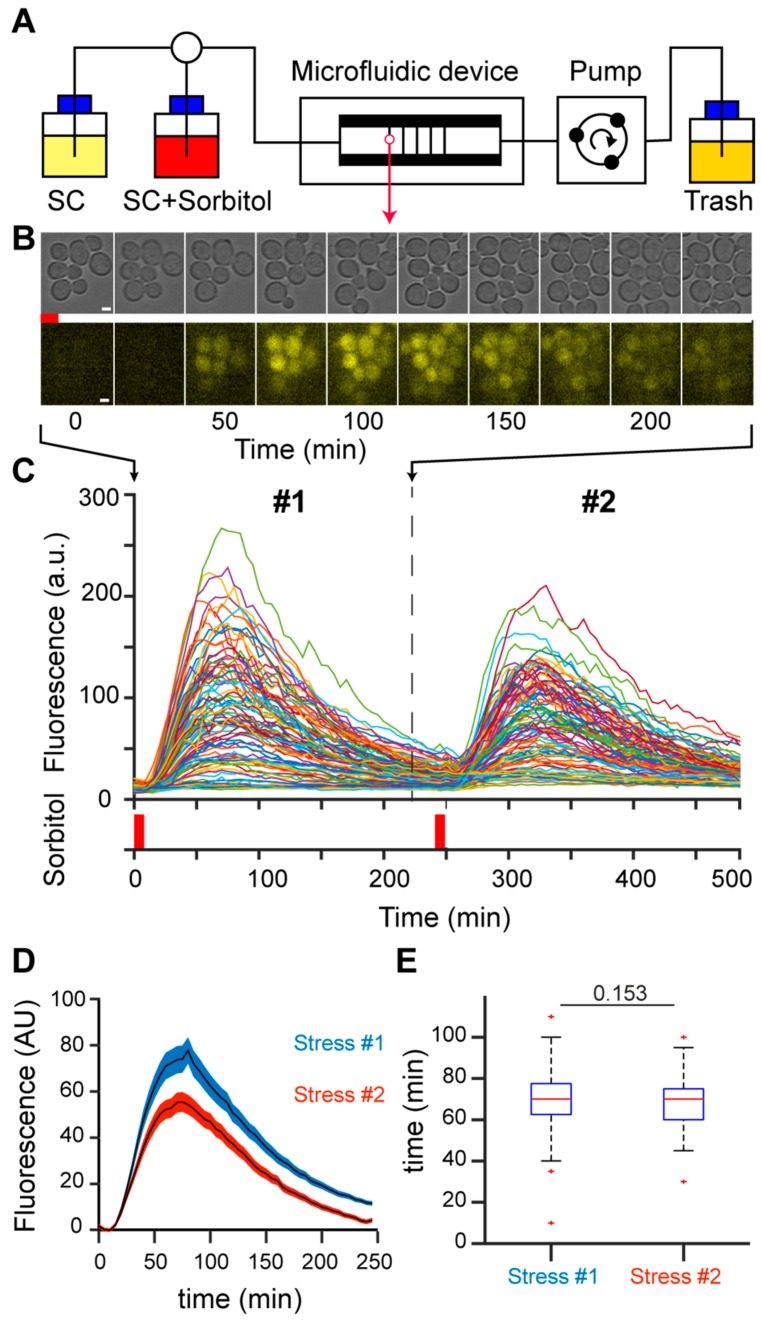
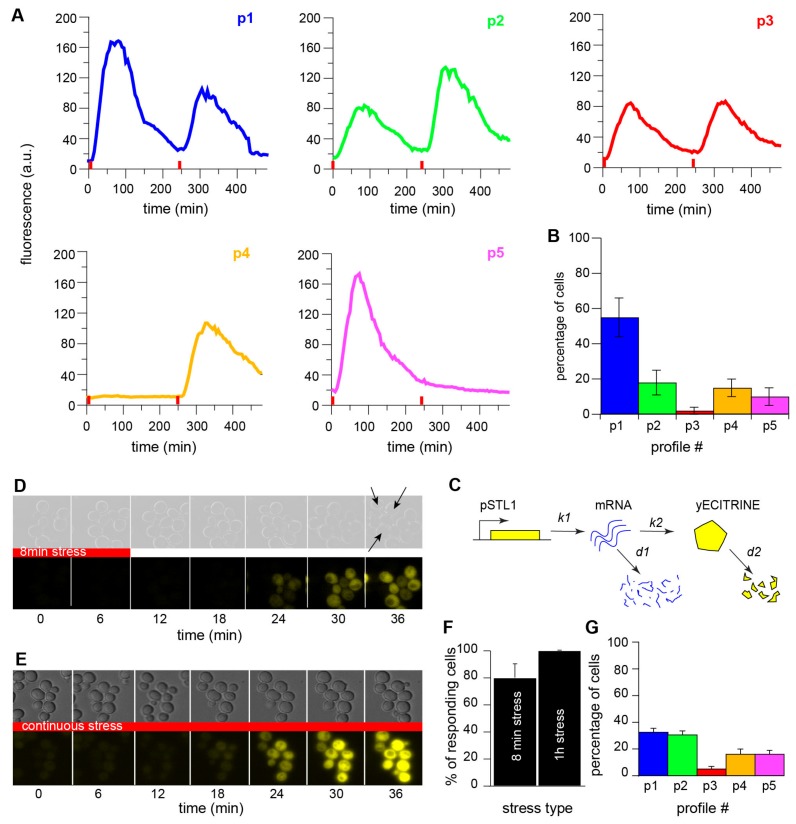
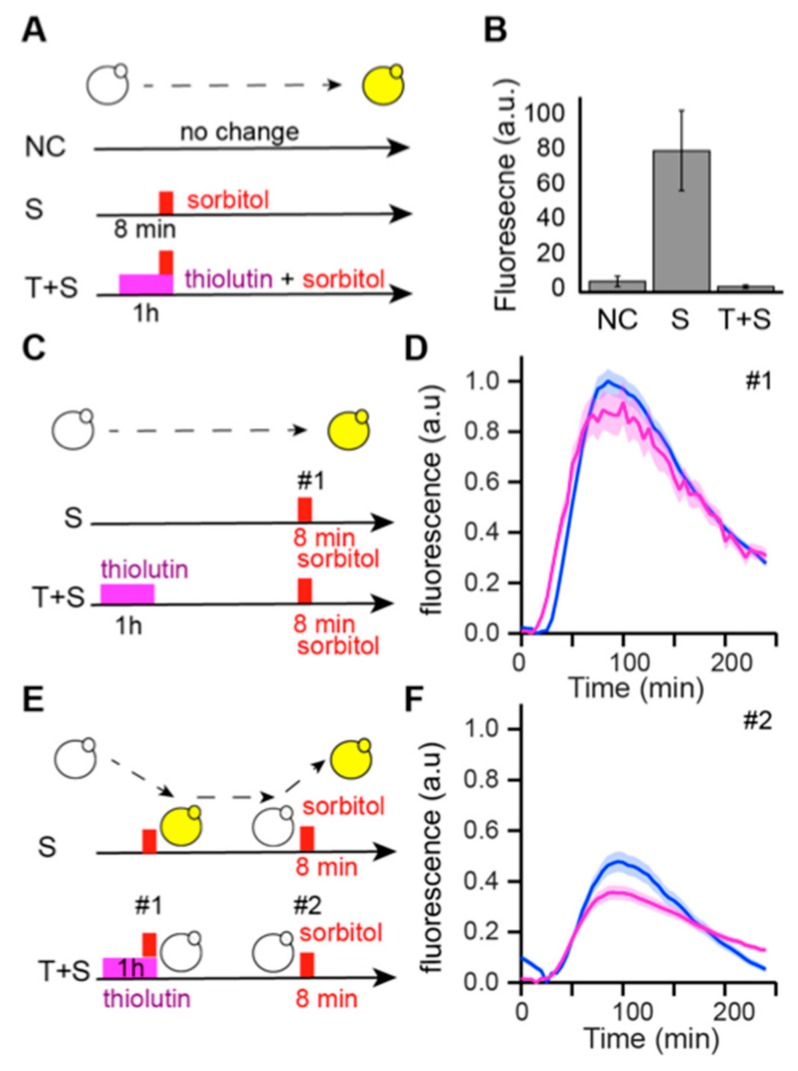
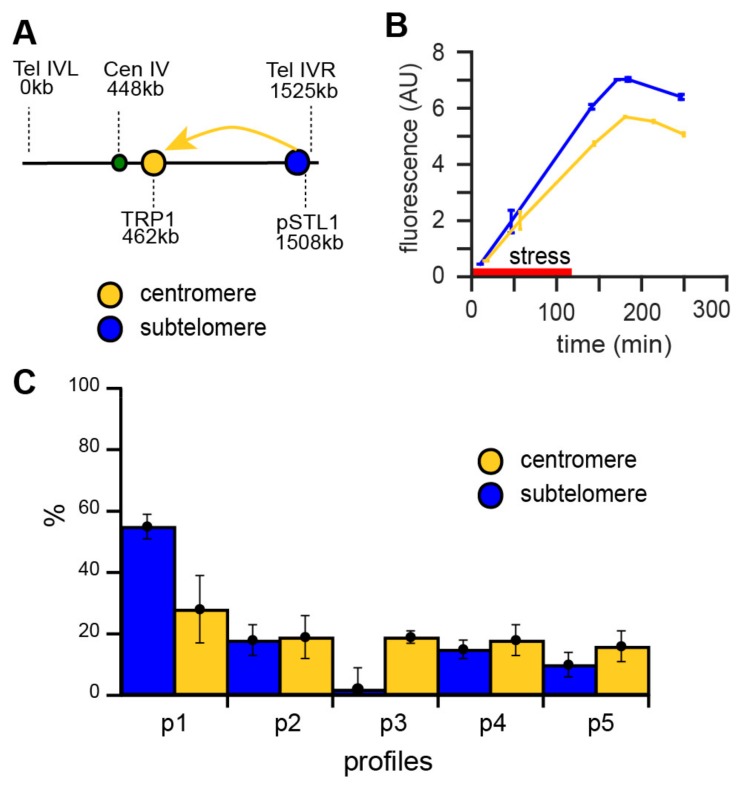
Cellular memory is a critical ability that allows microorganisms to adapt to potentially detrimental environmental fluctuations. In the unicellular eukaryote Saccharomyces cerevisiae, cellular memory can take the form of faster or slower responses within the cell population to repeated stresses. Using microfluidics and fluorescence time-lapse microscopy, we studied how yeast responds to short, pulsed hyperosmotic stresses at the single-cell level by analyzing the dynamic behavior of the stress-responsive STL1 promoter (pSTL1) fused to a fluorescent reporter. We established that pSTL1 exhibits variable successive activation patterns following two repeated short stresses. Despite this variability, most cells exhibited a memory of the first stress as decreased pSTL1 activity in response to the second stress. Notably, we showed that genomic location is important for the memory effect, since displacement of the promoter to a pericentromeric chromatin domain decreased the transcriptional strength of pSTL1 and led to a loss of memory. This study provides a quantitative description of a cellular memory that includes single-cell variability and highlights the contribution of chromatin structure to stress memory.

Keywords: cellular memory; chromosome organization; single cell; stress response; yeast.


Conflict of interest statement

The authors declare no conflict of interest.

Figures

Figure 1
Figure 1
(A) Experimental setup. We used multi-layer H-shaped microfluidic devices composed of two large 50 µm-high and 40-µm thick flow channels, with 400 µm × 400 µm × 3.7 µm observation chambers. Cells are trapped in the chambers and grow as a monolayer, which facilitates cell segmentation and tracking. The medium flowed through the channels diffuses into the chambers. Hyperosmotic stress-activated expression of pSTL1-yECRITRINE was triggered by exposure to 1 M sorbitol for 8 min. SC, synthetic complete medium. (B) Representative images of cells in the microfluidic chamber exposed to 8 min stress and left to recover for 4 h (240 min), scale bar, 5 µm. Cells were imaged every 5 min in bright light (20 ms exposure, upper row) and fluorescent light (200 ms exposure, lower row). (C) Fluorescent signals for individual cells exposed to two successive 8 min-stresses separated by 4 h. Hyperosmotic stress is indicated by the red bars, # 1 and # 2 indicate first and second stress, respectively. (D) Fluorescence responses of a population of n = 97 cells. The mean (± standard error of the mean) responses of cells to a first stress (blue), followed by a second stress 4 h later (red) are represented. Fluorescence levels were normalized to the fluorescence value before each corresponding stress. The fluorescence peak decreased from the first to the second stress. (E) Analyses of the temporal responses to two consecutive stresses in the same population. The duration between stress induction and peak fluorescence was similar for the first and second stresses.
Figure 2
Figure 2
(A) Examples of the five typical single-cell response profiles. Although the single-cell analysis revealed dynamic variability in the responses of single cells, we defined five typical response profiles (p1 to p5). (B) Single-cell clustering. Based on peak fluorescence values, the dynamic variability of the responses was clustered into five typical fluorescence responses. Errors bars represent the standard errors. A total of 708 cells were analyzed in three independent experiments. (C) Modeling of gene expression upon stress in a memory-free system. Stochastic simulations with the Gillespie algorithm were used to model transcription of the fluorescent reporter and protein translation upon stress. (D) Time series of images of cells subjected to 8 min stress. The arrows on the last bright field image show the cells that did not respond to the stress. (E) Time series of images of cells subjected to continuous stress. All cells responded to the stress. (F) Quantification of responsive cells. After exposure to 8 min stress, 80% of cells showed a response, whereas 100% of cells responded to 1 h stress. (G) Single-cell quantification of computed cells according to the five typical response profiles. In this case, the model includes a randomly selected transcription delay of between 0 and 10 min for each computed cell. This delay was also varied for the two stresses. The simulation was run twice and the peak fluorescence values were used to cluster the responses of the computed cells according to the five typical response profiles.
Figure 3
Figure 3
(A) Principle of the transcription inhibition experiment using thiolutin. Non-stressed cells received no sorbitol (NC) and stressed (S) cells were subjected to 8 min hyperosmotic stress (small red rectangle). (T + S) cells were treated with thiolutin for 1 h (pink rectangle) prior to and during stress. (B) Single-cell quantification of cellular fluorescence after 70 min under non-stress conditions (NC), hyperosmotic conditions (S) and hyperosmotic conditions in the presence of thiolutin (T + S). (C) Principle of the experiment to control thiolutin wash out. (Upper row). (S) cells were cultured in the microfluidic device for 4 h before being exposed to 8 min hyperosmotic stress. (Lower row) (T + S) cells were treated with the transcriptional inhibitor thiolutin for 1 h, thiolutin was washed out for 4 h and then cells were exposed to 8 min hyperosmotic stress. (D) pSTL1 fluorescence responses of cells treated (n = 101, pink) or untreated (n = 97, blue) with thiolutin after stress; similar responses were observed. Fluorescence levels were normalized to the peak fluorescence value of non-treated cells. (E) Principle of quantification of the memory effect in the presence of thiolutin. (S) cells were exposed to two 8 min hyperosmotic stresses 4 h apart. (T + S) cells were treated with thiolutin for 1 h and exposed to 8 min hyperosmotic stress, thiolutin was washed out for 4 h and cells were then exposed to a second 8 min stress. (F) Population quantification of stress memory for cells subjected to a first stress in the absence (blue) or presence of thiolutin (n = 101, pink). Fluorescence levels were normalized to the peak fluorescence value of the non-treated cells presented in (D).
Figure 4
Figure 4
(A) Displacement of pSTL1 towards the peri-centromere of chromosome IV. Sketch of the endogenous genomic position of pSTL1 on chromosome IV. The promoter was moved to the TRP1 locus on the same chromosome. Genomic positions are indicated in Kb. (B) Reduced activity of displaced pSTL1 in response to stress. Fluorescence quantification of promoter activity in response to 2 h hyperosmotic stress (red bar) for the endogenous promoter (blue) and displaced promoter (yellow). Data are mean ± standard deviation of triplicate experiments. (C) Displacement of pSTL1 leads to loss of the memory effect. Single-cell quantification of cells containing the displaced pSTL1 promoter in response to two hyperosmotic stresses. Response profiles were classified according to the five typical profiles in Figure 2.

Similar articles

Cited by

References

    1. Li S.J., Hua Z.S., Huang L.N., Li J., Shi S.H., Chen L.X., Kuang J.L., Liu J., Hu M., Shu W.S. Microbial communities evolve faster in extreme environments. Sci. Rep. 2014;4:6205. doi: 10.1038/srep06205. - DOI - PMC - PubMed
    1. Guan Q., Haroon S., Bravo D.G., Will J.L., Gasch A.P. Cellular memory of acquired stress resistance in Saccharomyces cerevisiae. Genetics. 2012;192:495–505. doi: 10.1534/genetics.112.143016. - DOI - PMC - PubMed
    1. Kundu S., Peterson C.L. Role of chromatin states in transcriptional memory. Biochim. Biophys. Acta. 2009;1790:445–455. doi: 10.1016/j.bbagen.2009.02.009. - DOI - PMC - PubMed
    1. Fabrizio P., Garvis S., Palladino F. Histone methylation and memory of environmental stress. Cells. 2019;8:339. doi: 10.3390/cells8040339. - DOI - PMC - PubMed
    1. D’Urso A., Brickner J.H. Epigenetic transcriptional memory. Curr. Genet. 2017;63:435–439. doi: 10.1007/s00294-016-0661-8. - DOI - PMC - PubMed

Publication types

LinkOut - more resources