. 2019 Jun 13;19(12):2678.
doi: 10.3390/s19122678.

Multispectral Depth-Resolved Fluorescence Lifetime Spectroscopy Using SPAD Array Detectors and Fiber Probes

Affiliations

Multispectral Depth-Resolved Fluorescence Lifetime Spectroscopy Using SPAD Array Detectors and Fiber Probes

João L Lagarto et al. Sensors (Basel). .

Abstract

Single Photon Avalanche Diode (SPAD) arrays are increasingly exploited and have demonstrated potential in biochemical and biomedical research, both for imaging and single-point spectroscopy applications. In this study, we explore the application of SPADs together with fiber-optic-based delivery and collection geometry to realize fast and simultaneous single-point time-, spectral-, and depth-resolved fluorescence measurements at 375 nm excitation light. Spectral information is encoded across the columns of the array through grating-based dispersion, while depth information is encoded across the rows thanks to a linear arrangement of probe collecting fibers. The initial characterization and validation were realized against layered fluorescent agarose-based phantoms. To verify the practicality and feasibility of this approach in biological specimens, we measured the fluorescence signature of formalin-fixed rabbit aorta samples derived from an animal model of atherosclerosis. The initial results demonstrate that this detection configuration can report fluorescence spectral and lifetime contrast originating at different depths within the specimens. We believe that our optical scheme, based on SPAD array detectors and fiber-optic probes, constitute a powerful and versatile approach for the deployment of multidimensional fluorescence spectroscopy in clinical applications where information from deeper tissue layers is important for diagnosis.

Keywords: CMOS; SPAD; depth-resolved fluorescence; fiber optics; fluorescence lifetime; fluorescence spectroscopy; tissue diagnosis.


Conflict of interest statement

The authors declare no conflict of interest.

Figures

Figure 1
Figure 1
(a) The optical layout of the instrument and fiber arrangement at the sample and detection ends and the electronic chain for instrument control, synchronization, and data acquisition. The dashed arrows indicate electronic connections. The excitation fiber is highlighted in blue; the detection fibers are numbered and highlighted in green. Numeration of the fibers increases with the distance to the excitation fiber. At the detection end, the fibers are arranged vertically and perpendicularly to the long axis of the Single Photon Avalanche Diode (SPAD) array. Detection fibers are imaged with a 1:1 magnification onto the SPAD detector. The distance to excitation fiber increases from top to bottom as indicated by the numeration. Fluorescence light is dispersed and spectrally resolved across the long axis of the detector using a transmission grating comprising 600 grooves/mm. L1: Aspheric lens, f = 11.0 mm (A220TM, Thorlabs); L2 and L3: Bi-Convex Lens, f = 60.0 mm (LB1723-B, Thorlabs). (b) An intensity map measured in the SPAD array for a representative fluorescence measurement of formalin-fixed rabbit aorta: The fluorescence intensity variation with depth and wavelength are plotted on the right and bottom, respectively.
Figure 2
Figure 2
Spectral distribution of the fluorescence signal with the distance from the excitation fiber measured in agarose phantoms of flavin adenine nucleotide (FAD) and 1,4-bis(5-phenyloxazol-2-yl) benzene (POPOP): (a) A diagram of the phantoms as described in Table 2: The black arrow indicates the direction of excitation light. (b) Intensity maps measured for the phantoms indicated in (i)–(iv). (c) Normalized intensity profiles per line in the SPAD array: The profiles are binned for each set of four lines of pixels. The curves on the top represent fluorescence signals collected by fibers closer to the excitation fiber. The sharp spurious peaks visible in the fluorescence spectra (e.g., phantoms (i) and (iv), bottom rows, 420 nm) are artefacts originating from data normalization and dark count subtraction. (d) Fluorescence emission spectra integrated over all rows of the SPAD detector for each phantom: The color of each curve corresponds to the colors in Figure 2c. (e) Intensity ratio calculated over the spectral bands 8–12 and 31–35 pixels, indicating the ratio of POPOP over that of FAD for each line of the array: Ratios closer to 1 indicate a higher contribution of POPOP to the fluorescence signal. The color legend for the phantoms are (i) green solid line; (ii) black circles; (iii) red plus sign; and (iv) blue crosses.
Figure 3
Figure 3
(a) A fluorescence lifetime phasor map of FAD and POPOP reference solutions (n = 100 measurements per solution). (b) Representative fluorescence intensity decays of phantom (ii) for each group of rows. (c) Phasor maps of FAD and POPOP phantoms (n = 100). Columns (i) to (iv) indicate phasor maps of corresponding phantoms as illustrated in Figure 2 and reported on top of each column. Each phasor map shows the phasor transformation of fluorescence decays binned for the rows indicated on the left and for a single spectral channel comprising all columns of the SPAD detector. The black dashed lines connect the center of FAD and POPOP phasor clouds obtained from reference solutions; see Figure 3a. (d) The ratio of POPOP to FAD for the top 16 lines of the SPAD array, calculated via lifetime phasors (filled circles) and fluorescence spectral data (empty circles). For lifetime phasors, data were binned for each 4 rows; for spectral data, data were binned for each 2 rows. Ratios closer to 1 indicate a higher contribution of POPOP to the fluorescence signal.
Figure 4
Figure 4
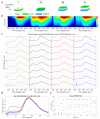
Fluorescence measurements of fixed rabbit aorta for the top 16 rows of the SPAD detector (n = 100 measurements). (a) A lifetime phasor map for the entire array, i.e., fluorescence decays were binned over the entire spectrum and the top 16 rows of the detector. The panel on the top right shows the zoomed phasor map of the area enclose by the black dashed rectangle. The arrows indicate clusters of phasors that were formed from data obtained at different wavelengths. The color of each arrow represents a spectra channel as indicated in Figure 4b. (b) Integrated fluorescence spectrum. (c) Variation of fluorescence spectra with probed depth. (d) Fluorescence lifetime phasor maps for spectral channels identified in Figure 4b and within the region demarcated by the dashed rectangle in Figure 4a. For each spectral channel, fluorescence decays were binned by distance from the excitation fiber, which is indicated by the color gradient of the phasor. Lighter colors represent data from collection fibers closer to the excitation and thus emanating from the most superficial layers of the tissue.

Similar articles

Cited by

References

    1. Gillenwater A., Jacob R., Ganeshappa R., Kemp B., El-Naggar A.K., Palmer J.L., Clayman G., Mitchell M.F., Richards-Kortum R. Noninvasive diagnosis of oral neoplasia based on fluorescence spectroscopy and native tissue autofluorescence. Arch. Otolaryngol. Head Neck Surg. 1998;124:1251–1258. doi: 10.1001/archotol.124.11.1251. - DOI - PubMed
    1. Gillenwater A., Jacob R., Richards-kortum R. Fluorescence spectroscopy: A technique with potential to improve the early detection of aerodigestive tract neoplasia. Head Neck. 1998;20:556–562. doi: 10.1002/(SICI)1097-0347(199809)20:6<556::AID-HED11>3.0.CO;2-O. - DOI - PubMed
    1. Wu Y., Xi P., Qu J., Cheung T.-H., Yu M.-Y. Depth-resolved fluorescence spectroscopy reveals layered structure of tissue. Opt. Express. 2004;12:3218–3223. doi: 10.1364/OPEX.12.003218. - DOI - PubMed
    1. Wu Y., Qu J.Y. Autofluorescence spectroscopy of epithelial tissues. J. Biomed. Opt. 2006;11:054023. doi: 10.1117/1.2362741. - DOI - PubMed
    1. Yuvaraj M., Udayakumar K., Jayanth V., Prakasa Rao A., Bharanidharan G., Koteeswaran D., Munusamy B.D., Murali Krishna C., Ganesan S. Fluorescence spectroscopic characterization of salivary metabolites of oral cancer patients. J. Photochem. Photobiol. B Biol. 2014;130:153–160. doi: 10.1016/j.jphotobiol.2013.11.006. - DOI - PubMed

LinkOut - more resources