. 2019 Jun 14;11(1):9.
doi: 10.1186/s11689-019-9266-0.

Lesser suppression of response to bright visual stimuli and visual abnormality in children with autism spectrum disorder: a magnetoencephalographic study

Affiliations

Lesser suppression of response to bright visual stimuli and visual abnormality in children with autism spectrum disorder: a magnetoencephalographic study

Sho Aoki et al. J Neurodev Disord. .

Abstract

Background: Visual abnormality is a common sensory impairment in autism spectrum disorder (ASD), which may cause behavioral problems. However, only a few studies exist on the neural features corresponding to the visual symptoms in ASD. The purpose of this study was to investigate the relationship between cortical responses to visual stimuli and visual abnormality to examine the neurophysiological mechanisms of the visual abnormality in ASD.

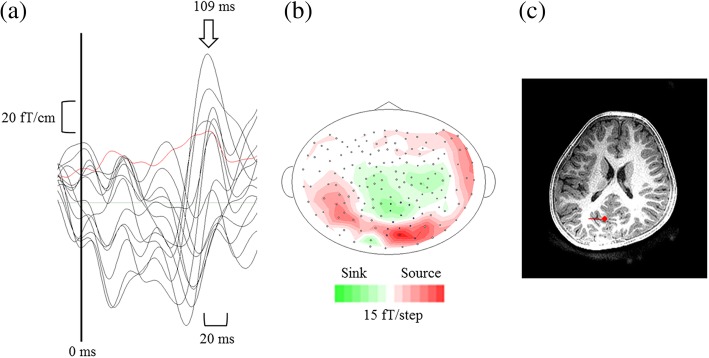
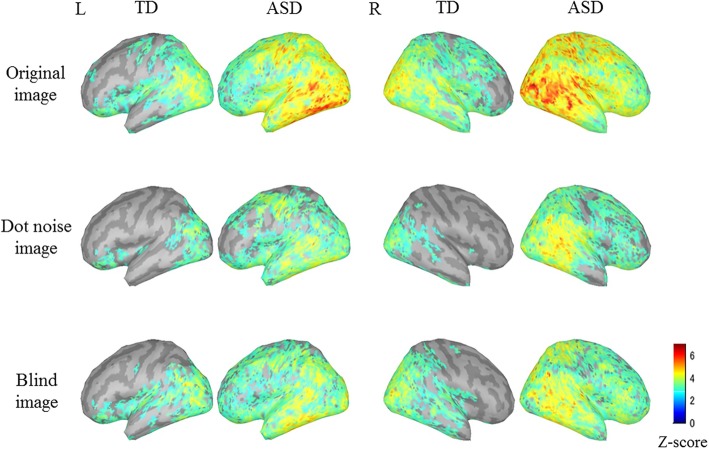
Methods: Twenty-two high-functioning children with ASD (10.95 ± 2.01 years old) and 23 age-matched typically developing (TD) children (10.13 ± 2.80 years old) participated in this study. We measured the cortical responses (i.e., activated intensity and attenuation ratio) elicited by the Original visual image and other two types of bright images (the Dot noise or Blind image, which includes overlapped particles onto the Original image or the enhanced-brightness version of the Original image, respectively) using magnetoencephalography.

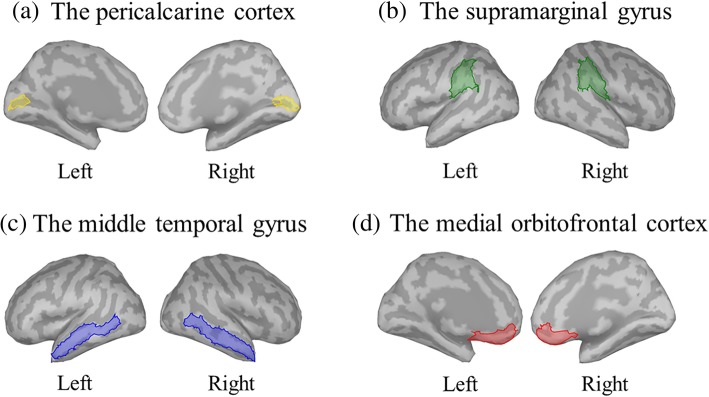
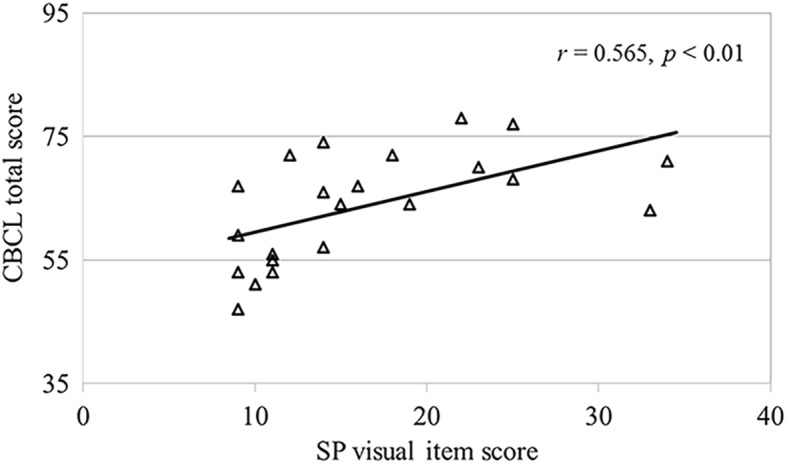
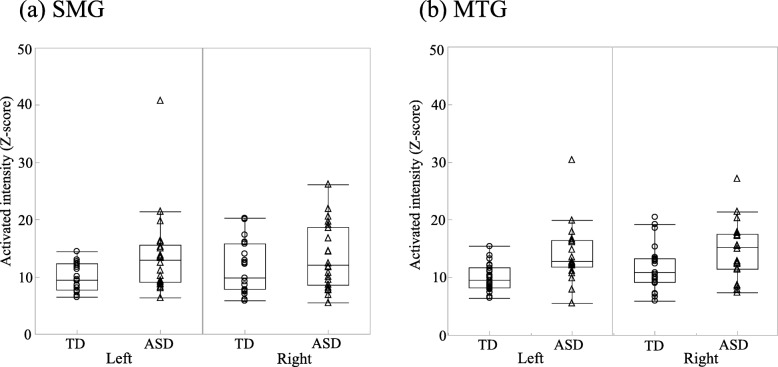
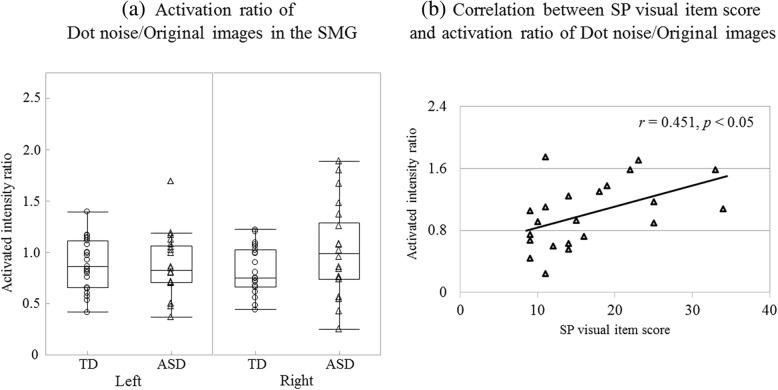
Results: The severity of visual abnormalities was significantly associated with behavioral problems in children with ASD. In addition, we found the increased cortical activation in response to the Original image in the left supramarginal gyrus (SMG) and middle temporal gyrus in children with ASD. However, there were no inter-group differences in the primary visual and medial orbitofrontal cortices. Furthermore, when we compared cortical responses according to the type of images, children with ASD showed lesser attenuation of the activated intensities than children with TD in response to the bright images compared with the Original image in the right SMG. These attenuation ratios (Dot noise/Original and Blind/Original) were also associated with the severity of visual abnormalities.

Conclusions: Our results show that dysfunction of stimulus-driven neural suppression plays a crucial role in the neural mechanism of visual abnormality in children with ASD. To the best of our knowledge, this is the first magnetoencephalography study to demonstrate the association between the severity of visual abnormality and lower attenuation ratios in children with ASD. Our results contribute to the knowledge of the mechanisms underlying visual abnormality in children with ASD, and may therefore lead to more effective diagnosis and earlier intervention.

Keywords: Autism spectrum disorders (ASD); Bright visual stimuli; Magnetoencephalography (MEG); Neural suppression; Supramarginal gyrus (SMG); Visual abnormality.


Conflict of interest statement

The authors declare that they have no competing interests.

Figures

Fig. 1
Fig. 1
Visual stimuli and trial timeline. Visual stimuli consisted of three types of pictures. The picture a is the Original image. The picture b is the Dot noise image, which involved superimposed bright dots on the Original image. The picture c is the Blind image, which is obtained after enhancing the luminance of the Original image. To determine whether the participants are alert, they are instructed to press the button for the cue picture d
Fig. 2
Fig. 2
Representative figures of visual evoked fields (VEFs). The VEFs for the Original image in a child with TD have been shown. a VEF waveforms from the 13–15 sensors in the primary visual cortex. Root mean square values have been presented by a red waveform. The arrow represents the M100 peak. The X-axis indicates the latency in ms. The Y-axis indicates the amplitude in fT. b Isomagnetic field maps at the M100 peak. c Dipole sources overlaid on the individual magnetic resonance images of the participants. Typically developing (TD)
Fig. 3
Fig. 3
Regions of interest. Regions of interest, including the a bilateral pericalcarine cortex (PCAL), b supramarginal gyrus (SMG), c middle temporal gyrus (MTG), and d medial orbitofrontal cortex (mOFC), were determined with the Desikan-Killiany atlas
Fig. 4
Fig. 4
Correlation between the SP visual score and CBCL total score for the ASD group. The severity of visual abnormalities was associated with the seriousness of behavioral problems (p < 0.01). Sensory profile (SP); Child Behavior Checklist (CBCL); autism spectrum disorder (ASD)
Fig. 5
Fig. 5
Grand-average cortical activation in response to each image for each group. The mean cortical activation from 200 to 400 ms after stimulus onset are indicated on the normalized brain surface for each group. The activation patterns at the occipital, temporal, and parietal cortices in the TD group have been shown. These activations were decreased in the case of bright (Dot noise and Blind) images compared with the Original image. The cortical activation in response to the Original image increased in the ASD group compared with that in the TD group. The attenuation of the response to bright image in the ASD group weakened compared with that in the TD group. Typically developing (TD); autism spectrum disorder (ASD)
Fig. 6
Fig. 6
Activated intensities in response to the Original image for each group. a Activated intensities in response to the Original image in the left SMG between 180 and 380 ms were increased in the ASD group compared with the TD group (p < 0.05). b Activated intensities in response to the Original image in the left MTG between 200 and 400 ms were significantly increased in the ASD group compared with the TD group (Left: p < 0.006, Right: p < 0.05). Supramarginal gyrus (SMG); autism spectrum disorder (ASD); typically developing (TD); middle temporal gyrus (MTG)
Fig. 7
Fig. 7
Attenuation of the response to the Dot noise image and abnormal visual sensitivity. a In the right SMG, the activation ratio of Dot noise/Original images between 180 and 380 ms was increased in the ASD group compared with the TD group (p < 0.05). This indicates that the attenuation of the response to the Dot noise image in the ASD group was weaker. b Correlation between the SP visual item score and activation ratio for the ASD group. The patients with ASD exhibiting more severe visual abnormalities showed greater activated intensities in response to the Dot noise image (p < 0.05). Supramarginal gyrus (SMG); autism spectrum disorder (ASD); typically developing (TD); Sensory Profile (SP)

References

    1. American Psychiatric Association. Diagnostic and Statistical Manual of Mental Disorders. 5th ed. Washington, DC: American Psychiatric Publishing, Inc; 2013.
    1. Baranek GT, David FJ, Poe MD, Stone WL, Watson LR. Sensory experiences questionnaire: discriminating sensory features in young children with autism, developmental delays, and typical development. J Child Psychol Psychiatry. 2006;47:591–601. doi: 10.1111/j.1469-7610.2005.01546.x. - DOI - PubMed
    1. Nieto C., López B., Gandía H. Relationships between atypical sensory processing patterns, maladaptive behaviour and maternal stress in Spanish children with autism spectrum disorder. Journal of Intellectual Disability Research. 2017;61(12):1140–1150. doi: 10.1111/jir.12435. - DOI - PubMed
    1. Tomchek SD, Dunn W. Sensory processing in children with and without autism: a comparative study using the short sensory profile. Am J Occup Ther. 2007;61:190–200. doi: 10.5014/ajot.61.2.190. - DOI - PubMed
    1. Lane AE, Young RL, Baker AEZ, Angley MT. Sensory processing subtypes in autism: association with adaptive behavior. J Autism Dev Disord. 2010;40:112–122. doi: 10.1007/s10803-009-0840-2. - DOI - PubMed

Publication types

MeSH terms