

Exploring the association of anthropometric indicators for under-five children in Ethiopia
- PMID: 31200695
- PMCID: PMC6570903
- DOI: 10.1186/s12889-019-7121-6
Exploring the association of anthropometric indicators for under-five children in Ethiopia
Abstract
Background: Child undernutrition is a global health concern. Many studies have focused on the association of childhood undernutrition indicators with their predictors. A few studies have looked at relationship between the undernutrition indicators. This study aimed at investigating the possible association structures of childhood undernutrition indicators.
Methods: A log-linear model of cell counts of a three way table of stunting, wasting, and underweight was fitted based on the 2016 Ethiopia demographic health survey data. The variables of interest were generated based on the 2006 WHO Child Growth Standards as: stunted, wasted and underweight if z-scores of height-for-age, weight-for-height and weight-for age are below-2, respectively; otherwise not stunted, wasted and underweight.
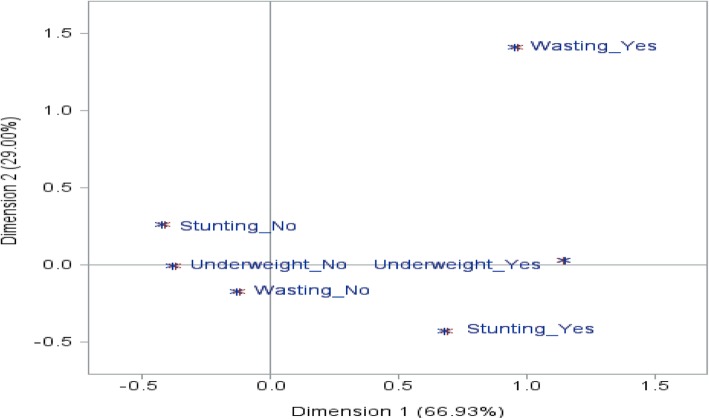
Results: This study showed that 36.34, 12.09 and 24.87% were stunted, wasted and underweight out of sampled children respectively and the prevalence of total undernutrition in children was about 45.96%.The fitted log-linear model showed that underweight was associated with both stunting (P-value< 0.001), and wasting (P-value< 0.001). There was no association between stunting and wasting (P-value = 0.999). Furthermore, the model showed that there is no a three way interaction among stunting, wasting, and underweight (P-value = 1.000).
Conclusion: The authors conclude that there is lack of three way association of stunting, wasting, and underweight. This confirms that the three anthropometric indicators of children have multi-dimensional nature. Thus, the concerned body should consider the three undernutrition indicators simultaneously to estimate the actual burden of childhood undernourishment as they are not redundant of each other.
Keywords: Interaction; Log-linear model; Stunting; Undernutrition; Underweight; Wasting.
Conflict of interest statement
The authors declare that they have no competing interests.
Figures
References
-
- WHO . The World Health Organization child growth standards. 2016.
-
- United Nations Children’s Fund WHO, World Bank Group . UNICEF/WHO/World Bank Group New York, NY. 2017. Levels and Trends in Child Malnutrition—UNICEF/WHO/World Bank Group Joint Child Malnutrition Estimates.
-
- Cintron C, Seff I, Baird S. Dynamics of wasting and underweight in Ethiopian children. Ethiop J Econ. 2016;25(2):113–170.
-
- WHO . World health organization. 2018.
MeSH terms
LinkOut - more resources
Full Text Sources
Medical
