. 2019 Jul 9;117(1):170-183.
doi: 10.1016/j.bpj.2019.05.020. Epub 2019 May 28.

Mechanochemical Coupling and Junctional Forces during Collective Cell Migration

Affiliations

Mechanochemical Coupling and Junctional Forces during Collective Cell Migration

Justin Bui et al. Biophys J. .

Abstract

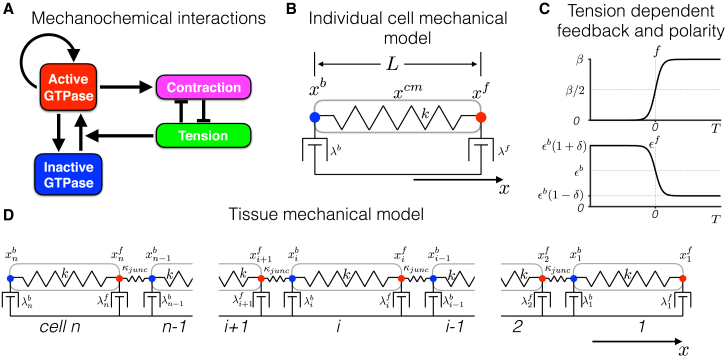
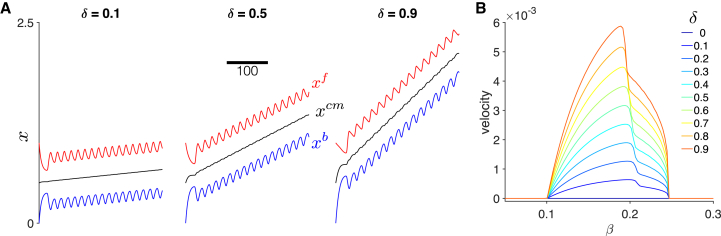
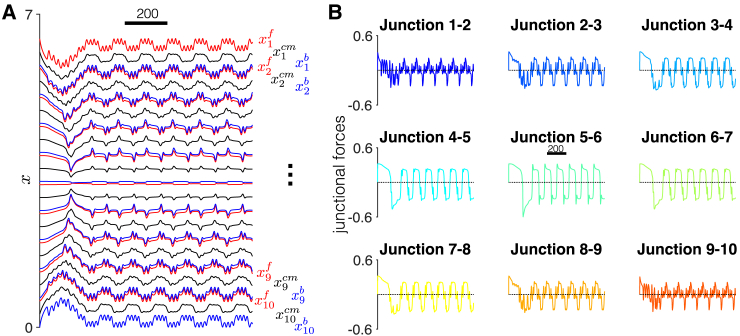
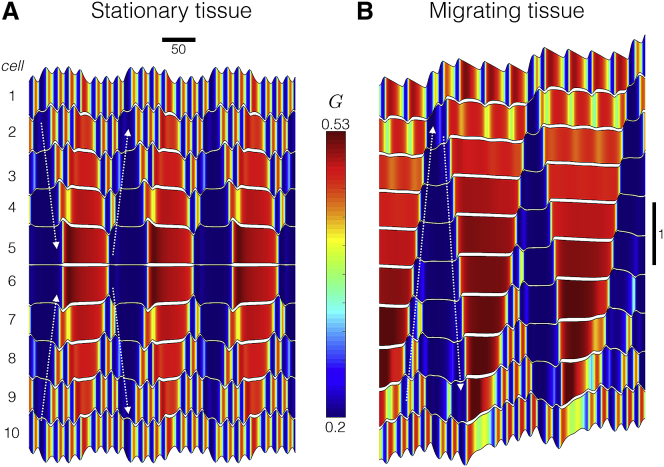
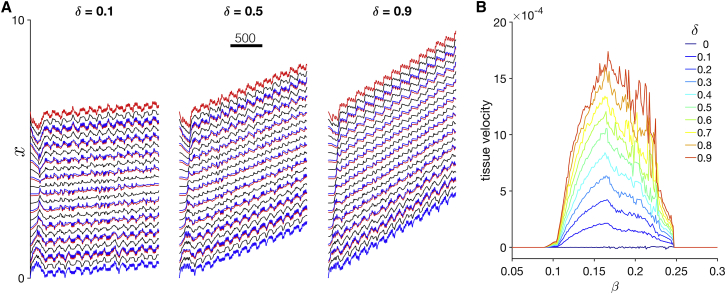
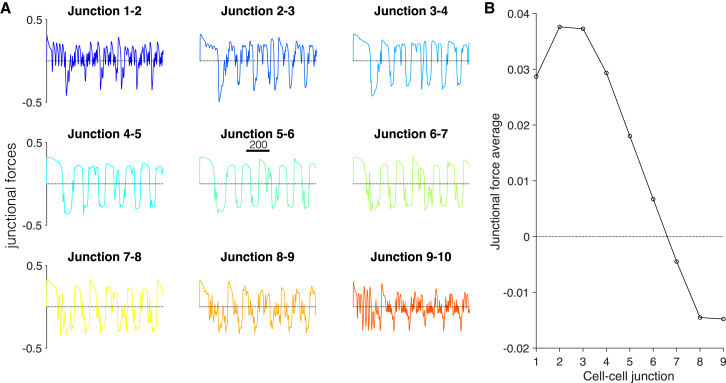
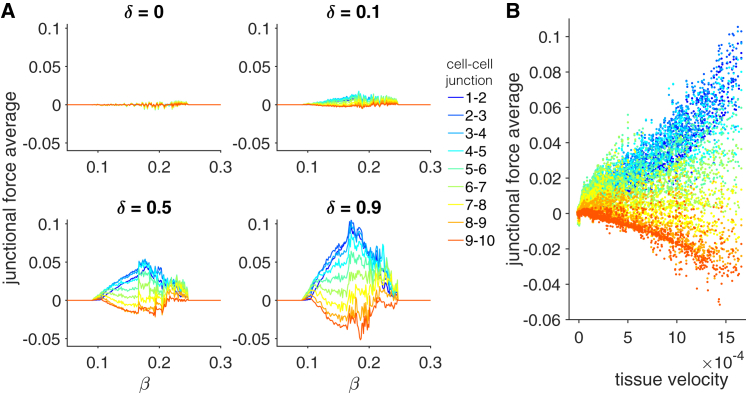
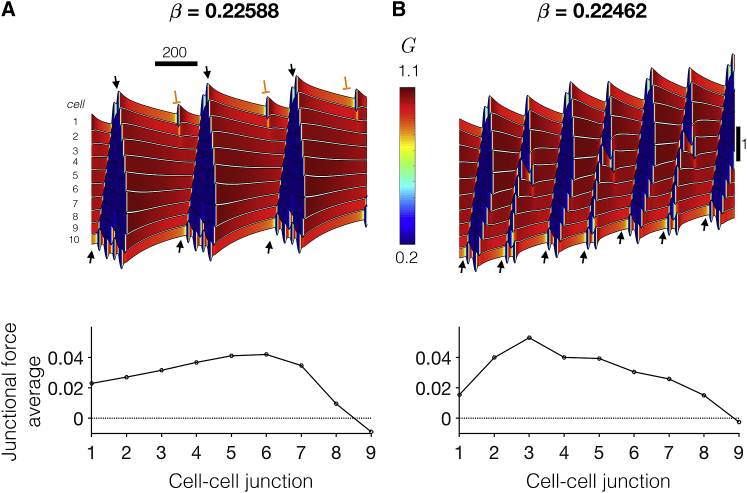
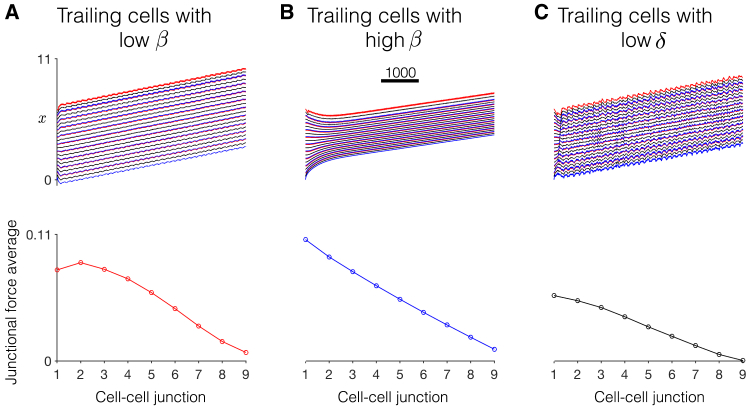
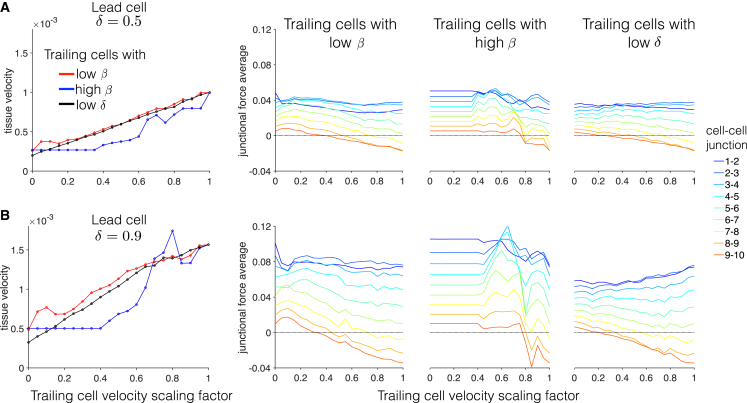
Cell migration, a fundamental physiological process in which cells sense and move through their surrounding physical environment, plays a critical role in development and tissue formation, as well as pathological processes, such as cancer metastasis and wound healing. During cell migration, dynamics are governed by the bidirectional interplay between cell-generated mechanical forces and the activity of Rho GTPases, a family of small GTP-binding proteins that regulate actin cytoskeleton assembly and cellular contractility. These interactions are inherently more complex during the collective migration of mechanically coupled cells because of the additional regulation of cell-cell junctional forces. In this study, we adapted a recent minimal modeling framework to simulate the interactions between mechanochemical signaling in individual cells and interactions with cell-cell junctional forces during collective cell migration. We find that migration of individual cells depends on the feedback between mechanical tension and Rho GTPase activity in a biphasic manner. During collective cell migration, waves of Rho GTPase activity mediate mechanical contraction/extension and thus synchronization throughout the tissue. Further, cell-cell junctional forces exhibit distinct spatial patterns during collective cell migration, with larger forces near the leading edge. Larger junctional force magnitudes are associated with faster collective cell migration and larger tissue size. Simulations of heterogeneous tissue migration exhibit a complex dependence on the properties of both leading and trailing cells. Computational predictions demonstrate that collective cell migration depends on both the emergent dynamics and interactions between cellular-level Rho GTPase activity and contractility and multicellular-level junctional forces.


Figures

Figure 1
Figure 1
Individual cell and tissue mechanochemical models. (A) A diagram of mechanochemical interactions between active and inactive Rho GTPase levels and mechanical contraction and tension is shown and is adapted from Zmurchok et al. (19). (B) The mechanical model of an individual cell is shown. The model governs the position of the cell front (xf), back (xb), and center of mass (xcm) ((1d), (1e)). The cell is represented by a Hookean spring, with spring constant k, and dashpots at the cell front and back with constants λf and λb, respectively. (C) (Top) Tension-dependent GTPase activation f(T;β) (Eq. 1 b) and (bottom) tension-dependent front-back polarity ϵf(T;δ) (Eq. 1 f) are shown as functions of cellular tension T. (D) The mechanical model of n mechanically coupled cells is shown. The model governs the positions of cell fronts (xif) and backs (xib) for i=1,,n ((2a), (2b), (2c), (2d), (2e)). Key differences between our model and that of Zmurchok et al. (19) include the fact that 1) cell front and back dashpot constants (λf and λb) are not equal, 2) λf is cell tension dependent (via Eq. 1 f), and 3) cell-cell mechanical junctions are represented by Hookean springs, with spring constant κjunc. To see this figure in color, go online.
Figure 2
Figure 2
Dynamics of a migrating individual cell. (A) The time course for cell position (front (red) xf, center (black) xcm, and back (blue) xb) are shown for different values of front-back polarity parameter δ. Cell migration velocity increases for increasing δ. (B) Cell migration velocity is shown as a function of tension-feedback parameter β for different values of δ. Velocity is zero in the nonoscillatory β regime and a biphasic function of β in the oscillatory β regime. Parameters are (A) β = 0.16. To see this figure in color, go online.
Figure 3
Figure 3
Dynamics of a stationary tissue. (A) The time course for cell positions (front (red) xif, center (black) xicm, and back (blue) xib for i=1,2,,n=10) are shown. The time courses exhibit a front-back symmetry and two distinct frequencies, corresponding to the individual cellular contraction and extension and an emergent frequency from cell-cell mechanical coupling. (B) The time course for each cell-cell junction also exhibits multiple frequencies and periods of both tension and compression. Parameters are tension-feedback β = 0.16 and front-back polarity, δ = 0. To see this figure in color, go online.
Figure 4
Figure 4
Dynamics of Rho GTPase activity in homogeneous tissue. Kymographs show the time course for cell positions (black), and color indicates Rho GTPase activity in each cell (Gi, for i=1,2,,n=10) in (A) stationary and (B) migrating tissue. Note that time is on the horizontal axis. Parameters are tension-feedback β = 0.16 and (A) front-back polarity, δ = 0, (B) δ = 0.9. To see this figure in color, go online.
Figure 5
Figure 5
Dynamics of collective cell migration in homogeneous tissue. (A) The time course for cell positions (front (red) xif, center (black) xicm, and back (blue) xib for i=1,2,,n=10) are shown for different values of front-back polarity parameter δ. Collective cell migration velocity increases for increasing δ. (B) Tissue migration velocity is shown as a function of feedback-tension parameter β for different values of δ. Velocity is zero in the nonoscillatory β regime and a generally biphasic but jagged function of β in the oscillatory β regime. Parameters are (A) β = 0.16. To see this figure in color, go online.
Figure 6
Figure 6
Spatial pattern of junctional forces in collective cell migration. (A) The time course of each cell-cell junction exhibits multiple frequencies, in particular at the tissue periphery. (B) The junction force average is shown as a function of the cell-cell junction (with one corresponding to the cell 1-cell 2 junction at the tissue front). The junctional force average exhibits a maximal near, but not at, the tissue front and then decreases toward the tissue back. Parameters are β = 0.16 and δ = 0.5. To see this figure in color, go online.
Figure 7
Figure 7
Spatial pattern of junctional forces depends on tension-feedback and front-back polarity. (A) Junctional force averages are shown for all cell-cell junction pairs as a function of tension-feedback β for different values of front-back polarity δ. For migratory tissues (δ > 0), junctional force averages in general decrease from the tissue front (cell 1-cell 2 junction) to the tissue back. The magnitude of junctional force averages generally increases with increasing δ and follows a jagged biphasic dependence on β. (B) A scatter plot of the junctional force averages for different cell-cell junction pairs (different colors) against the corresponding tissue velocity, calculated from simulations for varying β and δ demonstrate that larger magnitude junctional forces occur for faster collective cell migration. To see this figure in color, go online.
Figure 8
Figure 8
Mechanochemical resonance during collective cell migration. Kymographs show the time course for cell positions (black), and color indicates Rho GTPase activity for two values of tension-feedback parameter β (A and B) that differ by ∼1%. Successful and failed mechanical wave propagation are denoted by black arrows and orange block symbols, respectively. (Bottom) The spatial pattern of junctional force averages for the two examples is shown. Parameters are front-back polarity δ = 0.9. To see this figure in color, go online.
Figure 9
Figure 9
Dynamics of collective cell migration in heterogeneous tissue. (Top) The time course for cell positions (front (red) xif, center (black) xicm, and back (blue) xib for i=1,2,,n=10) are shown for different trailing cell properties, relative to the lead cell, with (A) low β, (B) high β, and (C) low δ trailing cells. See the text for details. (Bottom) The spatial pattern of junctional force averages as a function of the cell-cell junction is shown. Parameters are lead cell: δ = 0.9, β = 0.16. Trailing cells have a scaling factor of 0.2: (A) δ = 0.9, β = 0.1082, (B) δ = 0.9, β = 0.2454, and (C) δ = 0.1885, β = 0.16. To see this figure in color, go online.
Figure 10
Figure 10
Summary of heterogeneous tissue cell migration properties. (Left) For lead cells with δ = (A) 0.5 and (B) 0.9, tissue velocity is shown against the trailing cell velocity scaling factor for low β (red), high β (blue), and low δ (black) trailing cells. See the text for details. (Right) Junction force averages are shown for all cell-cell junction pairs as a function of the trailing cell velocity scaling factor. Parameters are lead cell: β = 0.16. The tissue size comprises 10 cells. To see this figure in color, go online.

Similar articles

Cited by

References

    1. Rørth P. Collective cell migration. Annu. Rev. Cell Dev. Biol. 2009;25:407–429. - PubMed
    2. Rorth, P. 2009. Collective cell migration. Annu. Rev. Cell Dev. Biol. 25:407-429. - PubMed
    1. Friedl P., Hegerfeldt Y., Tusch M. Collective cell migration in morphogenesis and cancer. Int. J. Dev. Biol. 2004;48:441–449. - PubMed
    2. Friedl, P., Y. Hegerfeldt, and M. Tusch. 2004. Collective cell migration in morphogenesis and cancer. Int. J. Dev. Biol. 48:441-449. - PubMed
    1. Friedl P., Gilmour D. Collective cell migration in morphogenesis, regeneration and cancer. Nat. Rev. Mol. Cell Biol. 2009;10:445–457. - PubMed
    2. Friedl, P., and D. Gilmour. 2009. Collective cell migration in morphogenesis, regeneration and cancer. Nat. Rev. Mol. Cell Biol. 10:445-457. - PubMed
    1. Weinberg S.H., Mair D.B., Lemmon C.A. Mechanotransduction dynamics at the cell-matrix interface. Biophys. J. 2017;112:1962–1974. - PMC - PubMed
    2. Weinberg, S. H., D. B. Mair, and C. A. Lemmon. 2017. Mechanotransduction dynamics at the cell-matrix interface. Biophys. J. 112:1962-1974. - PMC - PubMed
    1. Goehring N.W., Grill S.W. Cell polarity: mechanochemical patterning. Trends Cell Biol. 2013;23:72–80. - PubMed
    2. Goehring, N. W., and S. W. Grill. 2013. Cell polarity: mechanochemical patterning. Trends Cell Biol. 23:72-80. - PubMed

Publication types

Substances

LinkOut - more resources