. 2019 Aug 9;18(8 suppl 1):S15-S25.
doi: 10.1074/mcp.RA118.001260. Epub 2019 Jun 14.

TCPA v3.0: An Integrative Platform to Explore the Pan-Cancer Analysis of Functional Proteomic Data

Affiliations

TCPA v3.0: An Integrative Platform to Explore the Pan-Cancer Analysis of Functional Proteomic Data

Mei-Ju May Chen et al. Mol Cell Proteomics. .

Abstract

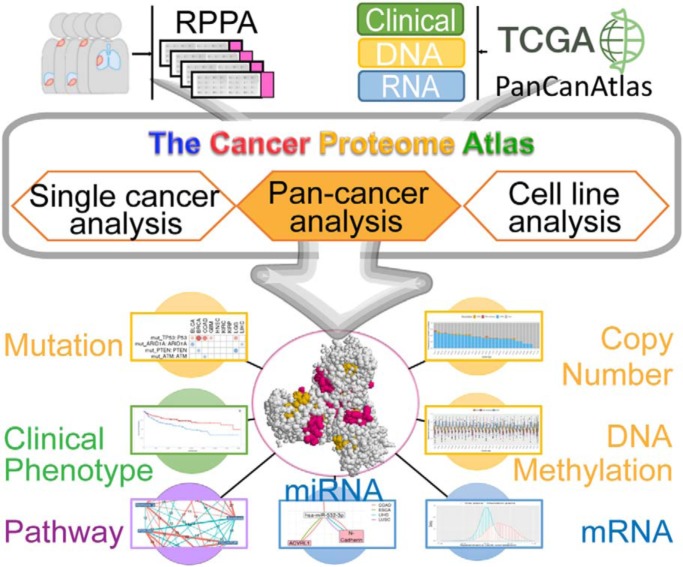
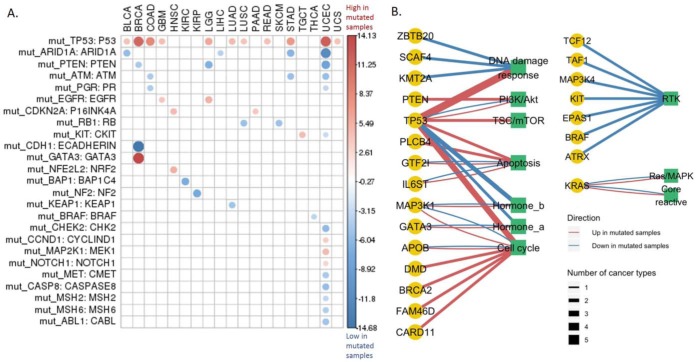
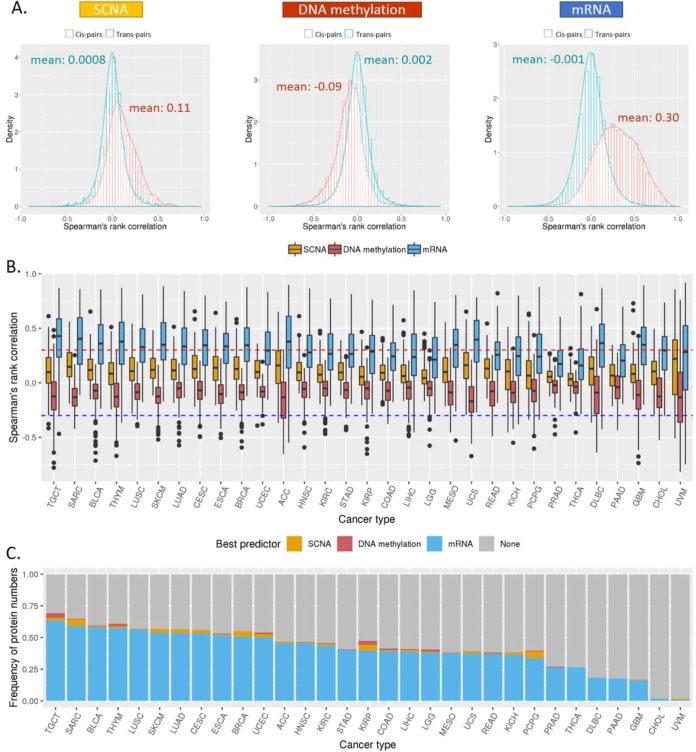
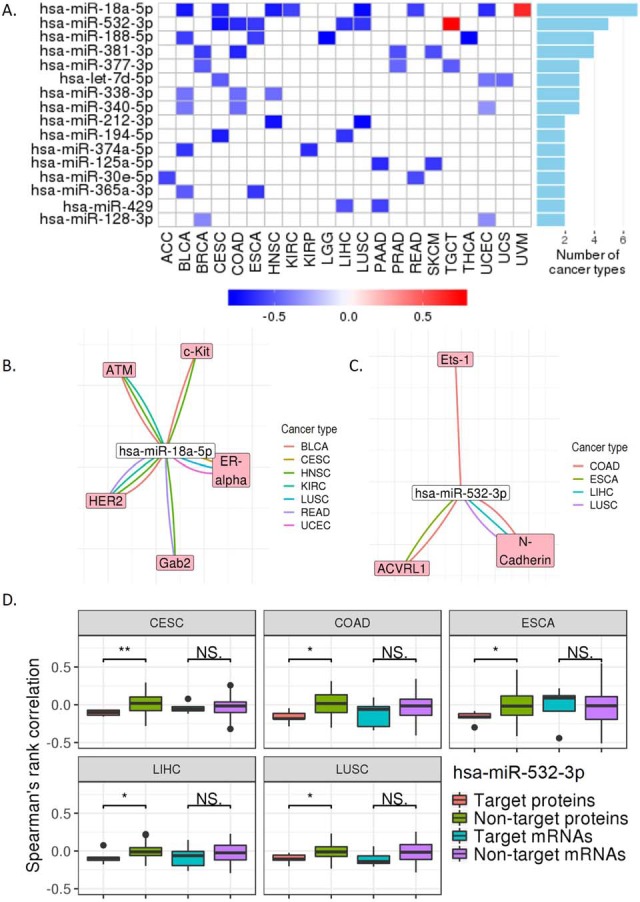
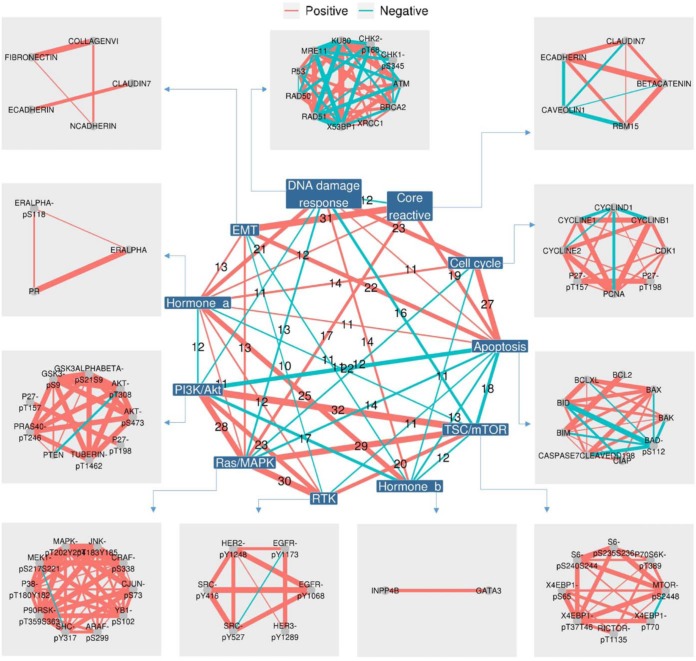
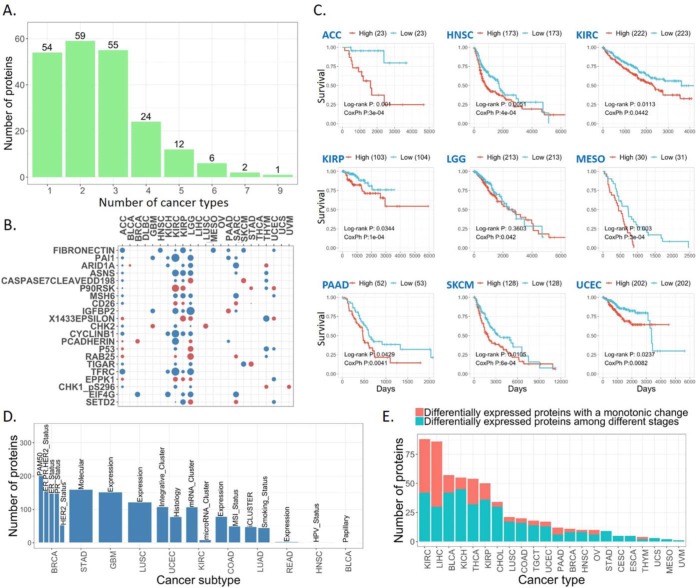
Reverse-phase protein arrays represent a powerful functional proteomics approach to characterizing cell signaling pathways and understanding their effects on cancer development. Using this platform, we have characterized ∼8,000 patient samples of 32 cancer types through The Cancer Genome Atlas and built a widely used, open-access bioinformatic resource, The Cancer Proteome Atlas (TCPA). To maximize the utility of TCPA, we have developed a new module called "TCGA Pan-Cancer Analysis," which provides comprehensive protein-centric analyses that integrate protein expression data and other TCGA data across cancer types. We further demonstrate the value of this module by examining the correlations of RPPA proteins with significantly mutated genes, assessing the predictive power of somatic copy-number alterations, DNA methylation, and mRNA on protein expression, inferring the regulatory effects of miRNAs on protein expression, constructing a co-expression network of proteins and pathways, and identifying clinically relevant protein markers. This upgraded TCPA (v3.0) will provide the cancer research community with a more powerful tool for studying functional proteomics and making translational impacts.

Keywords: Bioinformatics Software; Biomarker: Prognostic; Cancer Biology; Functional Proteomics; Gene Expression; Pan-Cancer Analysis; Pathway Analysis; Protein Array; Proteogenomics; TCGA.


Conflict of interest statement

G.B.M. has sponsored research support from AstraZeneca, Critical Outcomes Technology, Karus, Illumina, Immunomet, Nanostring, Tarveda, and Immunomet and is on the Scientific Advisory Board for AstraZeneca, Critical Outcomes Technology, ImmunoMet, Ionis, Nuevolution, Symphogen, and Tarveda. H.L. is a shareholder and scientific advisor of Precision Scientific Ltd., (Beijing, China) and Eagle Nebula Inc

Figures

None
Graphical abstract
Fig. 1.
Fig. 1.
Overview of TCPA v3.0. KIRC, kidney renal clear cell carcinoma; LGG, low-grade glioma; MESO, mesothelioma; PFI, progression-free survival interval; BRCA, breast invasive carcinoma; UCEC, uterine corpus endometrial carcinoma; Meth., DNA methylation.
Fig. 2.
Fig. 2.
Protein expression affected by significantly mutated genes. (A) Protein expression change of the 299 SMGs across cancer types. Student's t test followed by multiple testing correction (FDR) was used to identify differentially expressed proteins among the mutated and wild-type groups defined by the mutational status of a gene. Only the differentially expressed proteins with FDR < 0.1 are shown. The circle size indicates the level of differential expression based on the t statistic values. The red/blue color indicates high/low protein expression in the mutated group. (B) Pathway activity impacted by the SMGs. Nodes are shaped and colored according to the data types. The yellow circles indicate the SMGs, and the green squares indicate the cancer pathways. The links between nodes are colored in red/blue to represent the up-/down-regulation of the pathway in the mutated group of an SMG. The line thickness represents how many cancer types show a significant correlation, and only those relationships observed in at least two cancer types are shown.
Fig. 3.
Fig. 3.
Correlations of protein expression with mRNA, SCNA, and DNA methylation. (A) Histogram of Spearman's rank correlation (ρ values) between protein abundance and the three features (mRNA, SCNA, and DNA methylation) across cancer types. The red bars and curve represent the cis-pairs of protein–feature that are associated with the same gene. The green bars and curve represent the background of ρ values constructed from the trans-pairs in the same dataset. (B) Box plots of the ρ values for the three features across cancer types. The dotted lines indicate a correlation magnitude of 0.3 (sign independent). (C) Bar plots for the percentages of proteins with predicted abundances that can be explained by at least one of the three features (FDR < 0.1 and ρ ≥ 0.3). Different colors represent the percentages of proteins that can be best predicted by SCNA (orange), methylation (red), or mRNA (blue). Gray represents the percentage of proteins that cannot be predicted by any of the three features.
Fig. 4.
Fig. 4.
Protein expression regulated by miRNAs. (A) The miRNAs associated with protein expression. The regulatory signals from repression to activation are indicated on a low-to-high scale (blue-white-red) based on the KS test (p < 0.05). The bar plot on the right panel shows the numbers of cancer types that have repression observed. (B) and (C) Regulatory networks of the top-1 and top-2 miRNAs from (A). The negative correlations with significance are shown (Spearman's rank correlation, FDR < 0.1). (D) Box plots of Spearman's rank correlation coefficients of target proteins versus nontarget proteins at the mRNA and protein levels for has-miR-532–3p. KS test was used to assess the differences. *, p < 0.05; **, p < 0.01.
Fig. 5.
Fig. 5.
A nested co-expression network for proteins and cancer pathways. This nested co-expression network consists of an inner and an outer network, which, respectively, represents the connections between and within the 11 cancer pathways. The links between nodes are colored in red/green to indicate positive/negative correlations. The thickness of the links represents how many cancer types showing statistical significance (Spearman's rank correlation, FDR < 0.1). For simplicity, only the links supported by at least 10 cancer types are shown.
Fig. 6.
Fig. 6.
Clinical relevance of protein markers. (A) Bar plot for the number of proteins that are associated with overall patient survival times. (B) The protein associated with overall patient survival times observed in at least five cancer types. The circles represent an association showing significance in log-rank test or Cox proportional-hazards model (FDR < 0.1). The circle colors indicate that high protein expression is associated with better (red) or worse (blue) overall survival times than that with low expression based on the hazard ratios of Cox proportional-hazards model. (C) Kaplan Meier curves of fibronectin (FN1) in the nine cancer types. (D) Bar plot for the numbers of differentially expressed proteins among known tumor subtypes. (E) Bar plot for the numbers of differentially expressed proteins along with tumor stage and the red bars show the numbers of proteins with a monotonic change.

References

    1. Sheehan K. M., Calvert V. S., Kay E. W., Lu Y., Fishman D., Espina V., Aquino J., Speer R., Araujo R., Mills G. B., Liotta L. A., Petricoin E. F. 3rd, Wulfkuhle J. D. (2005) Use of reverse phase protein microarrays and reference standard development for molecular network analysis of metastatic ovarian carcinoma. Mol. Cell. Proteomics 4, 346–355 - PubMed
    1. Spurrier B., Ramalingam S., and Nishizuka S. (2008) Reverse-phase protein lysate microarrays for cell signaling analysis. Nat. Protoc. 3, 1796–1808 - PubMed
    1. Lu Y., Ling S., Hegde A. M., Byers L. A., Coombes K., Mills G. B., and Akbani R. (2016) Using reverse-phase protein arrays as pharmacodynamic assays for functional proteomics, biomarker discovery, and drug development in cancer. Semin. Oncol. 43, 476–483 - PMC - PubMed
    1. Li J., Lu Y., Akbani R., Ju Z., Roebuck P. L., Liu W., Yang J. Y., Broom B. M., Verhaak R. G., Kane D. W., Wakefield C., Weinstein J. N., Mills G. B., and Liang H. (2013) TCPA: A resource for cancer functional proteomics data. Nat. Methods 10, 1046–1047 - PMC - PubMed
    1. Li J., Zhao W., Akbani R., Liu W., Ju Z., Ling S., Vellano C. P., Roebuck P., Yu Q., Eterovic A. K., Byers L. A., Davies M. A., Deng W., Gopal Y. N., Chen G., von Euw E. M., Slamon D., Conklin D., Heymach J. V., Gazdar A. F., Minna J. D., Myers J. N., Lu Y., Mills G. B., and Liang H. (2017) Characterization of human cancer cell lines by reverse-phase protein arrays. Cancer Cell 31, 225–239 - PMC - PubMed

Publication types

LinkOut - more resources