

Cutting Edge: Synapse Propensity of Human Memory CD8 T Cells Confers Competitive Advantage over Naive Counterparts
- PMID: 31201237
- PMCID: PMC6643047
- DOI: 10.4049/jimmunol.1801687
Cutting Edge: Synapse Propensity of Human Memory CD8 T Cells Confers Competitive Advantage over Naive Counterparts
Abstract
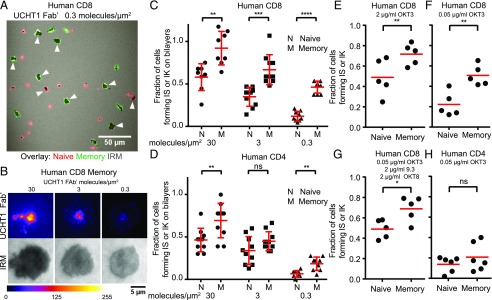
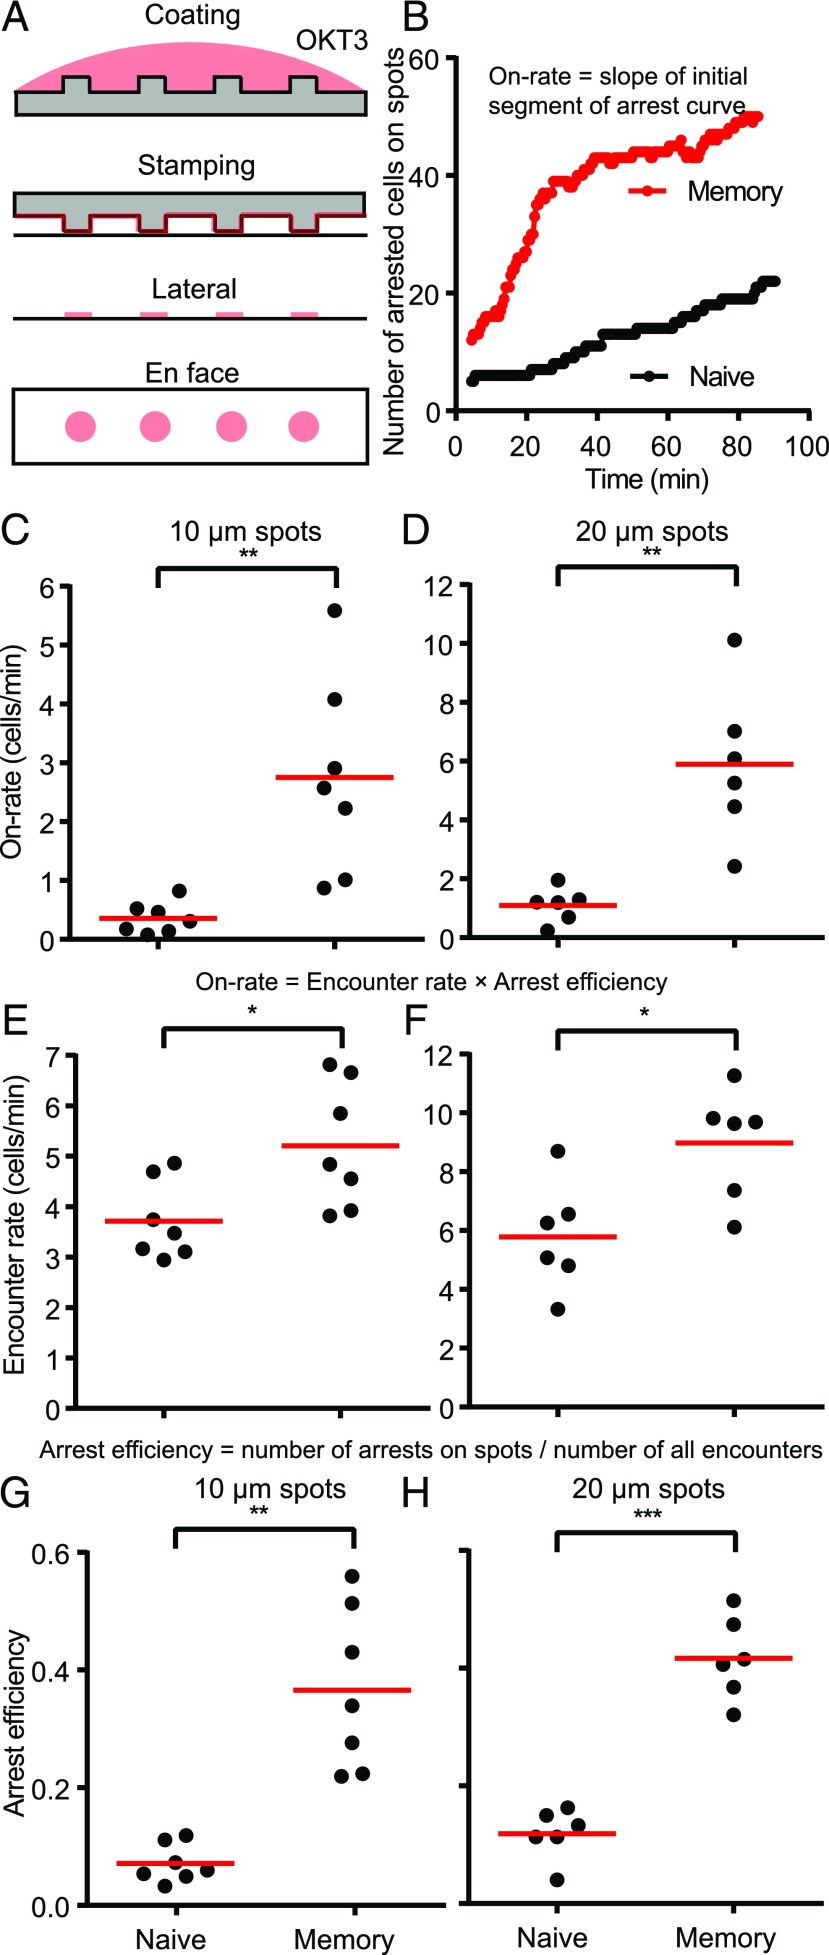
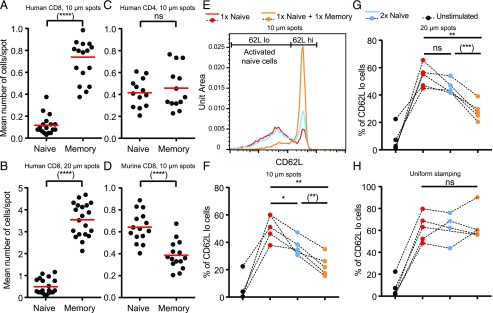
Memory T cells are endowed with multiple functional features that enable them to be more protective than naive T cells against infectious threats. It is not known if memory cells have a higher synapse propensity (SP; i.e., increased probability to form immature immunological synapses that then provide an entry into different modes of durable interaction with APCs). In this study, we show that only human memory CD8 T cells have remarkably high SP compared with naive counterparts. Such a dichotomy between naive and memory cells is not observed within the human CD4 or murine CD8 T cell population. Higher SP in human memory CD8 T cells allows them to outcompete and prevent naive CD8 T cells from getting recruited to the response. This observation has implications for original antigenic sin and aging of the immune system in humans.
Copyright © 2019 The Authors.
Figures
Similar articles
-
Spontaneous proliferation of memory (CD45RO+) and naive (CD45RO-) subsets of CD4 cells and CD8 cells in human T lymphotropic virus (HTLV) infection: distinctive patterns for HTLV-I versus HTLV-II.Clin Exp Immunol. 1995 Nov;102(2):256-61. doi: 10.1111/j.1365-2249.1995.tb03774.x. Clin Exp Immunol. 1995. PMID: 7586675 Free PMC article.
-
CD95-mediated apoptosis in naïve, central and effector memory subsets of CD4+ and CD8+ T cells in aged humans.Exp Gerontol. 2008 Apr;43(4):266-74. doi: 10.1016/j.exger.2007.12.006. Epub 2008 Jan 22. Exp Gerontol. 2008. PMID: 18215485
-
Naïve and central memory T-cell lymphopenia in end-stage renal disease.Kidney Int. 2006 Jul;70(2):371-6. doi: 10.1038/sj.ki.5001550. Epub 2006 May 31. Kidney Int. 2006. PMID: 16738532
-
The descent of memory T-cell subsets.Nat Rev Immunol. 2006 Aug;6(8):618-23. doi: 10.1038/nri1866. Nat Rev Immunol. 2006. PMID: 16868553 Review.
-
CD8 T cell memory.Semin Immunol. 2004 Oct;16(5):305-14. doi: 10.1016/j.smim.2004.08.011. Semin Immunol. 2004. PMID: 15528075 Review.
Cited by
-
Possibilities of using T-cell biophysical biomarkers of ageing.Expert Rev Mol Med. 2022 Sep 16;24:e35. doi: 10.1017/erm.2022.29. Expert Rev Mol Med. 2022. PMID: 36111609 Free PMC article. Review.
-
LFA-1 and kindlin-3 enable the collaborative transport of SLP-76 microclusters by myosin and dynein motors.J Cell Sci. 2021 Aug 15;134(16):jcs258602. doi: 10.1242/jcs.258602. Epub 2021 Aug 27. J Cell Sci. 2021. PMID: 34279667 Free PMC article.
-
Immunosenescence is both functional/adaptive and dysfunctional/maladaptive.Semin Immunopathol. 2020 Oct;42(5):521-536. doi: 10.1007/s00281-020-00818-9. Epub 2020 Sep 15. Semin Immunopathol. 2020. PMID: 32930852 Free PMC article. Review.
-
Impact of antigenic evolution and original antigenic sin on SARS-CoV-2 immunity.J Clin Invest. 2023 Jan 3;133(1):e162192. doi: 10.1172/JCI162192. J Clin Invest. 2023. PMID: 36594464 Free PMC article. Review.
-
Anti-CD19 CAR T cells potently redirected to kill solid tumor cells.PLoS One. 2021 Mar 18;16(3):e0247701. doi: 10.1371/journal.pone.0247701. eCollection 2021. PLoS One. 2021. PMID: 33735268 Free PMC article.
References
-
- Slifka M. K., Whitton J. L. 2001. Functional avidity maturation of CD8(+) T cells without selection of higher affinity TCR. Nat. Immunol. 2: 711–717. - PubMed
-
- Croft M., Bradley L. M., Swain S. L. 1994. Naive versus memory CD4 T cell response to antigen. Memory cells are less dependent on accessory cell costimulation and can respond to many antigen-presenting cell types including resting B cells. J. Immunol. 152: 2675–2685. - PubMed
-
- Veiga-Fernandes H., Walter U., Bourgeois C., McLean A., Rocha B. 2000. Response of naïve and memory CD8+ T cells to antigen stimulation in vivo. Nat. Immunol. 1: 47–53. - PubMed
Publication types
MeSH terms
Grants and funding
LinkOut - more resources
Full Text Sources
Research Materials
Miscellaneous
