The Transcriptional Regulator Id2 Is Critical for Adipose-Resident Regulatory T Cell Differentiation, Survival, and Function
- PMID: 31201238
- PMCID: PMC6650328
- DOI: 10.4049/jimmunol.1900358
The Transcriptional Regulator Id2 Is Critical for Adipose-Resident Regulatory T Cell Differentiation, Survival, and Function
Abstract
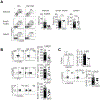
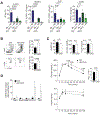
Adipose regulatory T cells (aTregs) have emerged as critical cells for the control of local and systemic inflammation. In this study, we show a distinctive role for the transcriptional regulator Id2 in the differentiation, survival, and function of aTregs in mice. Id2 was highly expressed in aTregs compared with high Id3 expression in lymphoid regulatory T cells (Tregs). Treg-specific deletion of Id2 resulted in a substantial decrease in aTregs, whereas Tregs in the spleen and lymph nodes were unaffected. Additionally, loss of Id2 resulted in decreased expression of aTreg-associated markers, including ST2, CCR2, KLRG1, and GATA3. Gene expression analysis revealed that Id2 expression was essential for the survival of aTregs, and loss of Id2 increased cell death in aTregs due to increased Fas expression. Id2-mediated aTreg depletion resulted in increased systemic inflammation, increased inflammatory macrophages and CD8+ effector T cells, and loss of glucose tolerance under standard diet conditions. Thus, we reveal an unexpected and novel function for Id2 in mediating differentiation, survival, and function of aTregs that when lost result in increased metabolic perturbation.
Copyright © 2019 by The American Association of Immunologists, Inc.
Figures


Similar articles
-
ID2 and ID3 are indispensable for Th1 cell differentiation during influenza virus infection in mice.Eur J Immunol. 2019 Mar;49(3):476-489. doi: 10.1002/eji.201847822. Epub 2019 Jan 4. Eur J Immunol. 2019. PMID: 30578645
-
The transcriptional regulators Id2 and Id3 control the formation of distinct memory CD8+ T cell subsets.Nat Immunol. 2011 Nov 6;12(12):1221-9. doi: 10.1038/ni.2158. Nat Immunol. 2011. PMID: 22057289 Free PMC article.
-
Id2 and Id3 maintain the regulatory T cell pool to suppress inflammatory disease.Nat Immunol. 2014 Aug;15(8):767-76. doi: 10.1038/ni.2928. Epub 2014 Jun 29. Nat Immunol. 2014. PMID: 24973820 Free PMC article.
-
Shifting gears: Id3 enables recruitment of E proteins to new targets during T cell development and differentiation.Front Immunol. 2022 Aug 2;13:956156. doi: 10.3389/fimmu.2022.956156. eCollection 2022. Front Immunol. 2022. PMID: 35983064 Free PMC article. Review.
-
A Unique Population: Adipose-Resident Regulatory T Cells.Front Immunol. 2018 Sep 28;9:2075. doi: 10.3389/fimmu.2018.02075. eCollection 2018. Front Immunol. 2018. PMID: 30323806 Free PMC article. Review.
Cited by
-
Single-cell analysis reveals TLR-induced macrophage heterogeneity and quorum sensing dictate population wide anti-inflammatory feedback in response to LPS.Front Immunol. 2023 Feb 24;14:1135223. doi: 10.3389/fimmu.2023.1135223. eCollection 2023. Front Immunol. 2023. PMID: 36911668 Free PMC article.
-
The role of transcription factors in shaping regulatory T cell identity.Nat Rev Immunol. 2023 Dec;23(12):842-856. doi: 10.1038/s41577-023-00893-7. Epub 2023 Jun 19. Nat Rev Immunol. 2023. PMID: 37336954 Free PMC article. Review.
-
Regulatory T cell-derived IL-1Ra suppresses the innate response to respiratory viral infection.Nat Immunol. 2023 Dec;24(12):2091-2107. doi: 10.1038/s41590-023-01655-2. Epub 2023 Nov 9. Nat Immunol. 2023. PMID: 37945820 Free PMC article.
-
Ubiquitin Specific Protease 1 Expression and Function in T Cell Immunity.J Immunol. 2021 Sep 1;207(5):1377-1387. doi: 10.4049/jimmunol.2100303. Epub 2021 Aug 11. J Immunol. 2021. PMID: 34380645 Free PMC article.
-
Recirculating Foxp3+ regulatory T cells are restimulated in the thymus under Aire control.Cell Mol Life Sci. 2022 Jun 9;79(7):355. doi: 10.1007/s00018-022-04328-9. Cell Mol Life Sci. 2022. PMID: 35678896 Free PMC article.
References
Publication types
MeSH terms
Substances
Grants and funding
LinkOut - more resources
Full Text Sources
Molecular Biology Databases
Research Materials
Miscellaneous

